

Effect of Different Broad Waveband Lights on Membrane Lipids of a Cyanobacterium, Synechococcus sp., as Determined by UPLC-QToF-MS and Vibrational Spectroscopy
- PMID: 27223306
- PMCID: PMC4929536
- DOI: 10.3390/biology5020022
Effect of Different Broad Waveband Lights on Membrane Lipids of a Cyanobacterium, Synechococcus sp., as Determined by UPLC-QToF-MS and Vibrational Spectroscopy
Abstract
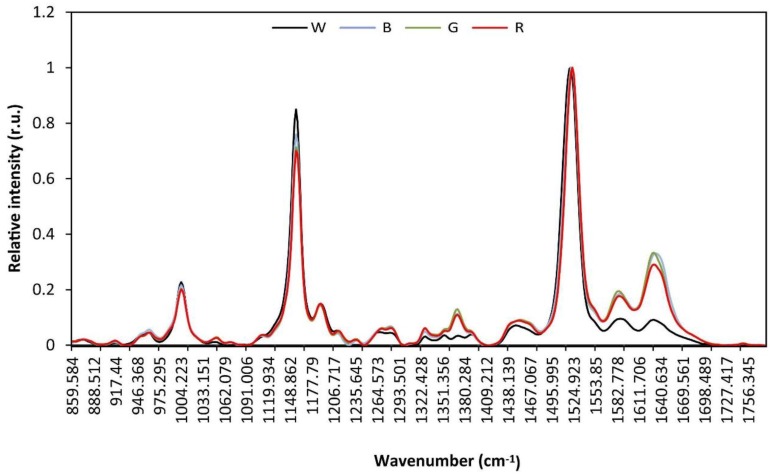
Differential profile of membrane lipids and pigments of a Synechococcus sp. cyanobacterial strain cells exposed to blue, green, red and white light are determined by means of liquid chromatography and mass spectrometry or diode array detection. Raman and ATR-IR spectra of intact cells under the diverse light wavebands are also reported. Blue light cells exhibited an increased content of photosynthetic pigments as well as specific species of membrane glycerolipids as compared to cells exposed to other wavebands. The A630/A680 ratio indicated an increased content of phycobilisomes (PBS) in the blue light-exposed cells. Some differences in the protein conformation between the four light waveband-exposed cells were deduced from the variable absorbance at specific wavenumbers in the FT-Raman and ATR-FTIR spectra, in particular bands assigned to amide I and amide II. Bands from 1180 to 950 cm(-1) in the ATR-FTIR spectrum suggest degraded outer membrane polysaccharide in the blue light-exposed cells.
Keywords: IR; Raman; Synechococcus sp.; UPLC-MS; light quality; lipids; pigments; vibrational spectroscopy.
Figures


Similar articles
-
Differential Membrane Lipid Profiles and Vibrational Spectra of Three Edaphic Algae and One Cyanobacterium.Int J Mol Sci. 2021 Oct 19;22(20):11277. doi: 10.3390/ijms222011277. Int J Mol Sci. 2021. PMID: 34681936 Free PMC article.
-
A1 reduction in intact cyanobacterial photosystem I particles studied by time-resolved step-scan Fourier transform infrared difference spectroscopy and isotope labeling.Biochemistry. 2005 Feb 15;44(6):1880-93. doi: 10.1021/bi0497493. Biochemistry. 2005. PMID: 15697214
-
Resonance Raman spectra of phycocyanin, allophycocyanin and phycobilisomes from blue-green alga Anacystis nidulans.Biochem Biophys Res Commun. 1985 Jul 16;130(1):358-63. doi: 10.1016/0006-291x(85)90425-5. Biochem Biophys Res Commun. 1985. PMID: 3927904
-
Screening of synthetic PDE-5 inhibitors and their analogues as adulterants: analytical techniques and challenges.J Pharm Biomed Anal. 2014 Jan;87:176-90. doi: 10.1016/j.jpba.2013.04.037. Epub 2013 May 6. J Pharm Biomed Anal. 2014. PMID: 23721687 Review.
-
Raman and infrared spectroscopy of carbohydrates: A review.Spectrochim Acta A Mol Biomol Spectrosc. 2017 Oct 5;185:317-335. doi: 10.1016/j.saa.2017.05.045. Epub 2017 May 24. Spectrochim Acta A Mol Biomol Spectrosc. 2017. PMID: 28599236 Review.
Cited by
-
Differential Membrane Lipid Profiles and Vibrational Spectra of Three Edaphic Algae and One Cyanobacterium.Int J Mol Sci. 2021 Oct 19;22(20):11277. doi: 10.3390/ijms222011277. Int J Mol Sci. 2021. PMID: 34681936 Free PMC article.
-
Genome-Wide Characterization and Analysis of the bHLH Transcription Factor Family in Suaeda aralocaspica, an Annual Halophyte With Single-Cell C4 Anatomy.Front Genet. 2022 Jul 7;13:927830. doi: 10.3389/fgene.2022.927830. eCollection 2022. Front Genet. 2022. PMID: 35873472 Free PMC article.
References
-
- Partensky F., Blanchot J., Vaulot D. Differential distribution and ecology of Phrochlorococcus and Synechococcus in oceanic waters: A review. In: Charpy L., Larkum A., editors. Marine Cyanobacteria. Bulletin de l'Institut Océanographique de Monaco; Montpellier, France: 1999. pp. 457–475.
-
- Morel A. Optical properties of pure water and pure sea water. In: Jerlov N.G., Nielsen E.S., editors. Optical aspects of Oceanography. Academic; London, UK: 1974. pp. 1–24.
-
- Whitehead R.F., de Mora S.J., Demers S. Enhanced UV radiation—A new problem for the marine environment. In: de Mora S., Demers S., Vernet M., editors. The Effects of UV Radiation in the Marine Environment. Cambridge University Press; Cambridge, UK: 2000. pp. 1–34.
-
- Ferris M.J., Palenik B. Niche adaptation in ocean cyanobacteria. Nature. 1998;396:227–228. doi: 10.1038/24297. - DOI
LinkOut - more resources
Full Text Sources
Other Literature Sources
Miscellaneous
