Combined Effects of Ocean Warming and Acidification on Copepod Abundance, Body Size and Fatty Acid Content
- PMID: 27224476
- PMCID: PMC4880321
- DOI: 10.1371/journal.pone.0155952
Combined Effects of Ocean Warming and Acidification on Copepod Abundance, Body Size and Fatty Acid Content
Abstract
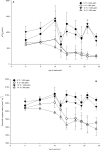
Concerns about increasing atmospheric CO2 concentrations and global warming have initiated studies on the consequences of multiple-stressor interactions on marine organisms and ecosystems. We present a fully-crossed factorial mesocosm study and assess how warming and acidification affect the abundance, body size, and fatty acid composition of copepods as a measure of nutritional quality. The experimental set-up allowed us to determine whether the effects of warming and acidification act additively, synergistically, or antagonistically on the abundance, body size, and fatty acid content of copepods, a major group of lower level consumers in marine food webs. Copepodite (developmental stages 1-5) and nauplii abundance were antagonistically affected by warming and acidification. Higher temperature decreased copepodite and nauplii abundance, while acidification partially compensated for the temperature effect. The abundance of adult copepods was negatively affected by warming. The prosome length of copepods was significantly reduced by warming, and the interaction of warming and CO2 antagonistically affected prosome length. Fatty acid composition was also significantly affected by warming. The content of saturated fatty acids increased, and the ratios of the polyunsaturated essential fatty acids docosahexaenoic- (DHA) and arachidonic acid (ARA) to total fatty acid content increased with higher temperatures. Additionally, here was a significant additive interaction effect of both parameters on arachidonic acid. Our results indicate that in a future ocean scenario, acidification might partially counteract some observed effects of increased temperature on zooplankton, while adding to others. These may be results of a fertilizing effect on phytoplankton as a copepod food source. In summary, copepod populations will be more strongly affected by warming rather than by acidifying oceans, but ocean acidification effects can modify some temperature impacts.
Conflict of interest statement
Figures


References
-
- IPCC. Climate Change 2014: Mitigation of Climate Change Contribution of Working Group III to the Fifth Assessment Report of the Intergovernmental Panel on Climate Change. Cambridge, United Kingdom and New York, NY, USA.: Cambridge University Press; 2014.
-
- Hare CE, Leblanc K, DiTullio GR, Kudela RM, Zhang Y, Lee PA, et al. Consequences of increased temperature and CO2 for phytoplankton community structure in the Bering Sea. Mar Ecol Prog Ser. 2007;352: 9–16. 10.3354/meps07182 - DOI
-
- Rose JM, Feng Y, Gobler CJ, Gutierrez R. Effects of increased pCO2 and temperature on the North Atlantic spring bloom. II. Microzooplankton abundance and grazing. Mar Ecol Prog Ser. 2009.
Publication types
MeSH terms
Substances
LinkOut - more resources
Full Text Sources
Other Literature Sources

