. 2016 Jun 28;7(26):39931-39944.
doi: 10.18632/oncotarget.9539.

Screen-identified selective inhibitor of lysine demethylase 5A blocks cancer cell growth and drug resistance

Affiliations

Screen-identified selective inhibitor of lysine demethylase 5A blocks cancer cell growth and drug resistance

Molly Gale et al. Oncotarget. .

Abstract

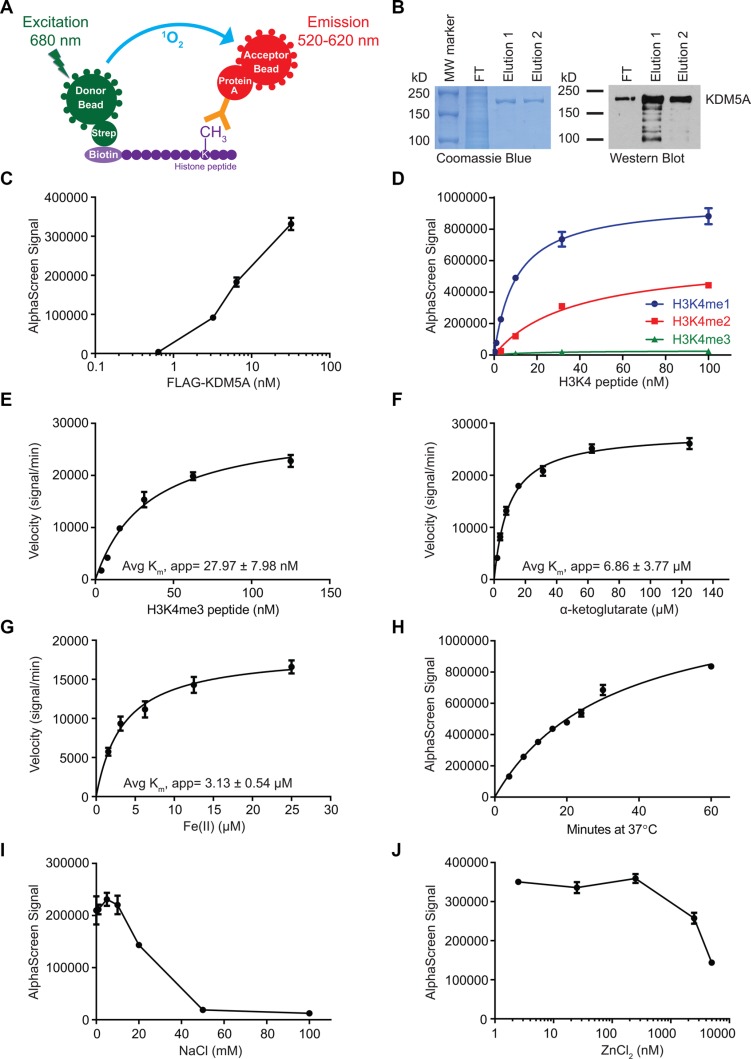
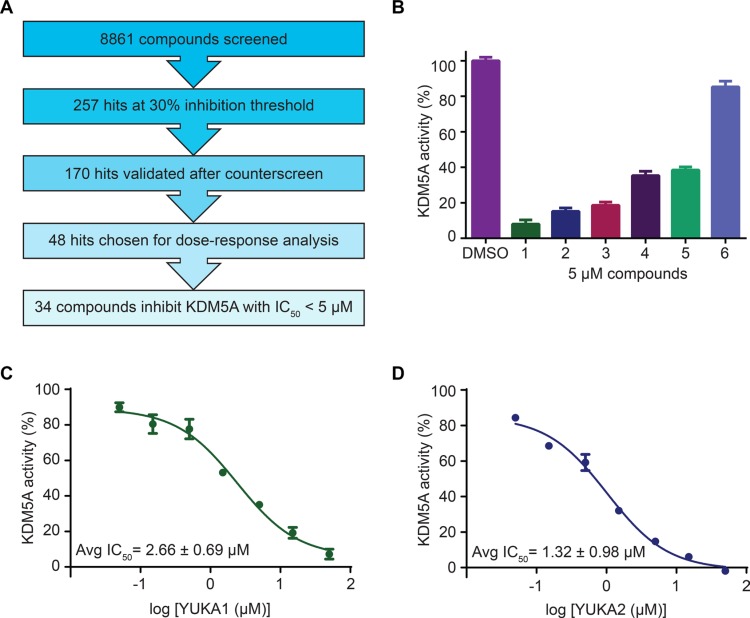
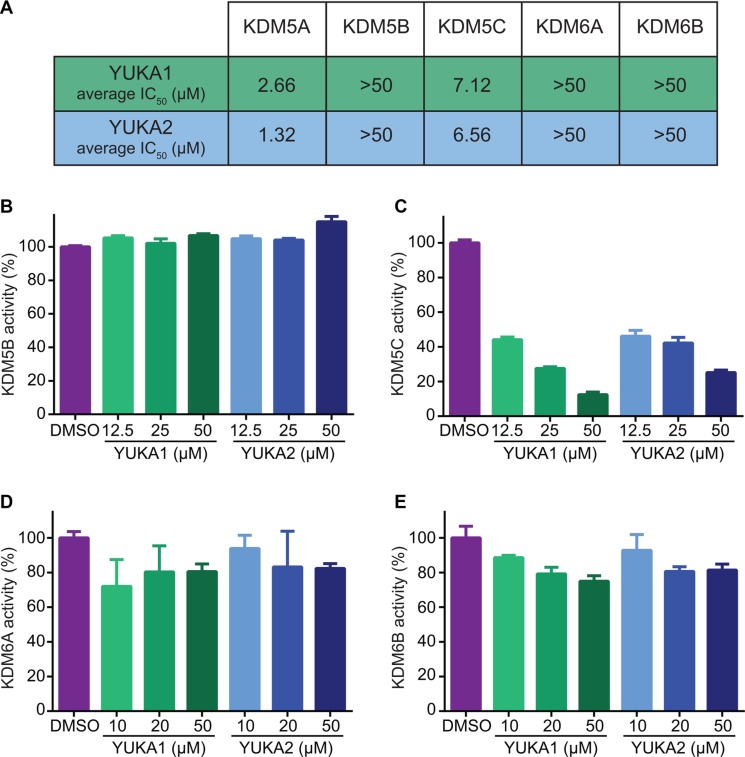
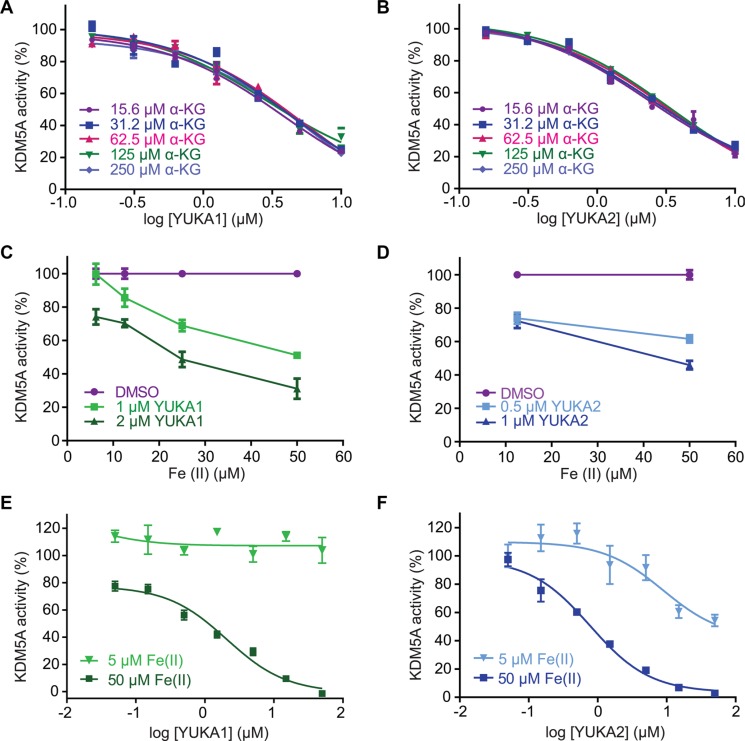
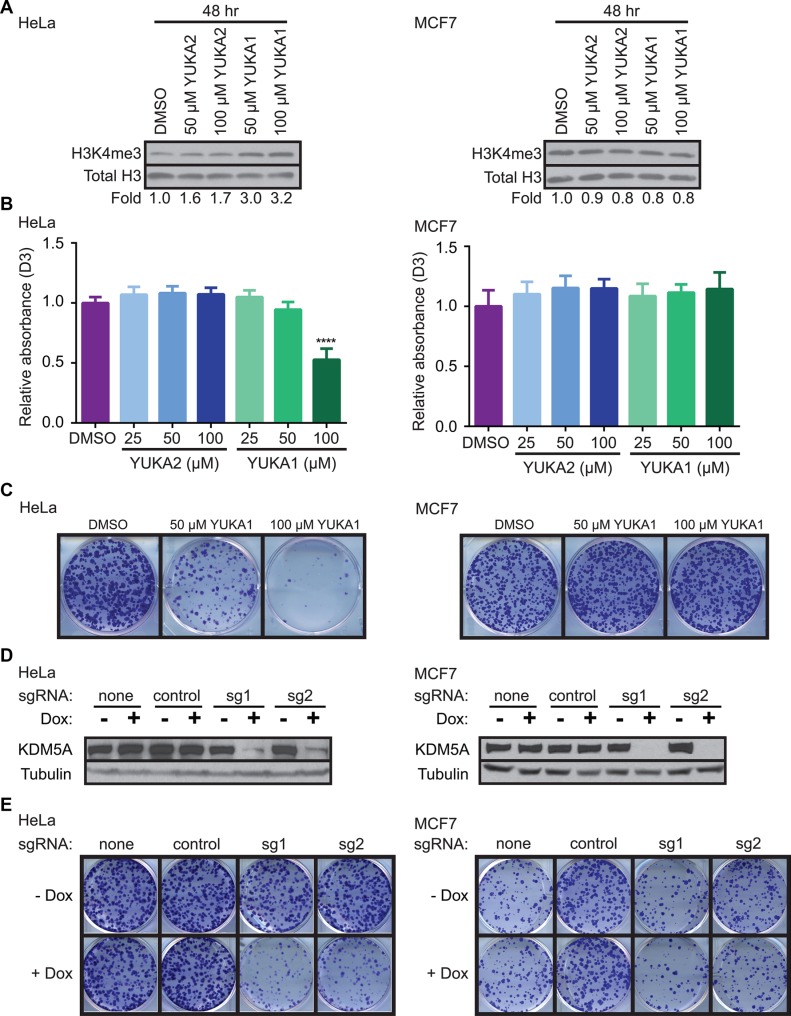
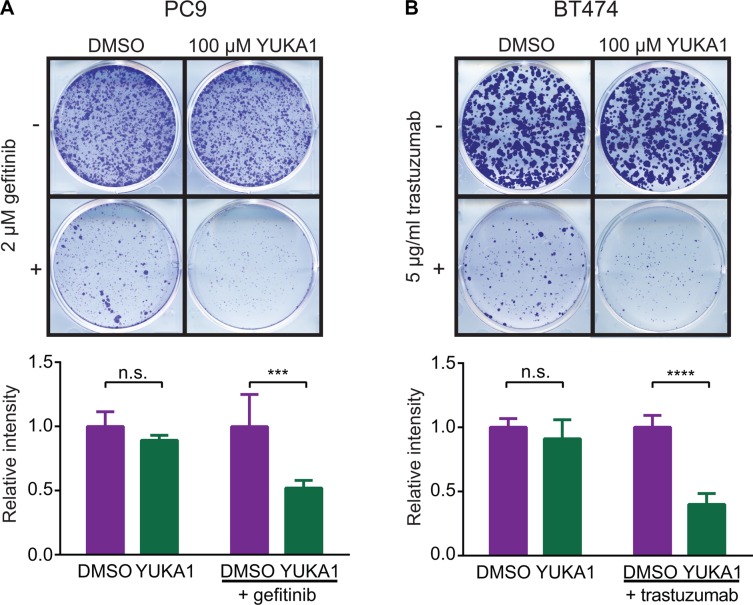
Lysine demethylase 5A (KDM5A/RBP2/JARID1A) is a histone lysine demethylase that is overexpressed in several human cancers including lung, gastric, breast and liver cancers. It plays key roles in important cancer processes including tumorigenesis, metastasis, and drug tolerance, making it a potential cancer therapeutic target. Chemical tools to analyze KDM5A demethylase activity are extremely limited as available inhibitors are not specific for KDM5A. Here, we characterized KDM5A using a homogeneous luminescence-based assay and conducted a screen of about 9,000 small molecules for inhibitors. From this screen, we identified several 3-thio-1,2,4-triazole compounds that inhibited KDM5A with low μM in vitro IC50 values. Importantly, these compounds showed great specificity and did not inhibit its close homologue KDM5B (PLU1/JARID1B) or the related H3K27 demethylases KDM6A (UTX) and KDM6B (JMJD3). One compound, named YUKA1, was able to increase H3K4me3 levels in human cells and selectively inhibit the proliferation of cancer cells whose growth depends on KDM5A. As KDM5A was shown to mediate drug tolerance, we investigated the ability of YUKA1 to prevent drug tolerance in EGFR-mutant lung cancer cells treated with gefitinib and HER2+ breast cancer cells treated with trastuzumab. Remarkably, this compound hindered the emergence of drug-tolerant cells, highlighting the critical role of KDM5A demethylase activity in drug resistance. The small molecules presented here are excellent tool compounds for further study of KDM5A's demethylase activity and its contributions to cancer.

Keywords: KDM5A; anti-cancer drug; drug resistance; epigenetics; histone demethylase inhibitor.


Conflict of interest statement

The authors declare that they have no conflicts of interest with the content of this article.

Figures

Figure 1
Figure 1. Biochemical characterization of KDM5A using AlphaScreen
(A) Schematic of the AlphaScreen assay used to measure demethylation of biotinylated H3K4me3 peptides by KDM5A. strep, streptavidin. (B) Verification of affinity purified full-length FLAG-KDM5A by Coomassie Brilliant Blue stain (left) and anti-KDM5A western blot (right). MW, molecular weight; FT, flow-through. (C) Titration of FLAG-KDM5A in AlphaScreen assays. (D) Assessment of the specificity of the H3K4me1/2 antibody using mono-, di-, and tri-methylated H3K4 peptides. (EG) Determination of the average apparent Km of H3K4me3 peptide (E), α-KG (F), and Fe(II) (G) from two independent experiments. (H) Time course of the KDM5A demethylation reaction. (IJ) Titration of NaCl (I) and ZnCl2 (J) in the KDM5A demethylation reaction. Data points in C-J represent mean ± SD. Data are representative of at least two independent experiments performed in triplicate.
Figure 2
Figure 2. Screen overview and top hits
(A) Overview of the screening and hit selection process. (B) Validation of selected hits with a 3-thio-1,2,4-triazole core. The names and structures of these compounds are listed in Table 1. (CD) Dose-response analysis for YUKA1 (C) and YUKA2 (D). Data are representative of at least four independent experiments performed in triplicate. Data points and bars in B-D indicate mean ± SEM.
Figure 3
Figure 3. YUKA1 and YUKA2 are KDM5A/C specific inhibitors
(A) The average IC50 values of YUKA1 and YUKA2 for members of the KDM5 and KDM6 families determined by at least three independent experiments performed in triplicate. (BE) Activity of KDM5B (B), KDM5C (C), KDM6A (D) and KDM6B (E) with the indicated compounds in AlphaScreen assays. Bars in B-D indicate mean ± SEM.
Figure 4
Figure 4. Mechanistic characterization of YUKA1 and YUKA2
(AB) Dose-response analysis of YUKA1 (A) and YUKA2 (B) over a 16-fold range of concentrations of α-KG. (CD) Inhibition of KDM5A by YUKA1 (C) and YUKA2 (D) in reactions with varying concentrations of Fe(II). (EF) Dose-response analysis of YUKA1 (E) and YUKA2 (F) at the indicated Fe(II) concentrations. Data points in A-F indicate mean ± SEM. Data are representative of at least two independent experiments performed in triplicate.
Figure 5
Figure 5. YUKA1 is cell-active and selectively inhibits proliferation of KDM5A-dependent cancer cells
(A) Representative western blot analysis of H3K4me3 in HeLa (left) and MCF7 (right) cells after 48 hour treatment with the indicated compounds. Fold represents the relative ratio of band intensity for H3K4me3 divided by Total H3 loading control, normalized to DMSO control. (B) WST-1 proliferation assays of HeLa (left) and MCF7 (right) cells in the presence of YUKA1 and YUKA2 at the indicated concentrations. Bars indicate mean ± SD of three independent experiments performed in quadruplicate. Asterisks indicate significance by unpaired t test (****p < 0.0001). D3, day 3; D0, day 0. (C) Colony formation assays of HeLa (left) and MCF7 (right) cells treated with DMSO or YUKA1 for 12 days. Representative wells are shown. Quantification is shown in Supplementary Figure 2A. (D) Representative western blot analysis of HeLa (left) and MCF7 (right) cells with doxycycline-induced KDM5A deletion using the CRISPR/Cas9 system. (E) Colony formation assays of HeLa (left) and MCF7 (right) cells shown in panel D at 12 (HeLa) or 19 (MCF7) days after induction. Representative wells are shown. Quantification is shown in Supplementary Figure 2B. Dox, doxycycline; sg1, sgRNA 1; sg2, sgRNA 2.
Figure 6
Figure 6. Effect of YUKA1 on anti-cancer drug resistance
(A) Colony formation assays of PC9 cells treated with DMSO or YUKA1 for 7 days (top wells), or treated with 2 μM gefitinib plus DMSO or YUKA1 for 35 days (bottom wells). (B) Colony formation assays of BT474 cells treated with DMSO or YUKA1 for 35 days (top wells), or treated with 5 μg/mL trastuzumab plus DMSO or YUKA1 for 42 days (bottom wells). Representative wells are shown in the top panel and quantification from three independent experiments performed in triplicate is shown in the bottom panel. Asterisks indicate significance by unpaired t test (***p = 0.0002; ****p < 0.0001). Bars indicate mean ± SD. Relative intensity is the measured intensity value divided by the average value of DMSO-treated wells.

References

    1. Kouzarides T. Chromatin modifications and their function. Cell. 2007;128:693–705. - PubMed
    1. Bernstein BE, Meissner A, Lander ES. The mammalian epigenome. Cell. 2007;128:669–681. - PubMed
    1. Arrowsmith CH, Bountra C, Fish PV, Lee K, Schapira M. Epigenetic protein families: a new frontier for drug discovery. Nat Rev Drug Discov. 2012;11:384–400. - PubMed
    1. Dawson MA, Kouzarides T. Cancer epigenetics: from mechanism to therapy. Cell. 2012;150:12–27. - PubMed
    1. Blair LP, Cao J, Zou MR, Sayegh J, Yan Q. Epigenetic Regulation by Lysine Demethylase 5 (KDM5) Enzymes in Cancer. Cancers. 2011;3:1383–1404. - PMC - PubMed