. 2016 Jun 21;7(25):37436-37455.
doi: 10.18632/oncotarget.9545.

The FOXG1/FOXO/SMAD network balances proliferation and differentiation of cortical progenitors and activates Kcnh3 expression in mature neurons

Affiliations

The FOXG1/FOXO/SMAD network balances proliferation and differentiation of cortical progenitors and activates Kcnh3 expression in mature neurons

Riccardo Vezzali et al. Oncotarget. .

Abstract

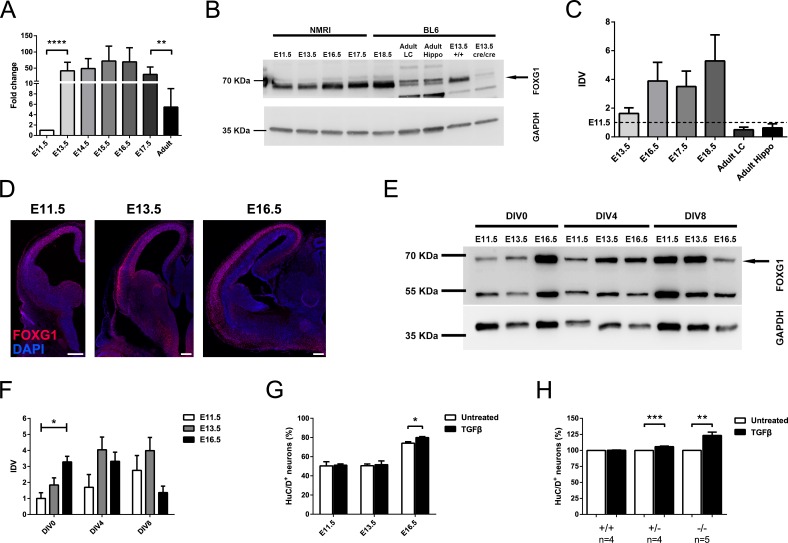
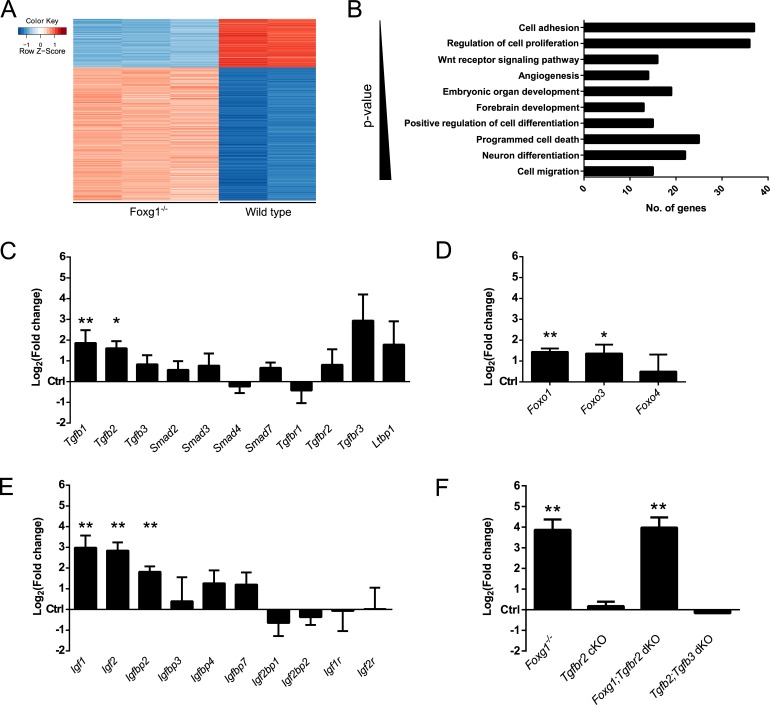
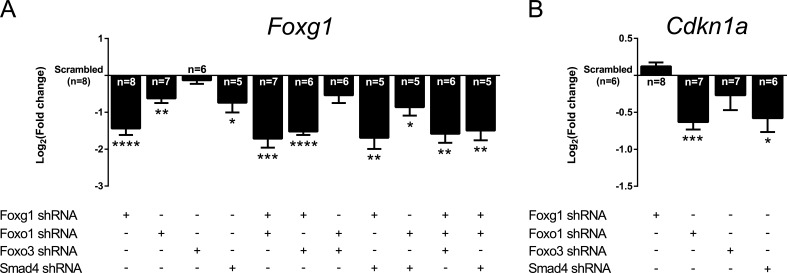
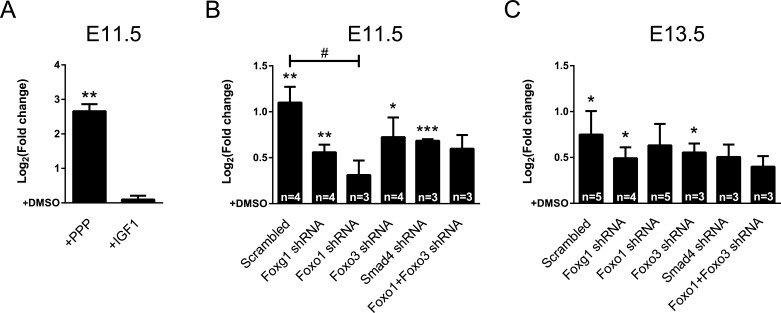
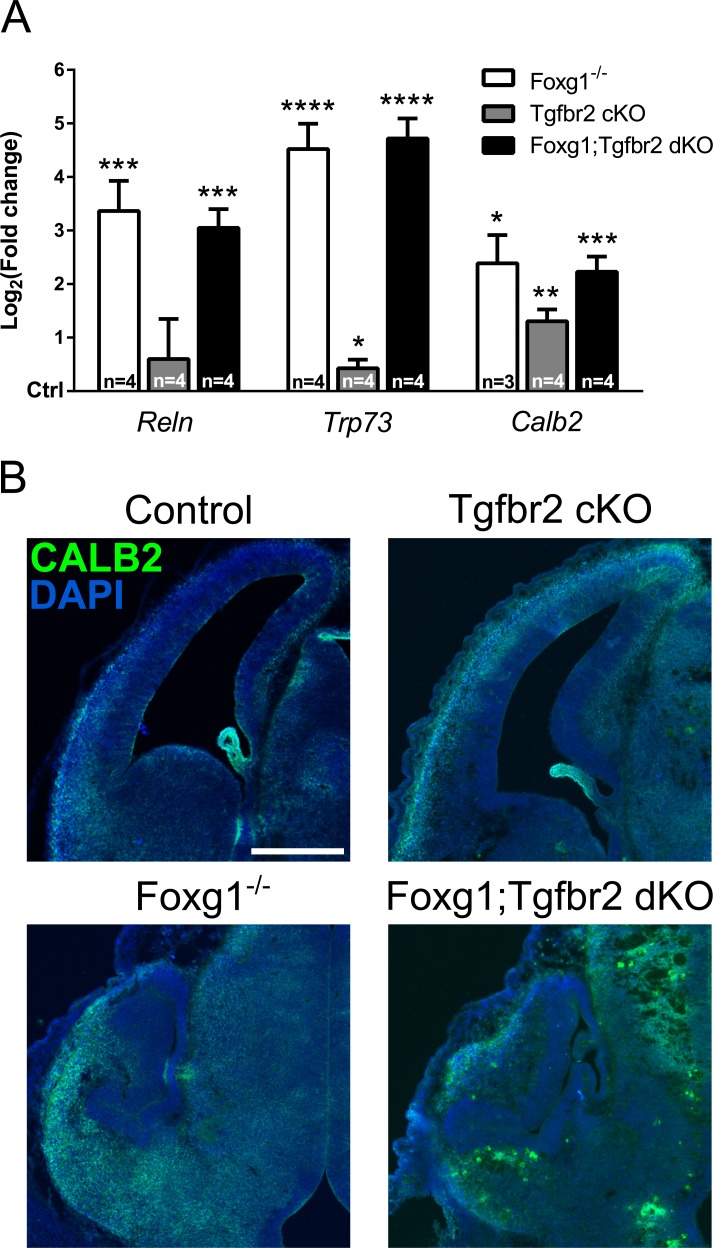
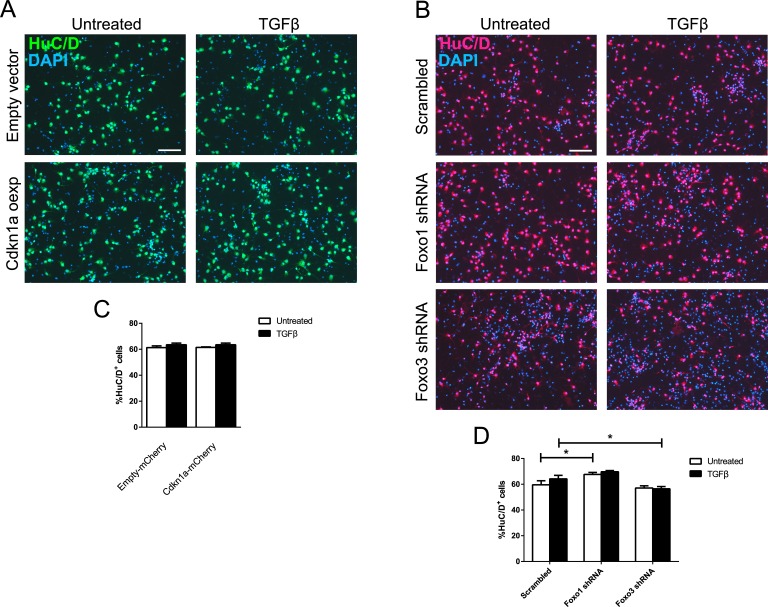
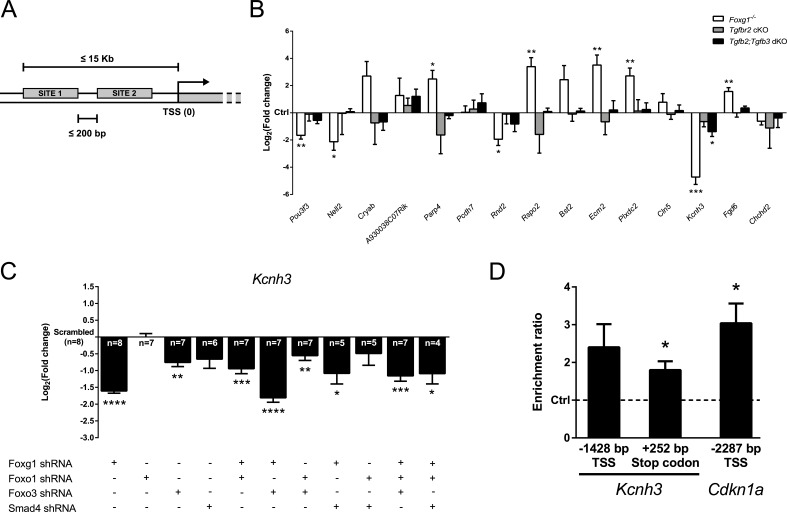
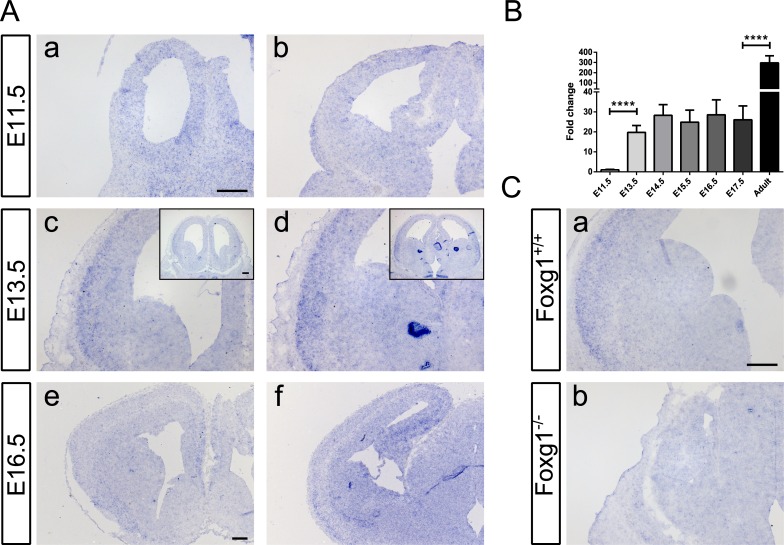
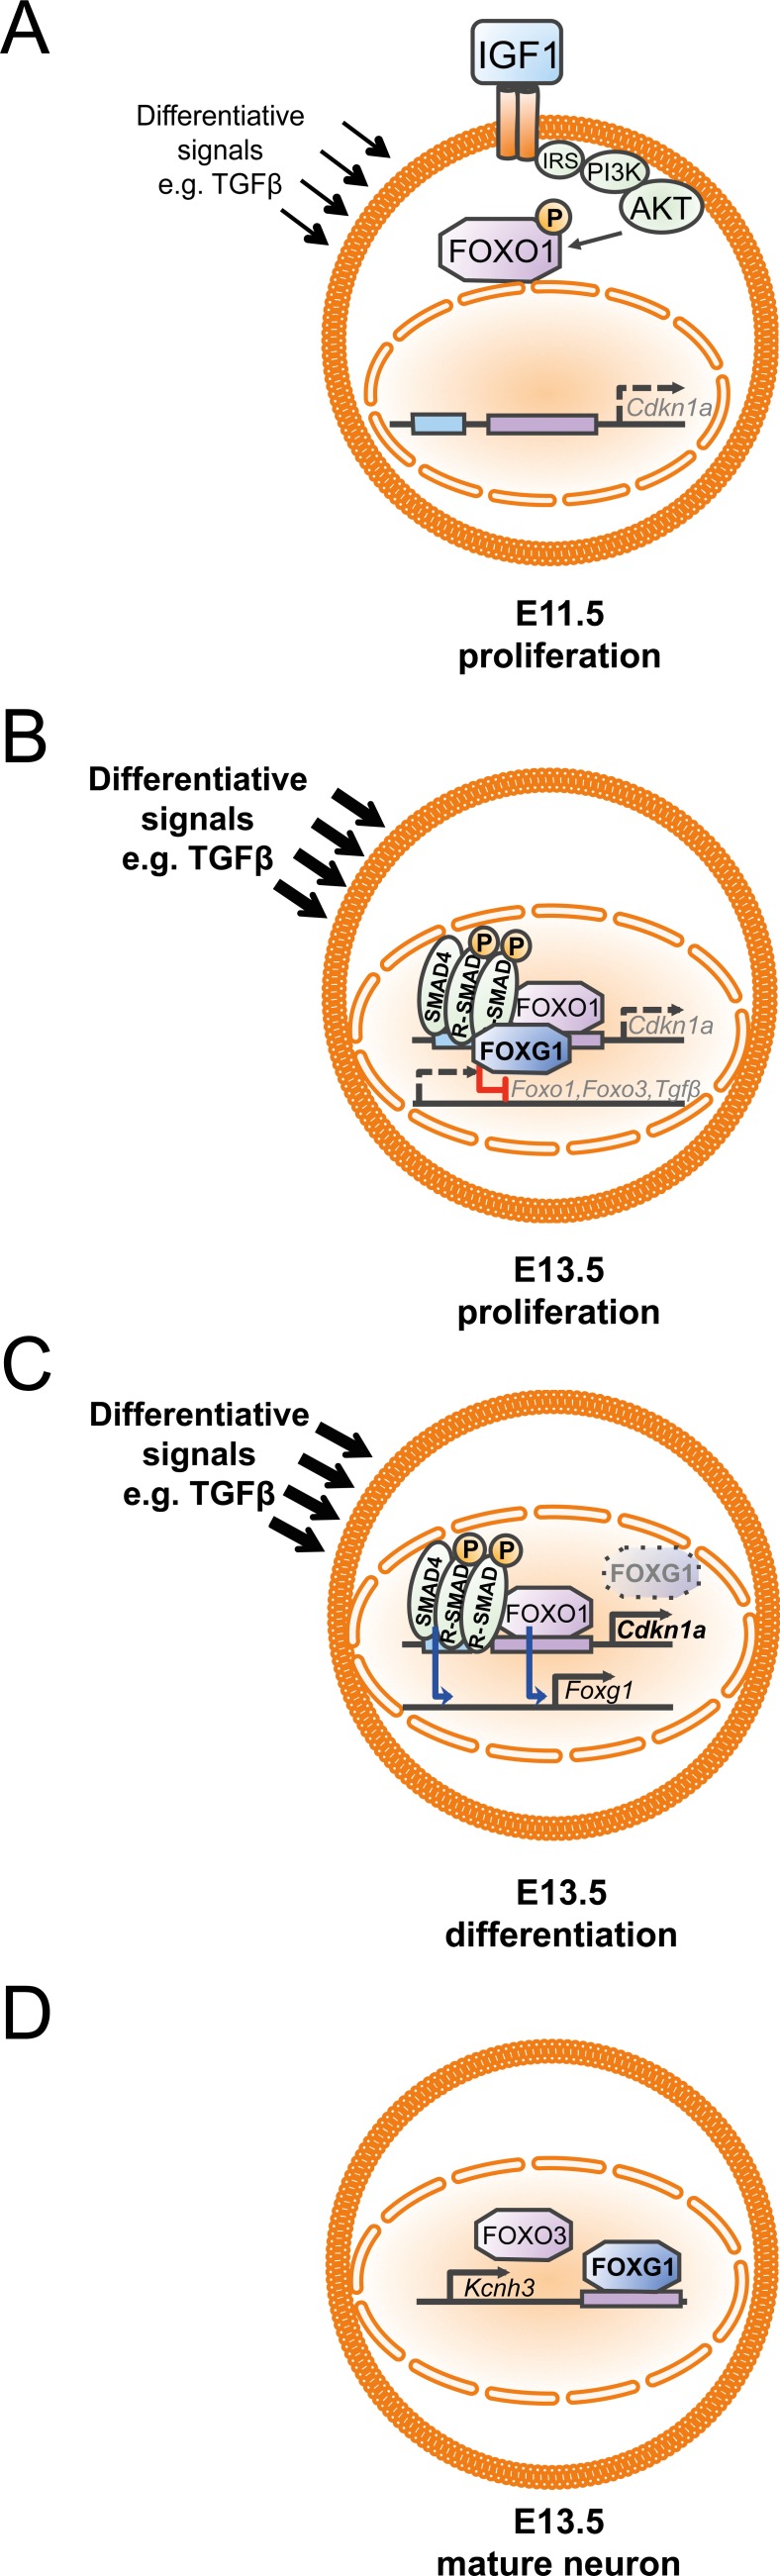
Transforming growth factor β (TGFβ)-mediated anti-proliferative and differentiating effects promote neuronal differentiation during embryonic central nervous system development. TGFβ downstream signals, composed of activated SMAD2/3, SMAD4 and a FOXO family member, promote the expression of cyclin-dependent kinase inhibitor Cdkn1a. In early CNS development, IGF1/PI3K signaling and the transcription factor FOXG1 inhibit FOXO- and TGFβ-mediated Cdkn1a transcription. FOXG1 prevents cell cycle exit by binding to the SMAD/FOXO-protein complex. In this study we provide further details on the FOXG1/FOXO/SMAD transcription factor network. We identified ligands of the TGFβ- and IGF-family, Foxo1, Foxo3 and Kcnh3 as novel FOXG1-target genes during telencephalic development and showed that FOXG1 interferes with Foxo1 and Tgfβ transcription. Our data specify that FOXO1 activates Cdkn1a transcription. This process is under control of the IGF1-pathway, as Cdkn1a transcription increases when IGF1-signaling is pharmacologically inhibited. However, overexpression of CDKN1A and knockdown of Foxo1 and Foxo3 is not sufficient for neuronal differentiation, which is probably instructed by TGFβ-signaling. In mature neurons, FOXG1 activates transcription of the seizure-related Kcnh3, which might be a FOXG1-target gene involved in the FOXG1 syndrome pathology.

Keywords: Gerotarget; TGFβ; atypical Rett syndrome; cerebral cortex; neurogenesis; transcriptional control.


Conflict of interest statement

The authors declare that there is no conflict of interest.

Figures

Figure 1
Figure 1. FOXG1 prevents TGFβ-mediated neuronal differentiation at early developmental stages
A. qRTPCR analysis of Foxg1 expression from E11.5 until adulthood revealed that Foxg1 transcript levels increased significantly after E11.5 and remained stationary until they dropped at the adult stage. Values were expressed as fold change relative to E11.5 (indicated as 1). ****p < 0.0001; **p < 0.01; One-way ANOVA - Šidák's post-test comparing consecutive developmental stages; n = 3. B., C. Immunoblot evaluation of FOXG1 expression in murine telencephalon at different developmental time points (B) and relative densitometric analysis (C) showed a mild but not significant increase in FOXG1 levels between E11.5 (dashed line) and E13.5. The peak of expression occurred between E13.5 and E17.5 and was decreased after E17.5 in lateral cortex (LC) and in hippocampus (hippo). Brain extracts from Foxg1−/− animals were used as a negative control to correctly identify FOXG1 band (arrow). Statistical analysis: One-way ANOVA - Šidák's post-test comparing consecutive developmental stages; n = 3. D. Immunohistochemical staining showing temporo-spatial dynamics in expression of FOXG1 in murine forebrain at different developmental stages. Scale bar: 200 μm; n = 3. E., F. In vitro assessment of FOXG1 protein levels on cortical cells obtained at E11.5, E13.5 and E16.5, and cultured until either DIV0, DIV4 or DIV8 (E), and their relative densitometric analysis (F). FOXG1 levels significantly increased between E11.5 and E16.5 in DIV0 cortical cells. CPCs from E11.5 and E13.5 show increased or unchanged FOXG1 expression, respectively, after 4 or 8 days in culture. FOXG1 in E16.5 cells drops at DIV8. *p < 0.05; One-Way ANOVA with Tukey's post-test comparing all pairs of columns within the same DIV group; n = 3. G. Evaluation of TGFβ-induced neuronal differentiation at E11.5, E13.5 and E16.5 through HuC/D immunocytochemistry. TGFβ treatment led to an increase in the percentage of HuC/D+ cells as compared to untreated control only at E16.5, while no significant effects were visible at E11.5 and E13.5. *p < 0.05; Student's t-test; n = 4. H. Evaluation of neuronal differentiation in E13.5 wild-type, Foxg1+/− and Foxg1−/− CPCs upon TGFβ treatment. HuC/D immunocytochemistry showed that partial or total loss of Foxg1 renders cells responsive to TGFβ-induced differentiation. ***p < 0.001, **p < 0.01; Student's t-test. Immunoblot results (B-E) were normalized to respective GAPDH and shown as a ratio to the E11.5 stage (set as 1). All data are shown as mean±SEM. IDV: integrated density value.
Figure 2
Figure 2. FOXG1 inhibits expression of Tgfβ- and Igf-ligands, Foxo1, Foxo3 and Cdkn1a
A. Transcriptome profiling of TGFβ-treated Foxg1−/− (n = 3) and wild-type (n = 2) CPCs identified 586 differentially regulated genes. B. Bar chart showing the main biological processes in which microarray-identified genes are involved. This analysis was performed using DAVID. C.-E. Candidate genes identified through microarray analysis were validated by qRTPCR. Transcriptional expression of Tgfb1 and Tgfb2 (C), transcription factors Foxo1 and Foxo3 (D) as well as Igf1 and Igf2 (E) was significantly increased in E13.5 Foxg1−/− forebrains as compared to wild-type controls. F. Expression of cyclin-dependent kinase inhibitor Cdkn1a was tested in different mutant mouse lines. Cdkn1a expression was decreased in Foxg1-deficient (Foxg1−/−) mice as well as in animals where both Foxg1 and Tgfbr2 were knocked out (Foxg1;Tgfbr2 dKO). Cdkn1a expression was unaffected in mice where Tgfbr2 was conditionally knocked out in Foxg1-expressing cells (Tgfbr2 cKO) and in double knockouts for Tgfb2 and Tgfb3 (Tgfb2;Tgfb3 dKO). Results are expressed as Log2(fold change) as compared to control wild-type animals (set as 0). **p < 0.01, *p < 0.05; Student's t-test; n = 3.
Figure 3
Figure 3. Knockdowns of Foxg1, Foxo1 and Smad4 affect expression of each other and of Cdkn1a
A., B. E13.5 murine CPCs were infected with shRNA constructs targeting specific genes or scrambled shRNA construct (control). Expression levels of Foxg1 and Cdkn1a were assessed by qRTPCR. A. Foxg1 transcript levels were significantly decreased when shRNA constructs targeted Foxg1, Foxo1, Smad4 or their combinations. B. Cdkn1a expression was significantly decreased upon knockdown of Foxo1 or Smad4, but not upon Foxo3 or Foxg1 knockdown. Results are shown as mean of Log2(fold change)±SEM in specific shRNA construct condition vs. scrambled control (set as 0). ****p < 0.0001, ***p < 0.001, **p < 0.01, *p < 0.05; One-sample t-test; replicate numbers indicated in graphics.
Figure 4
Figure 4. IGF1-pathway affects Cdkn1a expression through FOXO1
A. Cdkn1a expression in E11.5 CPCswas significantly increased after blocking intracellular IGF1-signaling with PPP. Treatment with IGF1 did not affect Cdkn1a expression. B., C. Cdkn1a expression was assessed in E11.5 (B) and E13.5 (C) CPCs after knocking down the expression of Foxg1, Foxo1, Foxo3, Smad4 or Foxo1+Foxo3 while blocking IGF1-signaling by PPP treatment. (B) Expression of Cdkn1a increased in E11.5 CPCs upon treatment with PPP except when Foxo1 expression was knocked down. (C) Cdkn1a expression in E13.5 CPCs was not significantly raised upon PPP treatment when either Foxo1 or Smad4 expression was knocked down. Results are shown as mean of Log2(fold change)±SEM of each PPP-treated condition vs. relative DMSO-treated control (set as 0). ***p < 0.001, **p < 0.01, *p < 0.05; One-sample t-test (vs. DMSO-treated control). #p < 0.05; One-way ANOVA - Dunnet's post-test (vs. Scrambled control). Replicate number in A: n = 4.
Figure 5
Figure 5. Evaluation of FOXG1/TGFβ-pathway crosstalk in specification of Cajal-Retzius (CR) cells
A. qRTPCR-based analysis of the expression of CR cell markers in E13.5 Foxg1−/−, Tgfbr2 cKO and Foxg1;Tgfbr2 dKO mice. Transcriptional expression of Reln, Trp73 and Calb2 was significantly increased in all models lacking Foxg1 expression. Reln expression was not affected by loss of Tgfbr2. Trp73 and Calb2 transcripts were mildly increased in Tgfbr2 cKOs. B. Immunohistochemical analysis of brain sections from E13.5 Foxg1−/−, Tgfbr2 cKO, Foxg1;Tgfbr2 dKO as well as corresponding controls, showed that CALB2 expression is increased upon loss of Foxg1 expression. Consistent with the qRTPCR results, the amount of CALB2-positive cells was not decreased in Tgfbr2 cKO mice. qRTPCR results are shown as mean of Log2(fold change)±SEM of each condition vs. relative control (set as 0). ****p < 0.0001, ***p < 0.001, **p < 0.01, *p < 0.05; Student's t-test; n≥3. Scale bar: 250 μm.
Figure 6
Figure 6. Neuronal differentiation at E13.5 is unaffected by Cdkn1a overexpression or loss of Foxo1 and Foxo3
A., C. Immunocytochemical analysis of HuC/D expression (A) showed that overexpression of Cdkn1a is not sufficient to induce neuronal differentiation in E13.5 CPCs. The percentage of HuC/D+ cells after Cdkn1a overexpression with or without TGFB1 stimulation (6 days) did not change significantly compared to E13.5 CPCs infected with empty vector (C). B., D. Immunocytochemical staining for HuC/D performed on E13.5 CPCs infected with shRNA constructs targeting Foxo1 or Foxo3, either treated with TGFB1 for 6 DIV or left untreated. Knockdown of Foxo1 led to a mild but significant increase in untreated HuC/D+ cells, while knockdown of Foxo3 expression decreased the amount of TGFβ-treated HuC/D+ cells. *p < 0.05; One-way ANOVA - Šidák's post-test for comparison of specific pairs; n = 3. Scale bar: 100 μm.
Figure 7
Figure 7. Identification of novel candidate genes regulated through FOXG1/SMAD crosstalk
A. Whole mouse genome was screened for genes possessing both Forkhead box- (GTAAACAA) and SMAD4-specific (AGAC) consensus DNA-binding sites in a range of 15 Kb before the TSS and placed not farther than 200 bp from each other. Selected candidate genes fulfilled these criteria and were regulated in our microarray analysis. B. Transcriptional expression of candidate genes was assessed by qRTPCR using E13.5 telencephalic hemispheres from Foxg1−/−, Tgfbr2 cKO and Tgfb2;Tgfb3 dKO mice. Results are expressed as Log2(fold change)±SEM of target gene expression in mutants as compared to respective controls (Ctrl, set as 0). Kcnh3 was found to be regulated in both Foxg1−/− and Tgfb2;Tgfb3 dKO mice and was thus selected for further analyses. ***p < 0.001, **p < 0.01, *p < 0.05; Student's t-test; n = 3. C. Kcnh3 expression in wild-type E13.5 CPCs infected with shRNA constructs targeting Foxg1, Foxo genes and Smad4 decreased when either Foxg1 or Foxo3 were knocked down. Results are shown as mean of Log2(fold change)±SEM in specific shRNA construct condition vs. scrambled control (set as 0). ****p < 0.0001, ***p < 0.001, **p < 0.01, *p < 0.05; One-sample t-test; replicate numbers indicated on graphics. D. Potential binding of FOXG1 at specific sites upstream of Kcnh3 as well as at the 3′-UTR was investigated using ChIP. FOXG1 was enriched in 3′-UTR region (252-287 bp downstream from the termination codon; reference NM_010601.3). Significant FOXG1 binding also occurs on the Cdkn1a locus (2287-2252 bp upstream of TSS; reference NM_007669.4) at the FOX-binding site described by Seoane et al. [7]. Results are shown as a ratio between FOXG1 enrichment at a specific site and its enrichment in a region devoid of FOX binding sites, which was used as a negative control (set as 1 and shown by a dashed line). *p < 0.05; One sample t-test; n = 5.
Figure 8
Figure 8. Characterization of spatial and temporal expression of Kcnh3 in the developing murine forebrain
A. Kcnh3-expressing regions were identified by in situ hybridization on sections from E11.5 (Aa-b), E13.5 (Ac-d) and E16.5 (Ae-f) murine forebrains. While no specific staining could be detected at E11.5 (Aa-b), at E13.5 weak to mild expression was detectable in the regions corresponding to the rostral lateral pallium (Ac) to the developing lateral entorhinal cortex (Ad). At E16.5, Kcnh3 expression took place in the same regions as at E13.5 (Ae-f), as well as in the developing hippocampus (Af). B. qRTPCR analysis showed transcriptional levels of Kcnh3 in the forebrain at different developmental stages (E11.5, E13.5, E14.5, E15.5, E16.5, E17.5 and adult). Kcnh3 expression increased between E11.5 and E13.5, remained stationary until E17.5, and increased at the adult stage. Values are expressed as relative fold change in comparison to E11.5 (indicated as 1). ****p < 0.0001; One-way ANOVA – Šidák's post-test comparing consecutive developmental stages; n = 3. C. Kcnh3 expression in forebrains of Foxg1−/− (Cb) as compared to wild-type (Ca) animals. Kcnh3 was undetectable in Foxg1−/−. Experimental replicates: n = 3 for all in situ hybridization experiments, except for Foxg1−/− (n = 2). Scale bar: 200 μm.
Figure 9
Figure 9. Developmental dynamics of the FOXG1/FOXO/SMAD4 network in the context of cortical progenitor proliferation and differentiation
A. At E11.5 proliferation is dominant and expression of Cdkn1a through FOXO1 protein is prevented by IGF1-mediated activation of the AKT-signaling pathway that keeps FOXO1 in the cytoplasm due to phosphorylation. B. As development progresses, progenitors are exposed to increasing amounts of differentiating signals. To prevent exit from mitosis FOXG1 associates with FOXO1 and SMAD4 complexes at the Cdkn1a promoter and thereby FOXG1 prevents cell cycle exit. At the same time, FOXG1 represses the expression of Foxo1, Foxo3 and Tgfβ. C. In differentiating progenitors, transient downregulation of FOXG1 allows differentiating signals such as TGFβ to drive neuronal differentiation, which follows FOXO1/SMAD4 mediated transcription of Cdkn1a. To allow differentiated cells to integrate into the cortical plate, FOXO1/SMAD4 proteins drive Foxg1 expression. D. FOXG1 binds to the 3′-UTR of Kcnh3 and activates expression of Kcnh3 in mature neurons. FOXO3 also drives Kcnh3 expression.

Similar articles

Cited by

References

    1. Vogel T, Ahrens S, Büttner N, Krieglstein K. Transforming growth factor beta promotes neuronal cell fate of mouse cortical and hippocampal progenitors in vitro and in vivo: identification of Nedd9 as an essential signaling component. Cereb Cortex. 2010;20:661–71. doi: 10.1093/cercor/bhp134. - DOI - PMC - PubMed
    1. Wahane SD, Hellbach N, Prentzell MT, Weise SC, Vezzali R, Kreutz C, Timmer J, Krieglstein K, Thedieck K, Vogel T. PI3K-p110-alpha-subtype signalling mediates survival, proliferation and neurogenesis of cortical progenitor cells via activation of mTORC2. J Neurochem. 2014;130:255–67. doi: 10.1111/jnc.12718. - DOI - PubMed
    1. Derynck R, Zhang YE. Smad-dependent and Smad-independent pathways in TGF-beta family signalling. Nature. 2003;425:577–84. doi: 10.1038/nature02006. - DOI - PubMed
    1. Dünker N, Krieglstein K. Targeted mutations of transforming growth factor-beta genes reveal important roles in mouse development and adult homeostasis. Eur J Biochem. 2000;267:6982–8. - PubMed
    1. Massagué J. TGFbeta in Cancer. Cell. 2008;134:215–30. doi: 10.1016/j.cell.2008.07.001. - DOI - PMC - PubMed