. 2016 Jun 14;7(24):35535-35551.
doi: 10.18632/oncotarget.9550.

Deficiency of myeloid-related proteins 8 and 14 (Mrp8/Mrp14) does not block inflammaging but prevents steatosis

Affiliations

Deficiency of myeloid-related proteins 8 and 14 (Mrp8/Mrp14) does not block inflammaging but prevents steatosis

William R Swindell et al. Oncotarget. .

Abstract

The Mrp8 and Mrp14 proteins (calprotectin) accumulate within tissues during aging and may contribute to chronic inflammation. To address this possibility, we evaluated female calprotectin-deficient Mrp14-KO and wild-type (WT) mice at 5 and 24 months of age. However, there was no evidence that age-related inflammation is blunted in KO mice. Inflammation markers were in fact elevated in livers from old KO mice, and microarray analysis revealed more consistent elevation of genes specifically expressed by B-cells and T-cells. Adipose-specific genes, however, were less consistently elevated in aged KO mice, suggesting an anti-steatosis effect of Mrp8/14 deficiency. Consistent with this, genes decreased by the anti-steatosis agent SRT1720 were decreased in old KO compared to old WT mice. Expression of lipid metabolism genes was altered in KO mice at 5 months of age, along with genes associated with development, biosynthesis and immunity. These early-age effects of Mrp8/14 deficiency, in the absence of any external stressor, were unexpected. Taken together, our findings demonstrate a pro-steatosis rather than pro-inflammatory role of calprotectin within the aging liver. This appears to reflect a developmental-metabolic phenotype of Mrp14-KO mice that is manifest at a young age in the absence of pro-inflammatory stimuli.

Keywords: B-cell; Gerotarget; S100a8; calgranulin; calprotectin; microarray.


Conflict of interest statement

The authors declare no conflict of interest.

Figures

Figure 1
Figure 1. Expression of Mrp8, Mrp14 and genes associated with age-related inflammation (Itgb2, Cd68 and Lyz1)
RT-PCR was used to measure expression of Mrp8, Mrp14, Itbg2, Cd68 and Lyz1 in A. liver, B. lung, C. ear skin, and D. tail skin (WT and KO mice; young: 5 months; old: 24 months). Average relative expression is shown for each treatment (± 1 standard error; 5 ≤ n ≤ 9 per treatment), and expression of each gene is normalized to the average expression of the young-WT group. Expression of 18S ribosomal RNA (Rn18s) was used an endogenous control gene. Treatments that do not share the same letter differ significantly from one another (P < 0.05; Fisher's LSD).
Figure 2
Figure 2. Genes with elevated expression in young KO mice compared to young WT mice and their associated gene ontology (GO) biological process (BP) terms
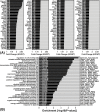
A. The 136 DEGs with significantly elevated expression in young KO mice compared to young WT mice (FDR < 0.10 with KO/WT FC ≥ 1.50). B. GO BP terms most significantly enriched among the 136 DEGs. The number of DEGs associated with each GO BP term is listed in parentheses (left margin). DEGs most strongly elevated in KO mice are listed for each GO BP term (right margin).
Figure 3
Figure 3. Genes with decreased expression in young KO mice compared to young WT mice and their associated gene ontology (GO) biological process (BP) terms
A. The 79 DEGs with significantly decreased expression in young KO mice compared to young WT mice (FDR < 0.10 with KO/WT FC ≤ 0.67). B. GO BP terms most significantly enriched among the 79 DEGs. The number of DEGs associated with each GO BP term is listed in parentheses (left margin). DEGs most strongly decreased in KO mice are listed for each GO BP term (right margin).
Figure 4
Figure 4. Aging increases hepatic expression of genes specifically expressed by monocytes, macrophages, B-cells and T-cells
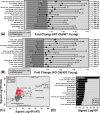
Immunological Genome Project (IGP) cell populations with signature genes biased toward age-increased expression in A. WT mice and B. KO mice. Black dots represent the average old/young FC of signature genes, with bars spanning the middle 50% of FC estimates among signature genes (i.e., 25th to 75th percentiles). Dark grey boxes outline the middle 50% of FC estimates among non-signature genes. P-values for each cell population were obtained by comparing FC estimates between signature and non-signature genes (right margin; Wilcoxon rank sum test). Part C. compares p-values obtained from all 222 cell populations for KO and WT mice. P-values were log10-transformed (Log10P) and signed to indicate whether signature genes are biased towards age-decreased expression (Lop10P < 0) or age-increased expression (Log10P > 0). Part D. lists cell populations for which Log10P is higher in KO versus WT mice.
Figure 5
Figure 5. Genes specifically expressed by B-cells have elevated expression in old KO mice compared to old WT mice
A. Immunological genome project (IGP) cell populations with signature genes biased toward elevated expression in old KO mice compared to old WT mice. Black dots represent the average signature gene FC between old KO and old WT mice, with bars spanning the middle 50% of FC estimates among signature genes (i.e., 25th to 75th percentiles). Dark grey boxes outline the middle 50% of FC estimates among non-signature genes. P-values for each cell population were obtained by comparing FC estimates between signature and non-signature genes (right margin; Wilcoxon rank sum test). B. FC estimates (old KO/old WT) for the 100 signature genes associated with the top-ranked B-cell population from part A. (B1a.Sp). The dotted vertical line indicates the number of KO-decreased genes. The dark grey region is the middle 95% of the null distribution for this value (Fisher's Exact Test). C. Comparison of FC estimates (old/young) between KO and WT mice for the 100 signature genes associated with B1a.Sp. D. Genes most highly expressed by B1a.Sp relative to the other 221 IGP cell populations. The chart shows the FC and p-value obtained from the comparison between B1a.Sp and the 221 other IGP cell populations. E. FC estimates (old KO/old WT) for genes shown in D. and their associated p-values (right margin).
Figure 6
Figure 6. Elevated expression of white adipose tissue (WAT) signature genes with aging is blunted in KO compared to WT mice
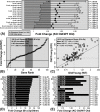
Enrichment of WAT signature genes among genes with age-increased expression in A. WT and B. KO mice. Parts A. and B. show cumulative overlap of the 100 WAT signature genes relative to a list of genes ranked according to how strongly their expression is increased by aging (age-increased: left of vertical line; age-decreased: right of vertical line). Significant overlap of WAT signature genes and age-increased genes is indicated by a positive area between the cumulative overlap curve and diagonal. Similarly, C. and D. show cumulative overlap between WAT signature genes and genes ranked according to how strongly their expression is elevated in KO compared to WT mice (C: young mice; D: old mice; KO-increased: left of vertical line; KO-decreased: right of vertical line). Parts E. and F. list WAT signature genes and their FC estimates (old/young) in E. WT and F. KO mice. The 15 WAT signature genes with highest FC (WAT/liver) are listed.
Figure 7
Figure 7. Hepatocellular vacuolation and oil red O staining is attenuated in livers from old KO compared to old WT mice
A., B., E., F. Hematoxylin and eosin H.&E. stain in young and old WT/KO mice. C., D., G., H. Oil red O staining for lipid droplets in young and old WT/KO mice.

Similar articles

Cited by

References

    1. Franceschi C, Campisi J. Chronic inflammation (inflammaging) and its potential contribution to age-associated diseases. The journals of gerontology Series A, Biological sciences and medical sciences. 2014;69(Suppl 1):S4–9. - PubMed
    1. Vogl T, Eisenblatter M, Voller T, Zenker S, Hermann S, van Lent P, Faust A, Geyer C, Petersen B, Roebrock K, Schafers M, Bremer C, Roth J. Alarmin S100A8/S100A9 as a biomarker for molecular imaging of local inflammatory activity. Nature communications. 2014;5:4593. - PMC - PubMed
    1. Swindell WR, Johnston A, Xing X, Little A, Robichaud P, Voorhees JJ, Fisher G, Gudjonsson JE. Robust shifts in S100a9 expression with aging: a novel mechanism for chronic inflammation. Scientific reports. 2013;3:1215. - PMC - PubMed
    1. Gomes LH, Raftery MJ, Yan WX, Goyette JD, Thomas PS, Geczy CL. S100A8 and S100A9-oxidant scavengers in inflammation. Free radical biology & medicine. 2013;58:170–186. - PubMed
    1. Luo Y, Li Y, Lin C, Ma H, Zhang J, Wu S, Wang X, Gao Y, Liu Y, Zheng D. Comparative proteome analysis of splenic lymphocytes in senescence-accelerated mice. Gerontology. 2009;55:559–569. - PubMed

MeSH terms