. 2016 Nov;7(11):804-819.
doi: 10.1007/s13238-016-0268-3. Epub 2016 May 25.

A new method for quantifying mitochondrial axonal transport

Affiliations

A new method for quantifying mitochondrial axonal transport

Mengmeng Chen et al. Protein Cell. 2016 Nov.

Abstract

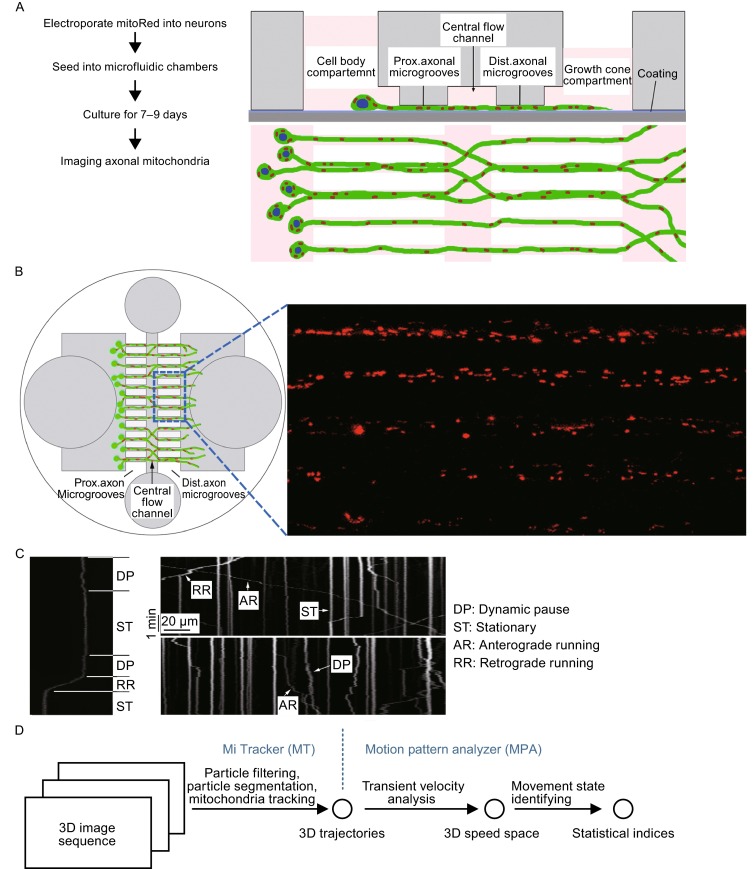
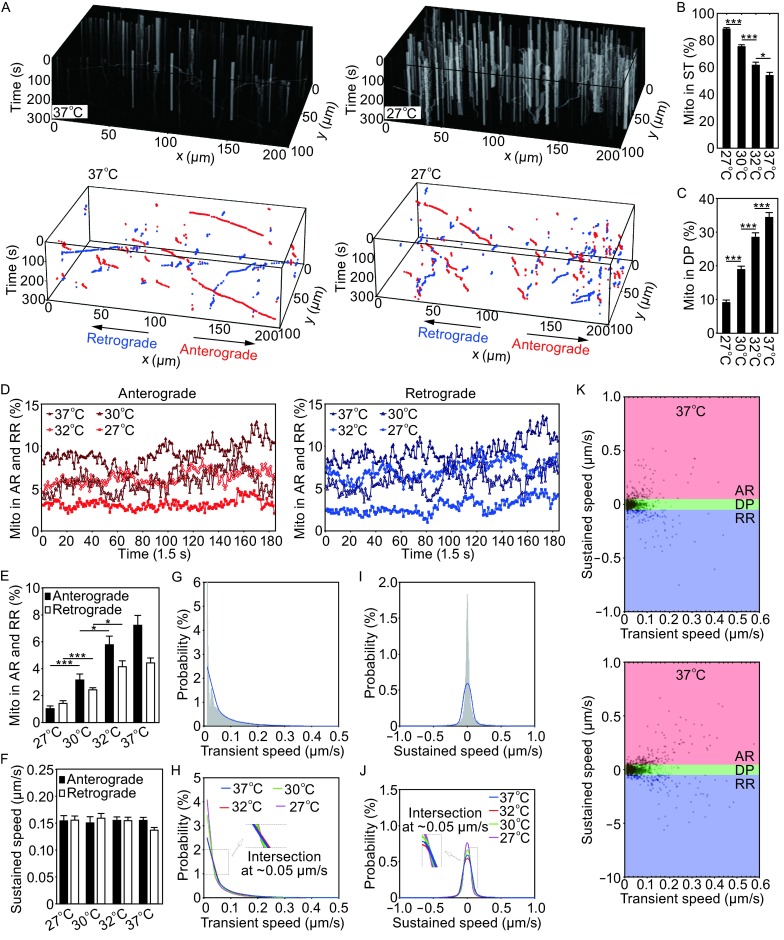
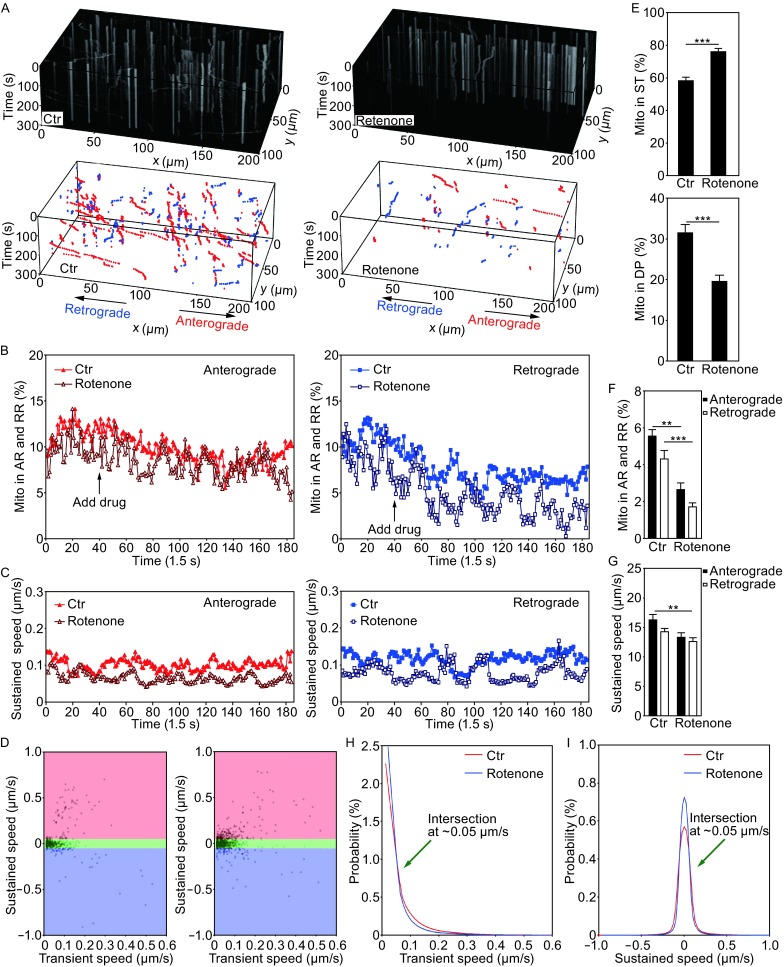
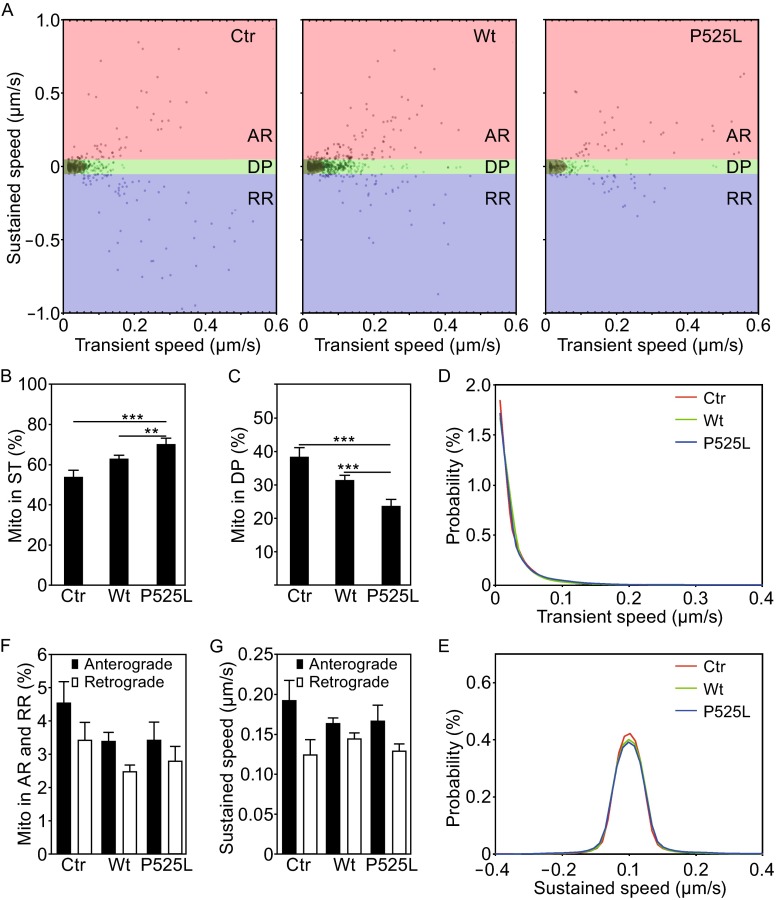
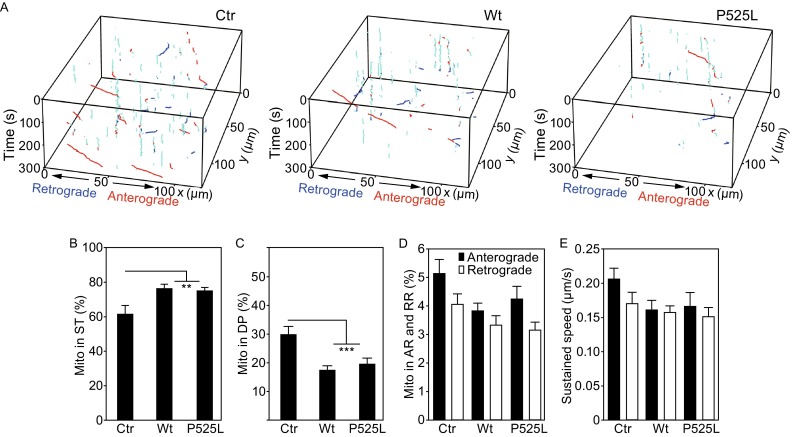
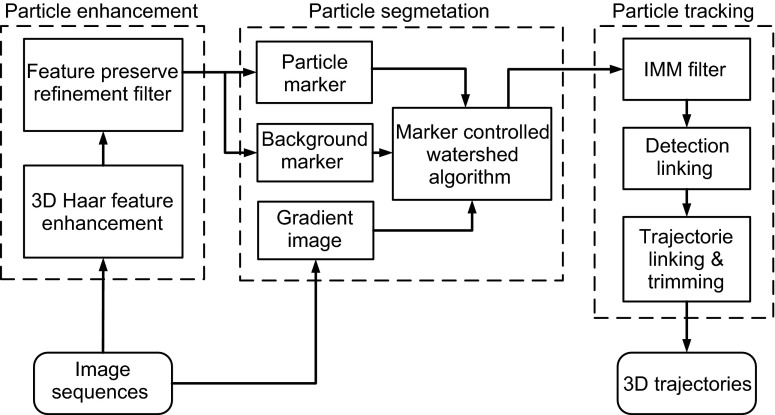
Axonal transport of mitochondria is critical for neuronal survival and function. Automatically quantifying and analyzing mitochondrial movement in a large quantity remain challenging. Here, we report an efficient method for imaging and quantifying axonal mitochondrial transport using microfluidic-chamber-cultured neurons together with a newly developed analysis package named "MitoQuant". This tool-kit consists of an automated program for tracking mitochondrial movement inside live neuronal axons and a transient-velocity analysis program for analyzing dynamic movement patterns of mitochondria. Using this method, we examined axonal mitochondrial movement both in cultured mammalian neurons and in motor neuron axons of Drosophila in vivo. In 3 different paradigms (temperature changes, drug treatment and genetic manipulation) that affect mitochondria, we have shown that this new method is highly efficient and sensitive for detecting changes in mitochondrial movement. The method significantly enhanced our ability to quantitatively analyze axonal mitochondrial movement and allowed us to detect dynamic changes in axonal mitochondrial transport that were not detected by traditional kymographic analyses.

Keywords: FUS proteinopathy and mitochondrial transport defect; image processing and analysis; mitochondrial transport.


Figures

Figure 1
Figure 1
MitoQuant: a toolkit for analyzing axonal mitochondrial transport. (A and B) A microfluidic chamber was used to culture cortical neurons, making it possible to image axonal mitochondrial transport in a high throughput manner. (A) A flow chart of neuronal culture in microfluidic chambers, together with the side view (top panel) and top view (bottom panel) of chambers containing neurons expressing mitoRed to mark mitochondria for fluorescent confocal microscopic imaging. (B) A diagram to illustrate the microfluidic neuronal culture (left) and a fluorescent confocal microscopic image of axonal mitochondria (right), showing that >100 mitochondria distributed in 5 axonal bundles inside axonal microgrooves can be captured in one series of confocal imaging. An example of bright field image of axonal bundles is shown in Fig. S7. (C) 2-D Kymographs of axonal mitochondria in 5 min to demonstrate different movement states of mitochondria. Scale bars: 1 min and 20 μm. Representative illustration of different mitochondrial movement states: stationary (ST), dynamic pause (DP), anterograde running (AR) and retrograde running (RR), as marked in the kymographs. (D) The analysis toolkit consists of two image-analysis programs: MiTracker (MT) for tracking mitochondria by locating mitochondria and linking their coordinates into 3-D trajectories and motion pattern analyzer (MPA) for identifying the mitochondrial movement states in a 2-D speed space (transient and sustained speed)
Figure 2
Figure 2
Temperature changes significantly affect axonal mitochondrial movement. (A) 3-D kymographs (top panels) and trajectories generated by MT (bottom panels). A 3-D kymograph was generated by projecting each frame [a 3-D (xyz) image] to a 2-D (xy) image using the maximum method with the xy-t data visualized in the 3-D kymograph. To increase the clarity of the diagram, data collected at two temperatures (37°C and 27°C) are included. In addition, only trajectories of mitochondria in AR or RR states are shown in red and blue colors respectively, without those in the DP state. See Figure S1 for complete set of data for 32°C and 30°C, which includes the DP state. (B) The percentage of mitochondria in stationary state increased as temperature went down from 37°C to 27°C. (C) The proportion of mitochondria in dynamic pause state decreased as temperature was reduced. (D) The proportion of mitochondria in different running states over time. Mitochondrial movement is illustrated by red (anterograde) and blue traces (retrograde). (E and F) Respectively, the proportion of mitochondria running in either directions (AR or RR) and the sustained speed, which can be considered equivalent to the short-term average speed. (G) Histogram of the probability distribution of transient component of speed and its corresponding regression (blue line). (H) Comparison of transient speed distribution among different temperature groups, Curves were averages of twelve image sequences. All curves intersected at ~0.05 μm/s. (I) Histogram of the probability distribution of sustained component of speed and its corresponding regression (blue line). (J) Comparison of sustained speed distribution among different temperature groups. (K) A 2-D parameter space created by calculating sustained speed and its transient speed variance. The ST state was marked in small brown color area near the origin of coordinates zero. At least 60 axonal bundles (12 image series, 5 axonal bundles per image series) from at least 4 independent microfluidic chambers were imaged for each group. At least 1000 mitochondria were identified and quantified for each group. Data represent at least 3 independent experiments [one-way ANOVA, (*P < 0.05; **P < 0.01; ***P < 0.001)]
Figure 3
Figure 3
Validation of MitoQuant in quantitative analyses of axonal mitochondrial movement in rotenone treated neurons. (A) 3-D kymographs and trajectories were generated using MiTracker (MT). Neurons were treated with the control (Ctr) or Rotenone. (B) After 1 min of imaging, rotenone was added to the culture medium to the final concentration of 1 μmol/L; and real time fluorescent confocal microscopy was continued for additional 4 min. The proportion of mitochondria in running states (AR or RR) was significantly reduced following rotenone treatment. (C) Rotenone treatment did not significantly alter the sustained speed of axonal mitochondria over time. (D) A 2-D parameter space created by calculating sustained speed and corresponding transient speed. The ST state was marked in small brown color area near the origin of coordinates zero. (E) The proportion of axonal mitochondria in the ST state was significantly increased following rotenone treatment. The proportion of mitochondria in the DP state was decreased from ~28% to ~19% following rotenone treatment. (F and G) The proportion of axonal mitochondria in running states (AR or RR) and their corresponding sustained speed, respectively. The variations of sustained speed among groups were small, as compared with variations of proportional indices. (H) Distribution of transient speed of axonal mitochondria. (I) Comparison of sustained speed distribution between rotenone treated and control groups of neurons. All curves in panels (H) and (I) were average of twelve image sequences. At least 60 axonal bundles from at least 4 chambers were imaged for each group. At least 1100 mitochondria were identified and quantified for each group. Data represent at least 3 independent experiments [one-way ANOVA, (*P < 0.05; **P < 0.01; ***P < 0.001)]
Figure 4
Figure 4
Expression of FUS protein decreases axonal mitochondrial transport in cultured mammalian neurons. (A) A 2-D parameter space was created by calculating sustained and transient component of speed of mitochondrial movement in each group of neurons expressing the vector control (Ctr), wild-type FUS (Wt) or P252L-mutant FUS (P525L) proteins. (B and C) A significant increase in the percentage of mitochondria in stationary (ST) and a significant decrease in the percentage of mitochondria in dynamic pause (DP) in axons of neurons expressing either Wt-FUS or P525L-mutant FUS as compared with the control group. (D) The regression results of alternate component of transient speed. The distribution of transient speed in different group was similar. (E) The distribution comparison of sustained speed. (F) Percentage of mitochondria in running state (AR or RR) was determined among different groups of cultured neurons. (G) Sustained speed of running mitochondria was determined in different groups of cultured neurons. At least 100 axonal bundles from at least 4 chambers were analyzed for each group. Data represent at least 3 independent experiments [one-way ANOVA, (*P < 0.05; **P < 0.01; ***P < 0.001)]
Figure 5
Figure 5
Expression of FUS protein significantly affects axonal mitochondrial transport in motor neurons of transgenic flies expressing FUS. (A and B) A significant increase in the proportion of mitochondria in stationary (ST) state and a significant decrease in the percentage of mitochondria in dynamic pause (DP) state in neurons expressing either Wt- or P525L-mutant FUS, as compared with neurons in the control group. (C) The percentage of axonal mitochondria in running states (AR or RR) among different groups. (D) The sustained speed of running mitochondria was determined in different groups of flies. At least 20 axonal bundles (containing 100–200 axons) were analyzed for each group. Data represent at least 3 independent experiments [one-way ANOVA, (*P < 0.05; **P < 0.01; ***P < 0.001)]
Figure 6
Figure 6
A flow chart to illustrate detailed processes of the MiTracker algorithm. There are three major components: the particle enhancement, the particle segmentation and the particle tracking. The algorithm details are described in the MATERIALS AND METHODS section about tracking mitochondria in 3-D image sequence

Similar articles

Cited by

References

    1. Ashrafi G, Schlehe JS, LaVoie MJ, Schwarz TL. Mitophagy of damaged mitochondria occurs locally in distal neuronal axons and requires PINK1 and Parkin. J Cell Biol. 2014;206:655–670. doi: 10.1083/jcb.201401070. - DOI - PMC - PubMed
    1. Borland MK, Trimmer PA, Rubinstein JD, Keeney PM, Mohanakumar K, Liu L, Bennett JP., Jr Chronic, low-dose rotenone reproduces Lewy neurites found in early stages of Parkinson’s disease, reduces mitochondrial movement and slowly kills differentiated SH-SY5Y neural cells. Mol Neurodegener. 2008;3:21. doi: 10.1186/1750-1326-3-21. - DOI - PMC - PubMed
    1. Bros H, Hauser A, Paul F, Niesner R, Infante-Duarte C. Assessing mitochondrial movement within neurons: manual versus automated tracking methods. Traffic. 2015;16(8):906–917. doi: 10.1111/tra.12291. - DOI - PubMed
    1. Buades A, Coll B, Morel JM. A non-local algorithm for image denoising. Comput Vis Pattern Recognit. 2005;2:60–65.
    1. Chan DC. Mitochondrial fusion and fission in mammals. Annu Rev Cell Dev Biol. 2006;22:79–99. doi: 10.1146/annurev.cellbio.22.010305.104638. - DOI - PubMed

MeSH terms

Substances

LinkOut - more resources