. 2016 Jul 8;119(2):249-60.
doi: 10.1161/CIRCRESAHA.115.308238. Epub 2016 May 25.

DUSP8 Regulates Cardiac Ventricular Remodeling by Altering ERK1/2 Signaling

Affiliations

DUSP8 Regulates Cardiac Ventricular Remodeling by Altering ERK1/2 Signaling

Ruijie Liu et al. Circ Res. .

Abstract

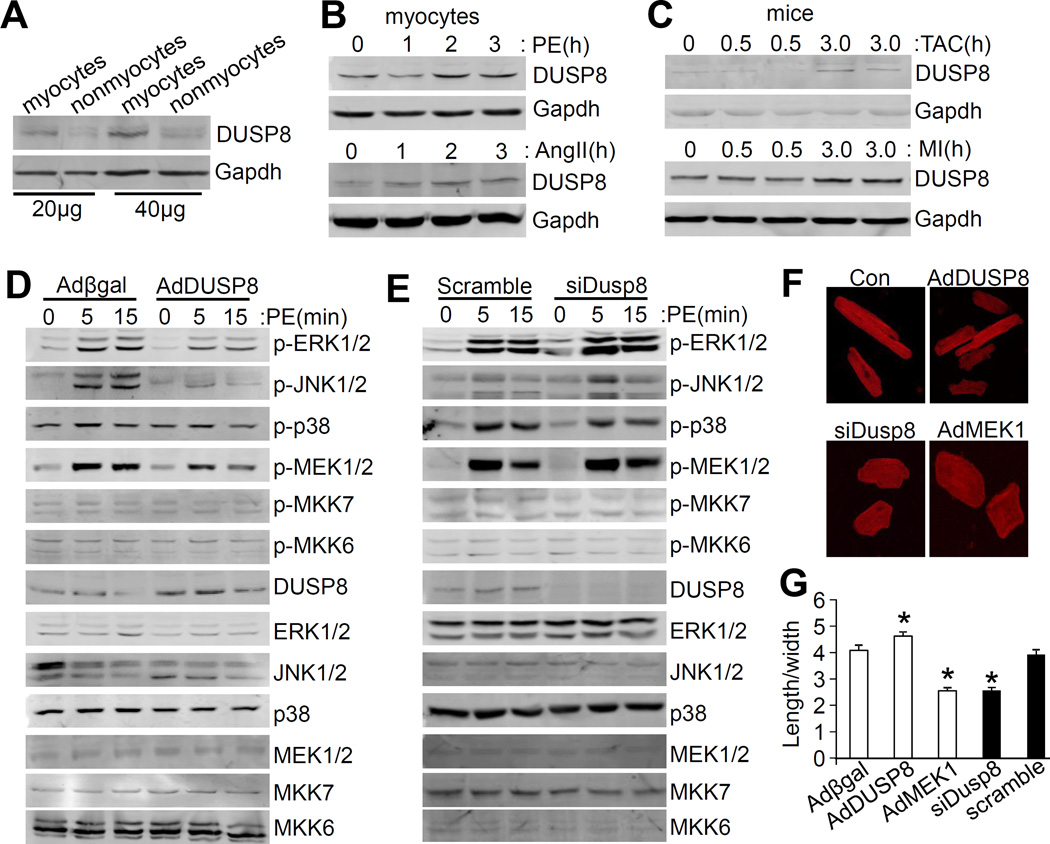
Rationale: Mitogen-activated protein kinase (MAPK) signaling regulates the growth response of the adult myocardium in response to increased cardiac workload or pathological insults. The dual-specificity phosphatases (DUSPs) are critical effectors, which dephosphorylate the MAPKs to control the basal tone, amplitude, and duration of MAPK signaling.

Objective: To examine DUSP8 as a regulator of MAPK signaling in the heart and its impact on ventricular and cardiac myocyte growth dynamics.

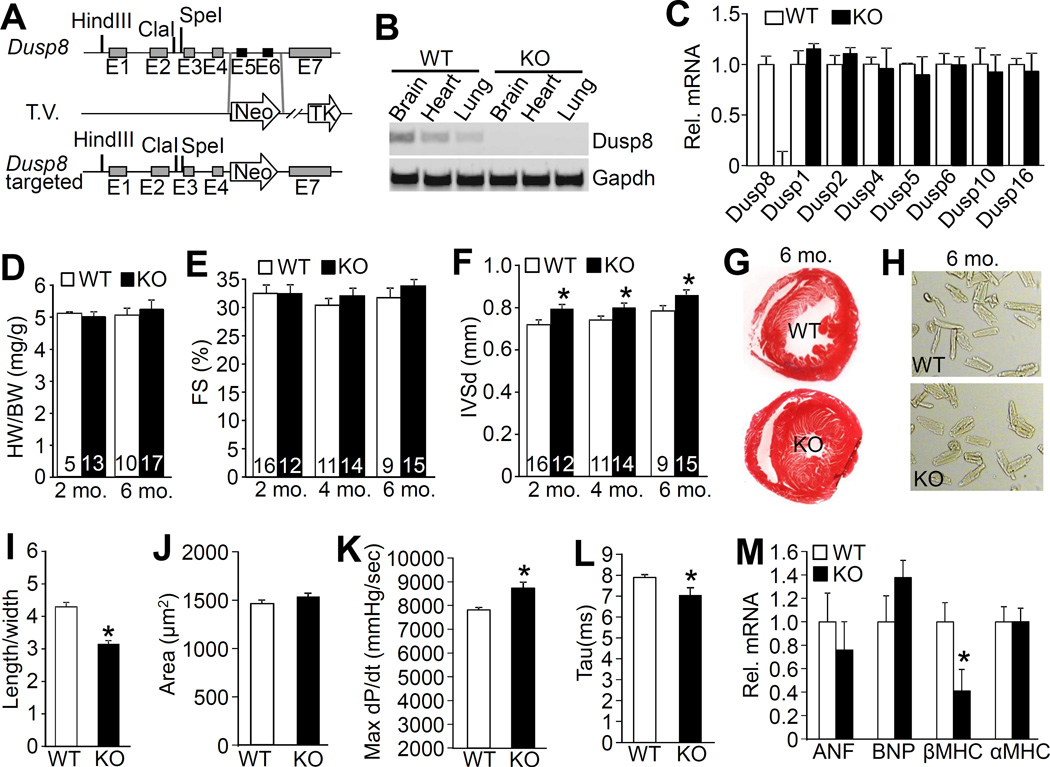
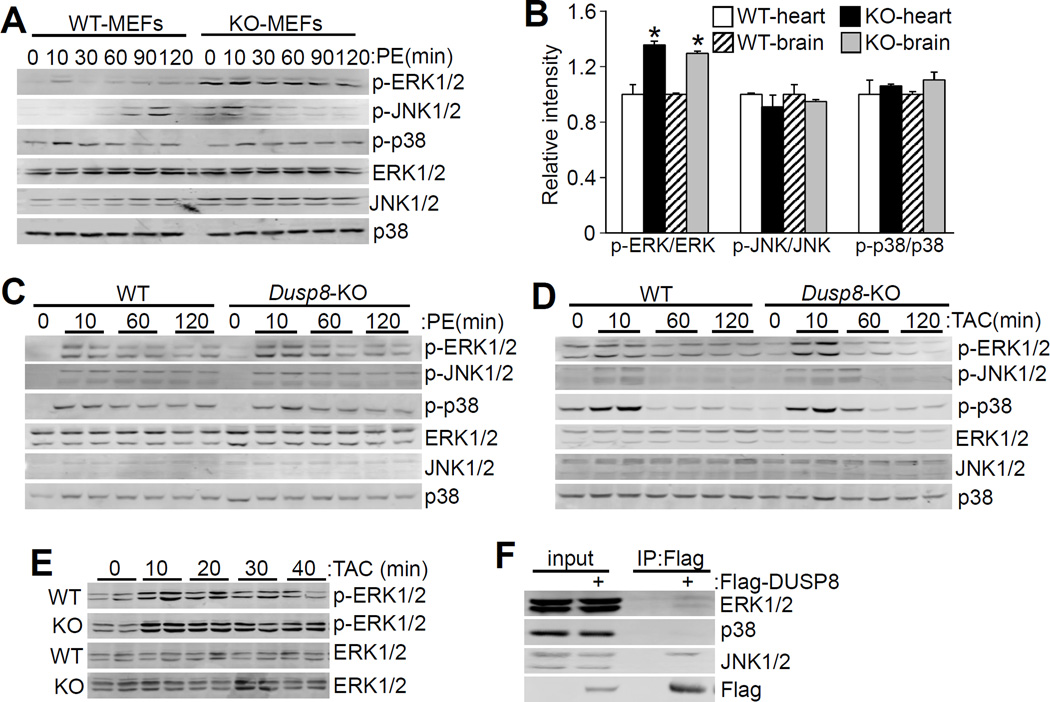
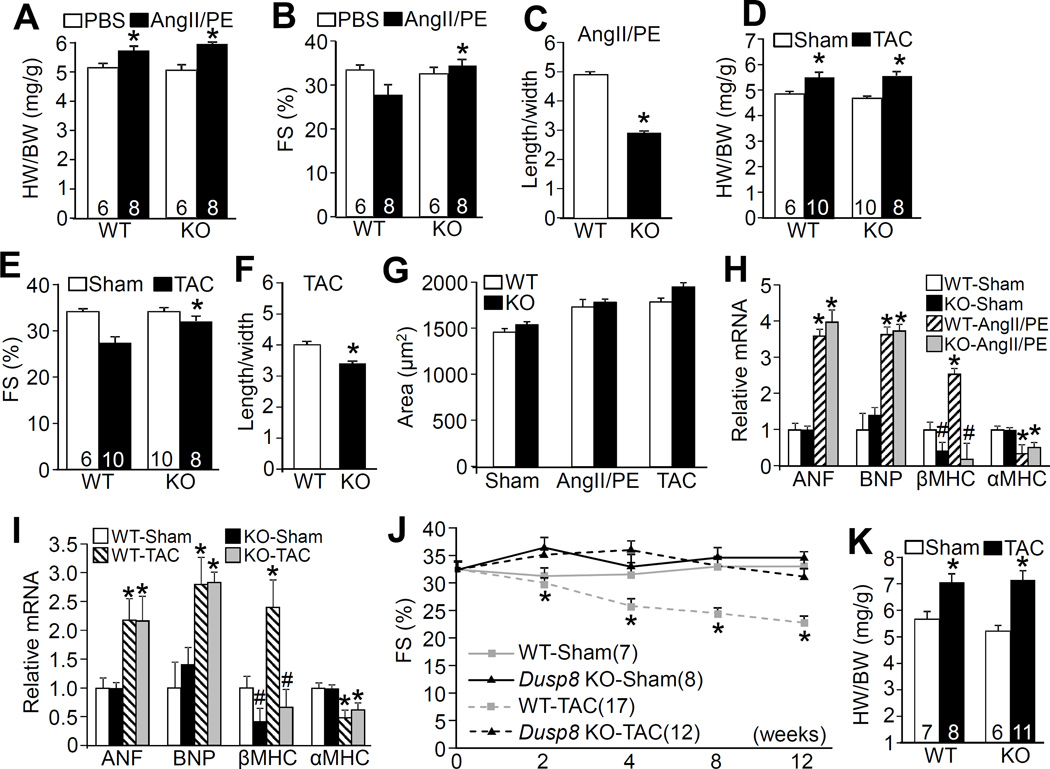
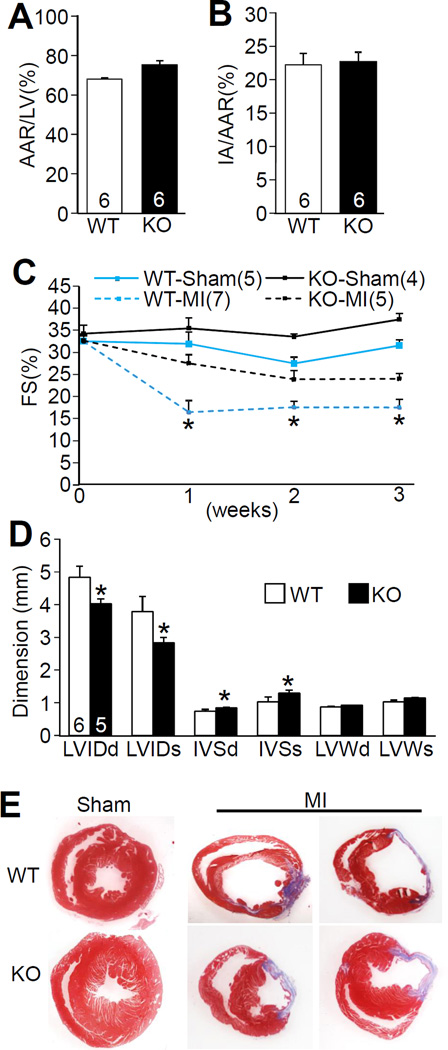
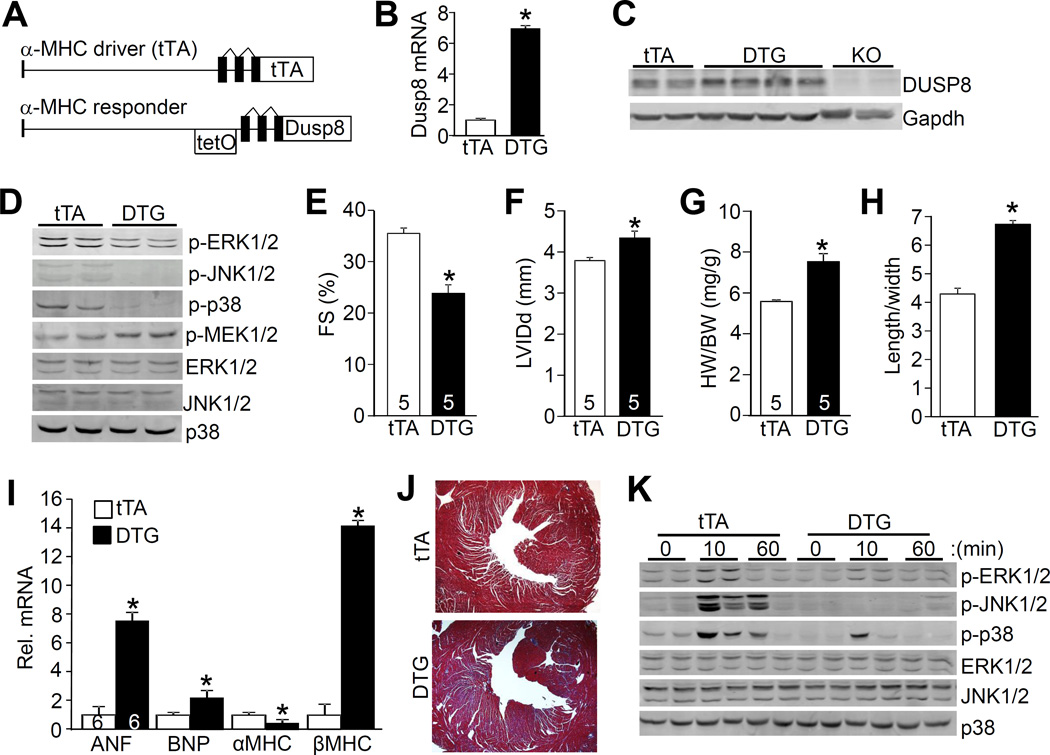
Methods and results: Dusp8 gene-deleted mice and transgenic mice with inducible expression of DUSP8 in the heart were used here to investigate how this MAPK-phosphatase might regulate intracellular signaling and cardiac growth dynamics in vivo. Dusp8 gene-deleted mice were mildly hypercontractile at baseline with a cardiac phenotype of concentric ventricular remodeling, which protected them from progressing towards heart failure in 2 surgery-induced disease models. Cardiac-specific overexpression of DUSP8 produced spontaneous eccentric remodeling and ventricular dilation with heart failure. At the cellular level, adult cardiac myocytes from Dusp8 gene-deleted mice were thicker and shorter, whereas DUSP8 overexpression promoted cardiac myocyte lengthening with a loss of thickness. Mechanistically, activation of extracellular signal-regulated kinases 1/2 were selectively increased in Dusp8 gene-deleted hearts at baseline and following acute pathological stress stimulation, whereas p38 MAPK and c-Jun N-terminal kinases were mostly unaffected.

Conclusions: These results indicate that DUSP8 controls basal and acute stress-induced extracellular signal-regulated kinases 1/2 signaling in adult cardiac myocytes that then alters the length-width growth dynamics of individual cardiac myocytes, which further alters contractility, ventricular remodeling, and disease susceptibility.

Keywords: dilated cardiomyopathy; disease susceptibility; dual-specificity phosphatase; heart failure; myocardium.


Conflict of interest statement

DISCLOSURES

No financial or other conflicts of interest exist with any of the authors.

Figures

Figure 1
Figure 1. DUSP8 is predominantly expressed in cardiac myocytes and regulates MAPK activity to influence myocyte growth
A, Western blot analysis of DUSP8 levels in cardiac myocytes (myocytes) and nonmyocytes isolated from adult hearts. Exactly 20 and 40 μg of protein were loaded for the Western blotting. Gapdh was used as the loading control. B, Western blot analysis of DUSP8 induction in cultured adult cardiac myocytes in response to phenylephrine (PE, 10 μmol/L) or angiotensin II (AngII, 0.1 μmol/L) for the time shown in hours. C, Western blot analysis of DUSP8 induction in the hearts of mice subjected to TAC or MI, harvested at the times shown in hours after the procedure. D, Western blot analysis for total and phosphorylated MAPKs and MAPKKs from cultured neonatal rat cardiac myocytes infected with the 2 indicated adenoviruses. PE was used at 10 μmol/L for the indicated time in minutes. E, Western blot analysis for total and phosphorylated MAPKs and MAPKKs from cultured cardiac myocytes transfected with scramble siRNA or Dusp8 siRNA for 48 hours. PE was again given for the indicated times in minutes. F, Representative images of adult rat cardiac myocytes infected with Adβgal (Con), AdDUSP8, AdMEK1, or transfected with Dusp8 siRNA (siDusp8) for 48 hours. Myocytes were stained with antibody against sarcomeric α-actinin (red). Magnification is 400X total. G, Quantification of length/width ratio of adult myocytes shown in Figure 1F. *p<0.05 vs Adβgal or scramble. Approximately 60~80 cells were analyzed for the length/width ratio.
Figure 2
Figure 2. Gene targeting of Dusp8 and resulting cardiac phenotype
A, Schematic of the Dusp8 genetic locus and the targeting vector (T.V.) used to create Dusp8 gene-deleted embryonic stem cells, then mice. Restriction enzyme sites and exons are shown, and the neomycin (Neo) resistance cassette in the T.V. B, RT-PCR analysis of Dusp8 mRNA in the brain, heart and lung of 2 month-old WT versus Dusp8 KO mice. Gapdh was used as PCR control. C, Real-time PCR analysis of expression of multiple Dusp mRNAs in hearts of 2 month-old Dusp8 WT or KO mice. N=3 individual samples. D, Heart weight (HW) normalized to body weight (BW) in Dusp8 WT and KO mice at the indicated ages. Number of mice used is shown in the bars. E-F, Echocardiographic assessment of FS and interventricular septal thickness in diastole (IVSd) in Dusp8 WT and KO mice at the indicated ages. *p<0.05 vs WT. Number of mice used is shown in the bars. G, Representative Masson trichrome-stained histological sections from the hearts of Dusp8 WT and KO mice at 6 months of age. Magnification is 40x total. H, Representative microscopic phase-contrast images of adult cardiac myocytes isolated from 6 month-old Dusp8 WT and KO mice. Magnification is 200x total. I, Quantification of length/width ratio of adult cardiac myocytes isolated from Dusp8 WT and KO mice at 6 months of age as shown in panel “H”. A total of 248 myocytes were analyzed for each group. *p<0.05 vs WT. J, Analysis of the surface area of adult myocytes isolated from 6 month-old Dusp8 WT and KO mice as shown in panel “H”. A total of 248 myocytes were analyzed for each group. K and L, Invasive hemodynamic measurement of (K) cardiac contractility at baseline (load-dependent) as maximum rate of pressure change in the left ventricle over time (dP/dt max) or (L) time constant for isovolumetric relaxation (Tau) showing the exponential decay of ventricular pressure during isovolumic relaxation in Dusp8 WT and KO mice. N=3 for each group. *p<0.05 vs WT. M, Real-time PCR analysis for mRNA levels of atrial natriuretic factor (ANF), b-type natriuretic peptide (BNP), β-myosin heavy chain (βMHC), and α-myosin heavy chain (αMHC) in 2 month-old Dusp8 WT or KO mice. N=4 for each group. *p<0.05 vs WT.
Figure 3
Figure 3. Loss of Dusp8 leads to increased ERK1/2 phosphorylation
A, Western blot assessment of MAPK phosphorylation and total MAPK levels in Dusp8 WT and KO MEFs in culture with or without PE stimulation at 10 μmol/L for the indicated times (0 time point is no PE stimulation). Of note, there is an open lane between the 6 WT and KO protein samples on the Western blot, given the variable bleed over from the adjacent lanes. B, Quantitative analysis of phosphorylated MAPKs relative to total MAPKs in 2 month-old Dusp8 WT and KO hearts and brains shown in Online Figure IIIB. N=4 for each group. *p<0.05 vs WT. C, D and E, Western blot analysis of cardiac MAPK phosphorylation and total MAPK levels in Dusp8 WT or KO mice after (C) PE or (D and E) TAC stimulation as indicated in the panel, for the indicated period of time in minutes. N=4 or greater for each. F, Western blot analysis of interaction between endogenous MAPKs (ERK1/2, p38, and JNK1/2) and exogenously expressed Flag-DUSP8 in HEK293 cells. This experiment was repeated three times with similar results.
Figure 4
Figure 4. Analysis of cardiac hypertrophy and remodeling in Dusp8 KO mice after stress stimulation
A, HW/BW ratio in Dusp8 WT and KO mice 2 weeks after AngII/PE infusion or PBS control. Number of mice used is shown within the bars. *p<0.05 vs PBS. B, Echocardiographic assessment of FS in Dusp8 WT and KO mice after 2 weeks of AngII/PE infusion. *p<0.05 vs WT AngII/PE. Number of mice analyzed is shown in the bars. C, Analysis of length/width ratio of adult cardiac myocytes isolated from Dusp8 WT and KO mice after AngII/PE infusion. Approximately 250 myocytes were analyzed for each group. *p<0.05 vs WT. D, HW/BW ratio in Dusp8 WT and KO mice 2 weeks after TAC or a sham procedure. Number of mice analyzed is shown in the bars. *p<0.05 vs Sham. E, Echocardiographic analysis of FS in Dusp8 WT or KO mice after 2 weeks of TAC or a sham procedure. *p<0.05 vs WT TAC. Number of mice analyzed is shown in the bars. F, Analysis of length/width ratio of adult cardiac myocytes isolated from Dusp8 WT and KO mice after 2 weeks of TAC. Approximately 250 myocytes were analyzed for each group.*p<0.05 vs WT. G, Analysis of adult cardiac myocyte area from dissociated hearts from Dusp8 WT and KO mice after AngII/PE, TAC or a sham procedure. Approximately 250 myocytes were analyzed for each group. H and I, Real-time PCR analysis of mRNA levels of ANF, BNP, βMHC, and αMHC from hearts of Dusp8 WT and KO mice after AngII/PE (H) or TAC (I) stimulation for 2 weeks compared to sham operated groups. At least 4 mice (hearts) were analyzed in each group. *p<0.05 vs WT or KO sham; #p<0.05 vs WT sham. J, Echocardiographic analysis of FS in Dusp8 WT and KO mice following TAC or a sham procedure for the indicated time in weeks. *p<0.05 vs KO TAC. Number of mice analyzed is shown. K, HW/BW ratio in Dusp8 WT and KO mice 12 weeks after a TAC or a sham procedure. Number of mice analyzed is shown in the bars. *p<0.05 vs Sham.
Figure 5
Figure 5. Dusp8 KO mice are protected from heart failure following MI injury
A, Area-at-risk (AAR) normalized to the perfused-area of the left ventricle (LV) in Dusp8 WT and KO mice subjected to 60 minutes of ischemia followed by 24 hours of reperfusion. Number of mice analyzed is shown in the bars. B, Assessment of infarct-area normalized to area-at-risk (IA/AAR) in the hearts of Dusp8 WT and KO mice after I/R injury. Number of mice analyzed is shown in the bars. C, Echocardiographic assessment of FS in Dusp8 WT and KO mice subjected to a sham or a MI procedure for the indicated times. *p<0.05 vs KO MI. D, Echocardiographic parameters in Dusp8 WT and KO mice 3 weeks after MI surgery. LVIDd and LVIDs, left ventricular end-diastolic and end-systolic chamber diameters; IVSd and IVSs, intraventricular end-diastolic and end-systolic septal thickness. LVWd and LVWs, left ventricular end-diastolic and end-systolic posterior wall thickness. *p<0.05 vs WT after MI. Number of mice analyzed is shown in the bars. E, Masson trichrome-stained histological heart sections from Dusp8 WT and KO mice 3 weeks after MI or sham.
Figure 6
Figure 6. Generation of cardiac-specific DUSP8 transgenic mice and phenotypic characterization
A, Schematic of the bi-transgenic inducible expression system used to regulate DUSP8 heart-specific overexpression. Abbreviations: tetO, tetracycline operator with response elements. B and C, Analysis of cardiac DUSP8 expression by real-time PCR in double transgenic mice (DTG) versus only single transgenic tTA mice (B) and Western blot (C) from hearts of mice 6 weeks after Dox removal to induce expression, 9 weeks-old in total. *p<0.05 vs tTA. Dusp8 KO heart samples are shown as a control. D, Western blot analysis for MAPK phosphorylation and total MAPKs in tTA controls and DTG mice at 9 weeks of age. At least six separate heart samples were analyzed for each group with similar results. E and F, Echocardiographic assessment of FS and LV internal chamber dimension at end diastole (LVIDd) in tTA controls and DTG mice at 9 weeks of age with 6 weeks of transgene induction. *p<0.05 vs tTA control. Number of mice analyzed is shown in the bars. G, HW/BW ratio in tTA controls and DTG mice at 9 weeks of age. *p<0.05 vs tTA. Number of mice analyzed is shown in the bars. H, Analysis of length/width ratio of adult cardiac myocytes isolated from hearts of tTA and DTG mice with 6 weeks of transgene induction. A total of 170 myocytes were analyzed for each group. *p<0.05 vs tTA. I, Real-time PCR analysis of mRNA for the indicated genes from the hearts of tTA control and DTG mice. N=4 hearts for each group. *p<0.05 vs tTA. J, Masson trichrome-stained histological sections of hearts from tTA and DTG mice at 9 weeks of age. Magnification is 40X total. K, Western blot analysis for MAPK phosphorylation and total MAPK levels from hearts of tTA controls and DTG mice after TAC stimulation for the indicated time in minutes. The 0 time point represents sham mice. At least 4 separate samples were analyzed.

Similar articles

Cited by

References

    1. Kyriakis JM, Avruch J. Mammalian mapk signal transduction pathways activated by stress and inflammation: A 10-year update. Physiol Rev. 2012;92:689–737. - PubMed
    1. Cargnello M, Roux PP. Activation and function of the mapks and their substrates, the mapk-activated protein kinases. Microbiol Mol Biol Rev. 2011;75:50–83. - PMC - PubMed
    1. Goldsmith ZG, Dhanasekaran DN. G protein regulation of mapk networks. Oncogene. 2007;26:3122–3142. - PubMed
    1. Hall A. Rho gtpases and the control of cell behaviour. Biochem Soc Trans. 2005;33:891–895. - PubMed
    1. Goupil E, Wisehart V, Khoury E, Zimmerman B, Jaffal S, Hebert TE, Laporte SA. Biasing the prostaglandin f2alpha receptor responses toward egfr-dependent transactivation of mapk. Mol Endocrinol. 2012;26:1189–1202. - PMC - PubMed

Publication types

Substances