. 2016 Jun;22(3):487-96.
doi: 10.1017/S1431927616000799. Epub 2016 May 26.

Quantifying Variability of Manual Annotation in Cryo-Electron Tomograms

Affiliations

Quantifying Variability of Manual Annotation in Cryo-Electron Tomograms

Corey W Hecksel et al. Microsc Microanal. 2016 Jun.

Abstract

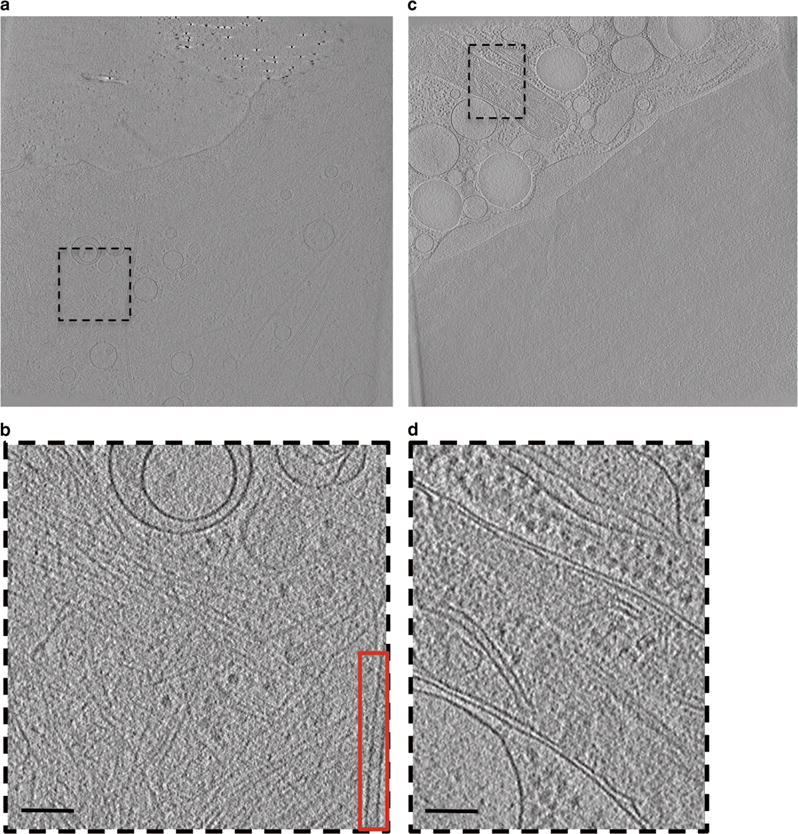
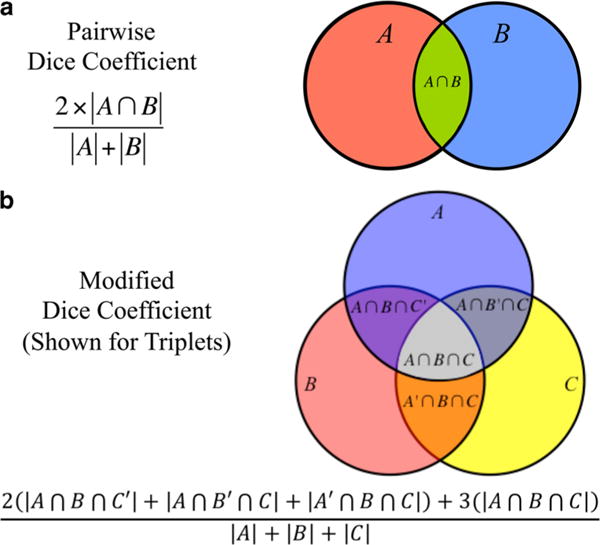
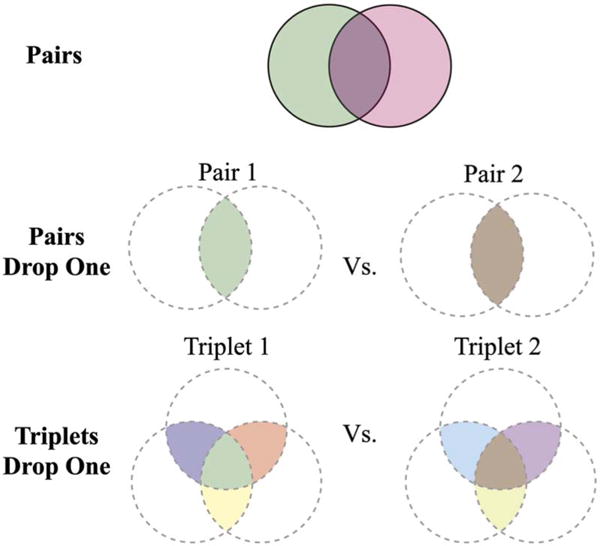
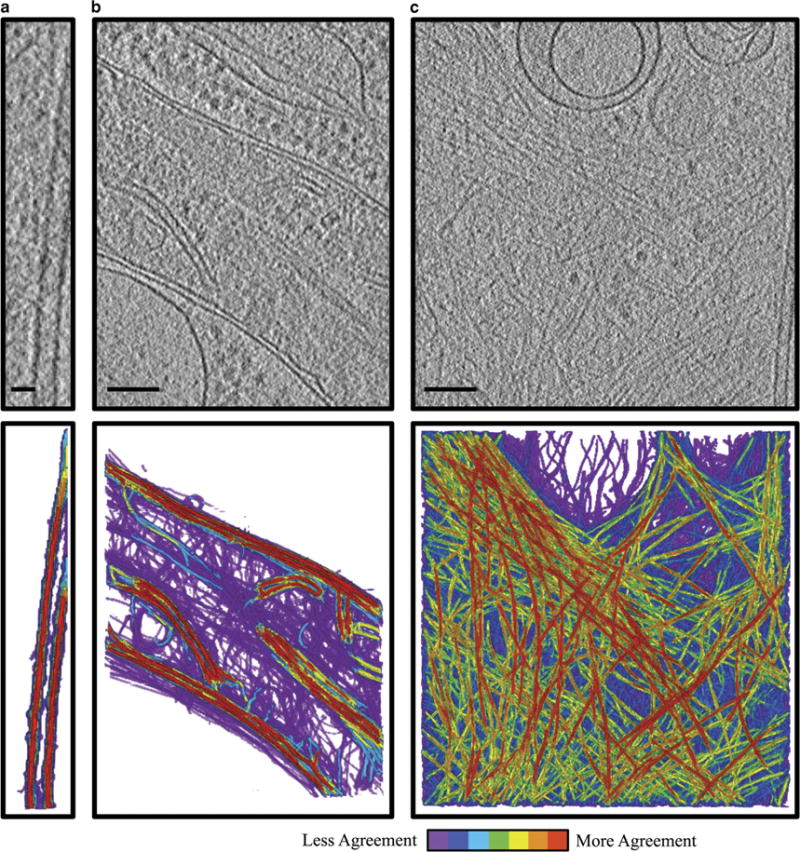
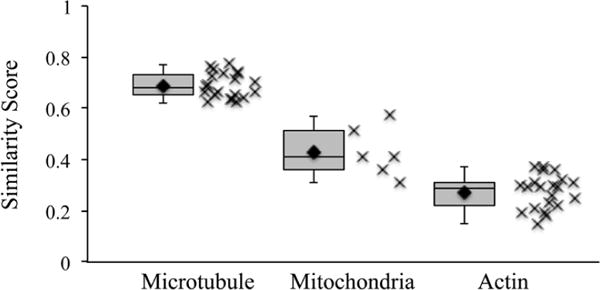
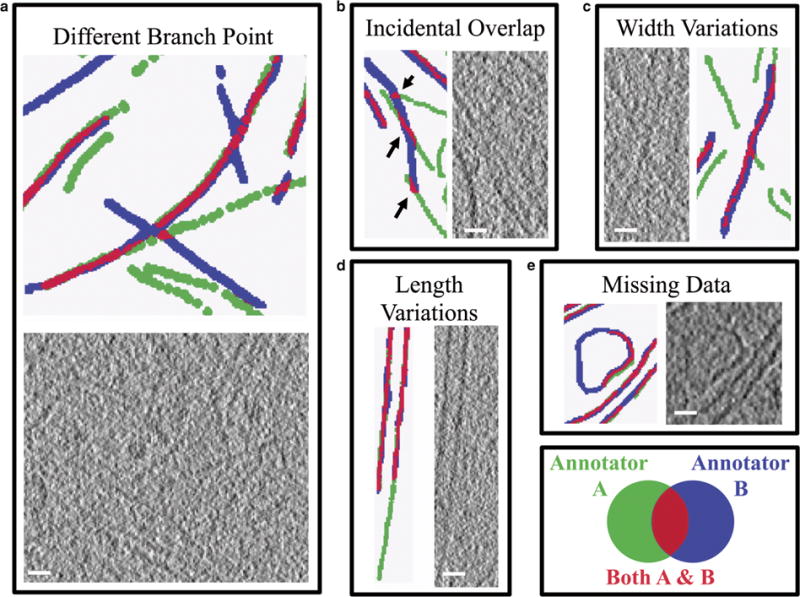
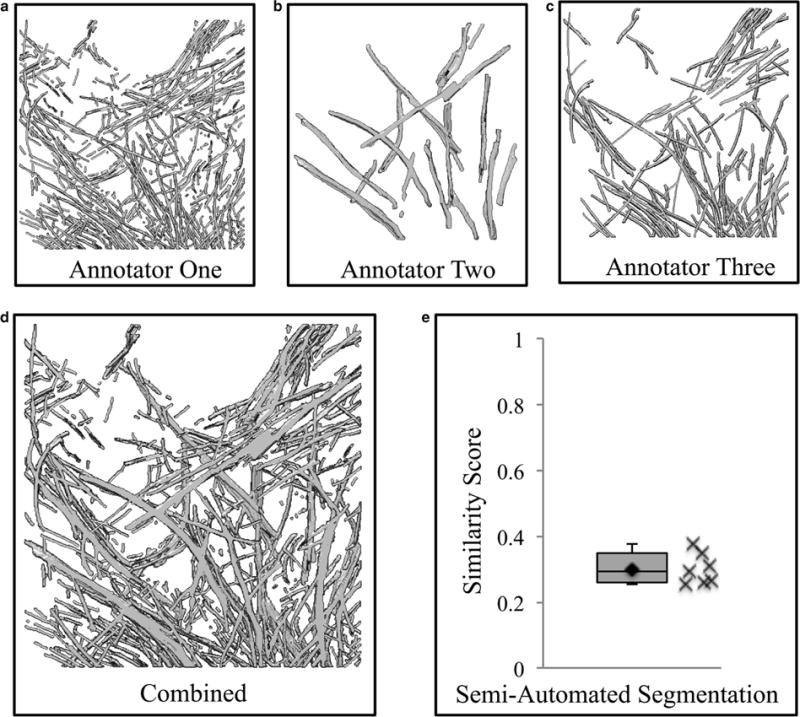
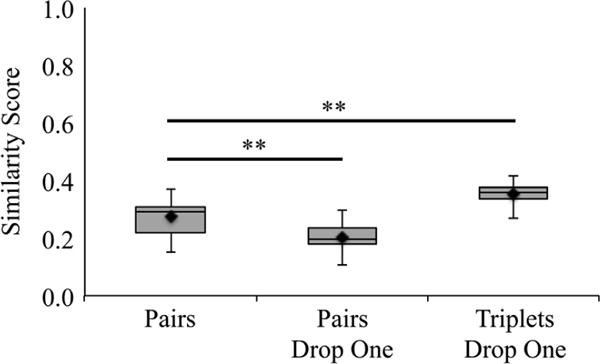
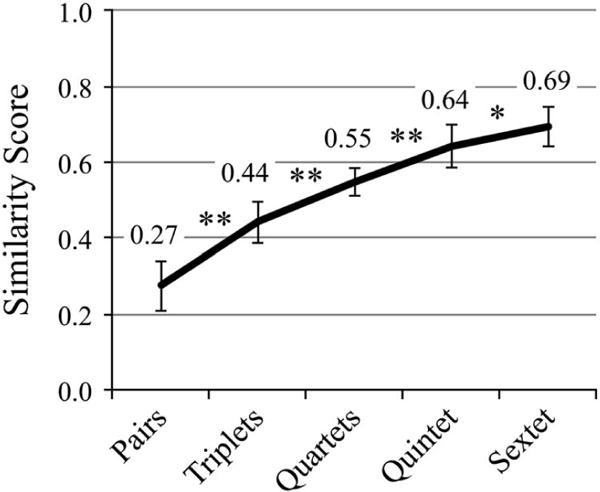
Although acknowledged to be variable and subjective, manual annotation of cryo-electron tomography data is commonly used to answer structural questions and to create a "ground truth" for evaluation of automated segmentation algorithms. Validation of such annotation is lacking, but is critical for understanding the reproducibility of manual annotations. Here, we used voxel-based similarity scores for a variety of specimens, ranging in complexity and segmented by several annotators, to quantify the variation among their annotations. In addition, we have identified procedures for merging annotations to reduce variability, thereby increasing the reliability of manual annotation. Based on our analyses, we find that it is necessary to combine multiple manual annotations to increase the confidence level for answering structural questions. We also make recommendations to guide algorithm development for automated annotation of features of interest.

Keywords: Dice coefficient; annotation; cryo-electron tomography; segmentation; validation.


Figures

Figure 1
Figure 1
Raw cellular tomograms including features to be annotated. Single slices through raw tomograms of intact mammalian cells (a,c). Boxed regions in (a) and (c) represent areas of interest selected for annotation (displayed in b,d). Actin and a single microtubule were annotated from (b) and red inset respectively, whereas mitochondria was annotated from (d). Scale bars are 100 nm.
Figure 2
Figure 2
Summary of Dice coefficient usage. Dice coefficient is a pairwise similarity score that we used to calculate overlap between two separate segmentations. This concept can be represented mathematically by the equations given and visually by a pairwise Venn diagram (a). In order to compare more than two segmentations at once, the Dice coefficient was modified to include all regions of overlap. An example equation and visualization is shown for a triplet comparison (b), but was extended up to sextets.
Figure 3
Figure 3
Schematic representation of pairs, Pairs Drop One, and Triplets Drop One. Pairwise Dice coefficient scores were calculated between two unmodified annotations (top row). In addition, two sets of modified annotations were created by either merging two of the original annotations and keeping only those voxels that were agreed upon by both of the annotators (Pairs Drop One; middle row) or merging three of the original annotations and keeping only those voxels that were agreed upon by at least two annotators (Triplets Drop One; bottom row). In both cases, the Dice coefficient was used in a pairwise fashion to compare the newly modified annotations.
Figure 4
Figure 4
Summation of annotations demonstrates inherent variability between annotations of the same feature. Projection images through ~180 nm slabs from a tomogram of intact mammalian cells (top) and merged annotations of each feature of interest (bottom). Red indicates voxels that were selected by all of the annotators, whereas purple indicates voxels that were selected by a single annotator (n = 7 for microtubule and actin, n = 4 for mitochondria). Note that purple indicates voxels from multiple individuals’ annotations, which have no agreement with anyone else’s annotations. Microtubules, a high contrast, easily annotated sample, show high agreement between annotators (a). Mitochondria, an intermediate sample with variations in contrast between outer membrane and cristae, shows some regions of high agreement, mainly at the outer membrane, and some of low, mainly in the dense regions internal to the mitochondria (b). Actin, a low contrast, difficult to annotate sample, shows many regions of low agreement (c). Scale bar is 25 nm for (a), Scale bar is 100 nm for (b) and (c).
Figure 5
Figure 5
The mean similarity score is dependent on the complexity of the feature being annotated. Box and whisker, and scatter plots of pairwise, voxel-based similarity scores for various samples. The average similarity scores are 69 ± 5, 43 ± 9, and 27 ± 6% for microtubules, mitochondria, and actin, respectively. Because of the high contrast and simplicity of microtubules, they represent a best-case scenario.
Figure 6
Figure 6
Five common types of discrepancy in annotation of cellular features. Subjective choices made by each annotator lead to inconsistencies in the final annotation both visually and quantitatively. Subjectivity during segmentation of various features within the data leads to different actin branch points (a), incidental overlap (b; black arrows), length variations (d), and missing data (e), whereas annotation pen size can lead to width variations (c). In most cases, small variations occur in segmenting the same features (ce), but in some cases, large variations occur when disparate features are segmented and happen to overlap (a,b). Green indicates voxels in one annotation, blue indicates voxels in a second annotation, and red indicates voxel agreement between the two annotations. Examples (a), (b), and (c) are from actin, whereas (d) is from microtubule and (e) is from mitochondria, however, it is important to note that excluding (a), these discrepancies can be found in all of the cellular features being annotated. Scale bars are 25 nm.
Figure 7
Figure 7
Voxel-based similarity scores are comparable with previously published similarity results. To recreate the similarity results previously reported, but in terms of voxel-based similarity, three expert annotations of actin were merged (d) and each individual annotation (ac) was then compared in a pairwise fashion with the combined data set. The individual annotations ranged from 38 to 57% in their similarity to the combined data set, a similar range as previously reported (Rigort et al., 2012). Voxel-based similarity scores (Dice coefficient) between a semi-automated annotation using ZIBAmira and seven manual actin segmentations show 30 ± 5% agreement, indicating the semi-automated annotation software is performing in the range of manual annotations (e).
Figure 8
Figure 8
Merging annotations and removing questionable voxels improves variability. To improve similarity and decrease variability, actin annotations were merged in two different ways. Pairs Drop One keeps only the voxels agreed upon by both annotations in each pair, whereas Triplets Drop One keeps the voxels agreed upon by at least two annotations in each triplet. In both cases, the kept voxels are then compared with another similarly merged data set using a pairwise Dice coefficient similarity score. When compared with the average pairs Dice coefficient, dropping the voxels that are not agreed upon by both pairs of modified merged annotations significantly decreases the similarity (right). However, applying a similar methodology to merged sets of triplets significantly improves the variability of merged sets of triplets when compared with pairs. **p < 0.0001.
Figure 9
Figure 9
Including more annotations improves variability, to a point. Using the seven manual actin annotations, every unique combination of pairs through sextets was created and sampled to determine the number of voxels in agreement with at least one other annotation. As more annotations are included, this metric increases significantly with each addition, beginning to plateau between quintet and sextet groups. *p < 0.05, **p < 0.0001.

Similar articles

Cited by

References

    1. Asano S, Fukuda Y, Beck F, Aufderheide A, Förster F, Danev R, Baumeister W. Proteasomes. A molecular census of 26S proteasomes in intact neurons. Science. 2015;347:439–442. - PubMed
    1. Dai W, Fu C, Raytcheva D, Flanagan J, Khant HA, Liu X, Rochat RH, Haase-Pettingell C, Piret J, Ludtke SJ, Nagayama K, Schmid MF, King JA, Chiu W. Visualizing virus assembly intermediates inside marine cyanobacteria. Nature. 2013;502:707–710. - PMC - PubMed
    1. Darrow MC, Sergeeva OA, Isas JM, Galaz-Montoya J, King JA, Langen R, Schmid MF, Chiu W. Structural mechanisms of mutant huntingtin aggregation suppression by synthetic chaperonin-like CCT5 complex explained by cryo-electron tomography. J Biol Chem. 2015;290:17451–17461. - PMC - PubMed
    1. Frangakis AS, Förster F. Computational exploration of structural information from cryo-electron tomograms. Curr Opin Struct Biol. 2004;14:325–331. - PubMed
    1. Frangakis AS, Hegerl R. Noise reduction in electron tomographic reconstructions using nonlinear anisotropic diffusion. J Struct Biol. 2001;135:239–250. - PubMed

Publication types

MeSH terms