. 2016 May 25;36(21):5775-84.
doi: 10.1523/JNEUROSCI.3250-15.2016.

Sox11 Balances Dendritic Morphogenesis with Neuronal Migration in the Developing Cerebral Cortex

Affiliations

Sox11 Balances Dendritic Morphogenesis with Neuronal Migration in the Developing Cerebral Cortex

Yoshio Hoshiba et al. J Neurosci. .

Abstract

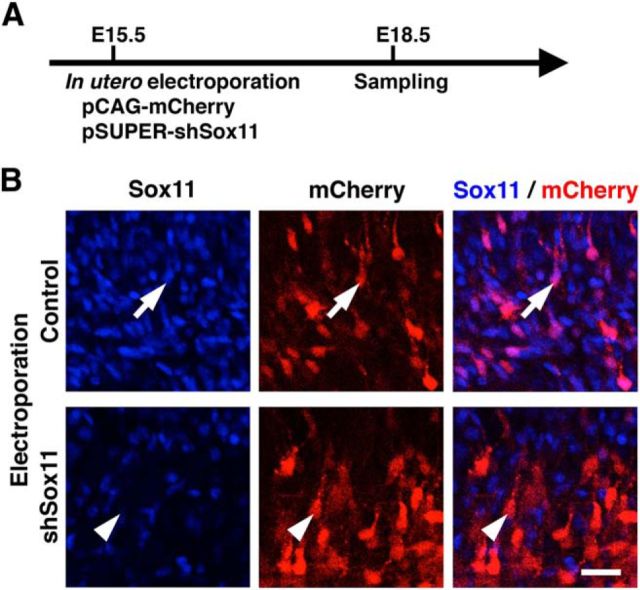
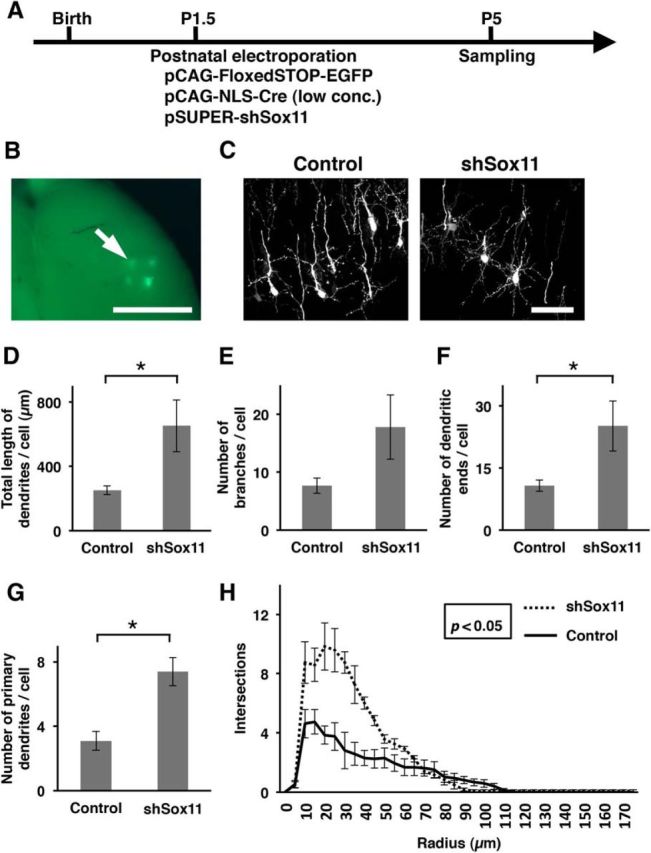
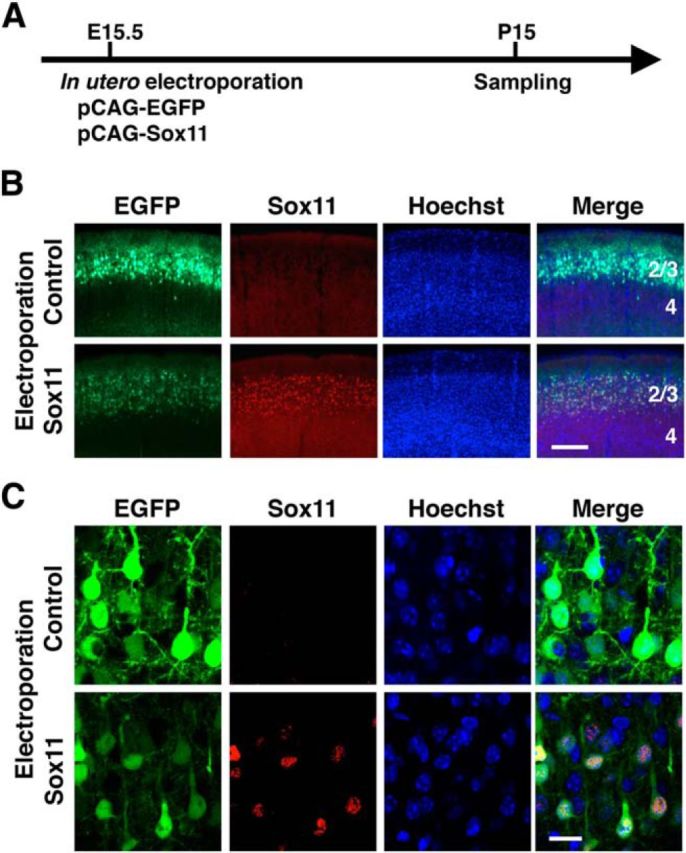
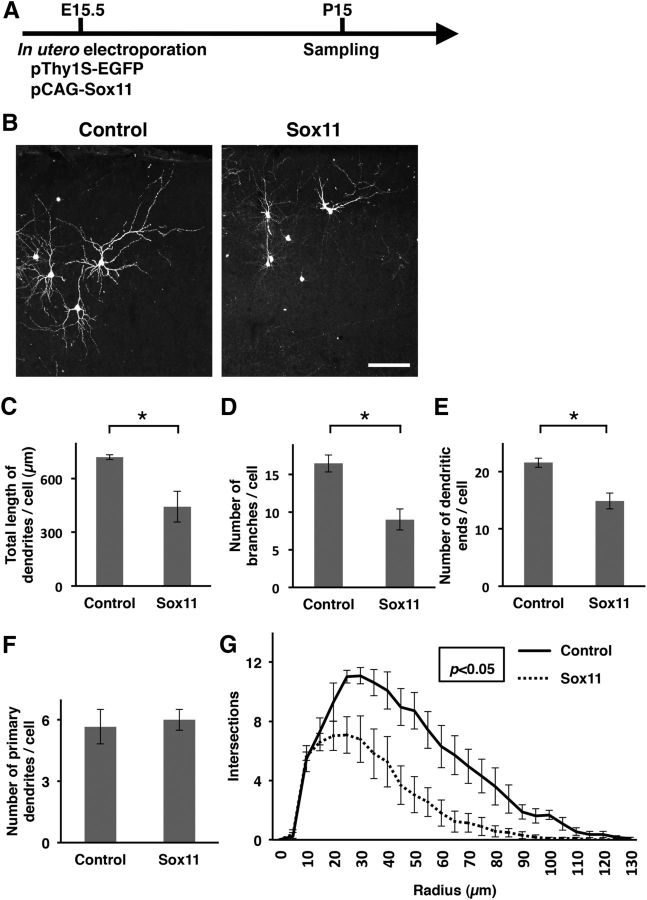
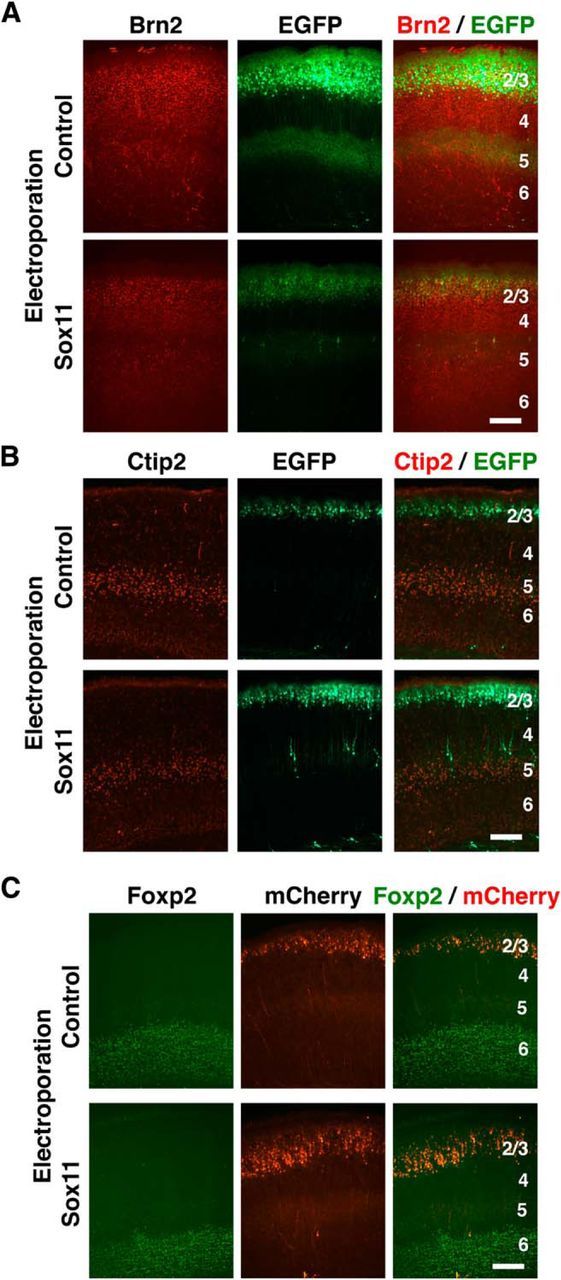
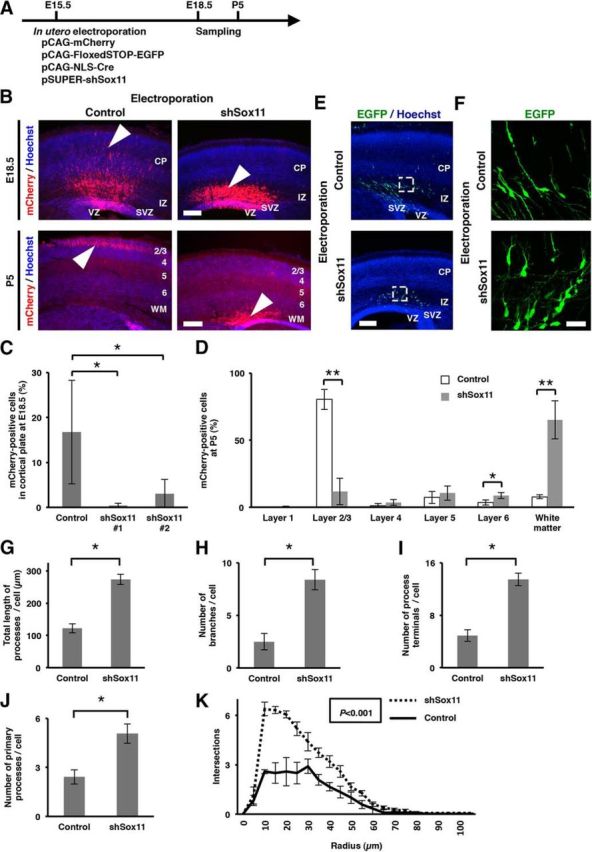
The coordinated mechanisms balancing promotion and suppression of dendritic morphogenesis are crucial for the development of the cerebral cortex. Although previous studies have revealed important transcription factors that promote dendritic morphogenesis during development, those that suppress dendritic morphogenesis are still largely unknown. Here we found that the expression levels of the transcription factor Sox11 decreased dramatically during dendritic morphogenesis. Our loss- and gain-of-function studies using postnatal electroporation and in utero electroporation indicate that Sox11 is necessary and sufficient for inhibiting dendritic morphogenesis of excitatory neurons in the mouse cerebral cortex during development. Interestingly, we found that precocious suppression of Sox11 expression caused precocious branching of neurites and a neuronal migration defect. We also found that the end of radial migration induced the reduction of Sox11 expression. These findings indicate that suppression of dendritic morphogenesis by Sox11 during radial migration is crucial for the formation of the cerebral cortex.

Significance statement: Because dendritic morphology has profound impacts on neuronal information processing, the mechanisms underlying dendritic morphogenesis during development are of great interest. Our loss- and gain-of-function studies indicate that Sox11 is necessary and sufficient for inhibiting dendritic morphogenesis of excitatory neurons in the mouse cerebral cortex during development. Interestingly, we found that precocious suppression of Sox11 expression caused a neuronal migration defect. These findings indicate that suppression of dendritic morphogenesis by Sox11 during radial migration is crucial for the formation of the cerebral cortex.

Keywords: Sox11; cerebral cortex; dendritic development; radial migration; transcription factor.


Conflict of interest statement

The authors declare no competing financial interests.

Figures

Figure 1.
Figure 1.
Characterization of anti-Sox11 antibody. A, Coronal sections of the mouse cerebral cortex were prepared from Sox11-deficient (−/−, bottom) and heterozygous (+/−, top) embryos at E18.5. The sections were stained with anti-Sox11 antibody (red) and Hoechst 33342 (blue). CP, Cortical plate; SVZ, subventricular zone; VZ, ventricular zone; ST, striatum. Scale bar, 200 μm. B, High-magnification confocal microscopic images of layer 6. Note that Sox11 immunoreactivity was lost in the sections derived from Sox11-deficient mice. Scale bar, 10 μm.
Figure 2.
Figure 2.
Expression levels of Sox11 and dendritic morphogenesis in the mouse cerebral cortex during development. A, Sox11 immunohistochemistry and Hoechst 33342 staining of coronal sections of the mouse cerebral cortex at P0, P3, P5, and P11. Numbers indicate the corresponding layers in the cerebral cortex. Scale bar, 200 μm. B, Magnified confocal microscopic images of Sox11 immunohistochemistry. Layer 2/3 has not been formed at P0. Scale bar, 20 μm. C, Experimental procedure of in utero electroporation to reveal the dendritic morphology of small numbers of layer 2/3 neurons. pCAG-FloxedSTOP-EGFP (1 mg/ml) and a very low concentration of pCAG-NLS-Cre (1.5 μg/ml) were cotransfected into layer 2/3 neurons using in utero electroporation at E15.5, and coronal sections were prepared at the indicated time points. EGFP signals were enhanced by immunostaining. D, Confocal microscopic images of EGFP-positive layer 2/3 neurons in coronal sections. Scale bar, 100 μm.
Figure 3.
Figure 3.
Characterization of the Sox11-shRNA-expression vector. A, Experimental procedure. pCAG-mCherry (0.3 mg/ml) and pSUPER-shSox11 (1.65 mg/ml) were cotransfected into layer 2/3 neurons using in utero electroporation at E15.5, and coronal sections were prepared at E18.5 and stained with anti-Sox11 antibody and Hoechst 33342. B, Confocal microscopic images of cells transfected with either control (arrow) or shSox11 (arrowhead) vectors. mCherry-positive transfected neurons in the intermediate zone are shown. Scale bar, 25 μm.
Figure 4.
Figure 4.
Precocious Sox11 knockdown promotes dendritic morphogenesis in layer 2/3 neurons. A, Experimental procedure of postnatal electroporation to investigate the dendritic morphology of Sox11-downregulated layer 2/3 neurons. pCAG-FloxedSTOP-EGFP (0.75 mg/ml), a very low concentration of pCAG-NLS-Cre (2.0 μg/ml) and pSUPER-shSox11 (1.25 mg/ml) were cotransfected into layer 2/3 neurons using postnatal electroporation at P1.5, and coronal sections were prepared at P5. EGFP signals were enhanced by immunostaining. B, A low-magnification image of the cerebral cortex in which postnatal electroporation was performed. EGFP signals (arrow) were observed at four plasmid injection sites. Scale bar, 2.0 mm. C, Confocal microscopic images of layer 2/3 neurons transfected with either control (left) or shSox11 (right) vectors. Coronal sections are shown. Scale bar, 50 μm. DG, Quantification of the total length of dendrites per cell (D), the number of dendritic branches per cell (E), the number of dendritic ends per cell (F), and the number of primary dendrites per cell (G). Data are presented as mean ± SEM; n = 3 animals per each experimental group; 9–10 transfected cells per each experimental group were analyzed. *p < 0.05. H, Sholl analysis of the dendritic complexity of the transfected neurons. Data are presented as mean ± SEM; n = 4 animals per each experimental group; 12–14 transfected cells per each experimental group were analyzed.
Figure 5.
Figure 5.
Characterization of the Sox11 expression vector. A, Experimental procedure. pCAG-EGFP (0.5 mg/ml) and pCAG-Sox11 (1.0 mg/ml) were cotransfected into layer 2/3 neurons using in utero electroporation at E15.5, and coronal sections were prepared at P15 and immunostained with anti-Sox11 antibody and Hoechst 33342. B, Sox11 immunoreactivity was detected in the cerebral cortex of the pCAG-Sox11-electroporated brain, whereas no signal was detected in that of the control brain. Numbers indicate the corresponding layers in the cerebral cortex. Scale bar, 200 μm. C, High-magnification confocal microscopic images of layer 2/3 neurons in B. Scale bar, 10 μm.
Figure 6.
Figure 6.
The reduction of Sox11 expression is required for dendritic morphogenesis of layer 2/3 neurons. A, Experimental procedure of in utero electroporation to investigate the dendritic morphology of Sox11-overexpressing layer 2/3 neurons. pThy1S-EGFP (1.75 mg/ml) and pCAG-Sox11 (1.0 mg/ml) were cotransfected into layer 2/3 neurons using in utero electroporation at E15.5, and coronal sections were prepared at P15. EGFP signals were enhanced by immunostaining. B, Confocal microscopic images of layer 2/3 neurons transfected with either control (left) or Sox11 (right) vectors. Scale bar, 100 μm. CF, Quantification of the total length of basal dendrites per cell (C), the number of branches of basal dendrites per cell (D), the number of dendritic ends of basal dendrites per cell (E) and the number of primary basal dendrites per cell (F). Data are presented as mean ± SEM; n = 3 animals per each experimental group; 9 transfected cells per each experimental group were analyzed. *p < 0.05. G, Sholl analysis of the dendritic complexity of the transfected neurons. Data are presented as mean ± SEM; n = 4 animals per each experimental group; 13 transfected cells per each experimental group were analyzed.
Figure 7.
Figure 7.
Sox11 overexpression in layer 2/3 neurons does not affect the identities of cortical neurons. Sox11 plus either EGFP or mCherry were cotransfected by using in utero electroporation at E15.5, and sections were prepared at P5 (Ctip2), P6 (Foxp2), or P15 (Brn2). The sections were stained with anti-Brn2, Ctip2, and FOXP2 antibodies. A, Brn2 immunostaining at P15. B, Ctip2 immunostaining at P5. C, Foxp2 immunostaining at P6. Numbers indicate the corresponding layers in the cerebral cortex. Scale bars, 250 μm.
Figure 8.
Figure 8.
Embryonic knockdown of Sox11 induces precocious dendrite branching and a radial migration defect. A, Experimental procedure. pCAG-mCherry (0.3 mg/ml), pSUPER-shSox11 (1.65 mg/ml), pCAG-FloxedSTOP-EGFP (1.0 mg/ml), and a very low concentration of pCAG-NLS-Cre (1.5 μg/ml) were cotransfected into layer 2/3 neurons using in utero electroporation at E15.5, and coronal sections were prepared at E18.5. EGFP signals were enhanced by immunostaining. B, The distribution of mCherry-positive transfected neurons at E18.5 (top) and at P5 (bottom). Many mCherry-positive control neurons had reached the cortical plate (CP) at E18.5 (arrow), whereas shSox11-transfected neurons were unable to reach cortical plate (arrowhead). At P5, whereas most control neurons were located in the cerebral cortex (arrow), shSox11-transfected neurons were preferentially distributed in the white matter (WM; arrowhead). Cortical layers are indicated with numbers. Scale bars: top, 200 μm; bottom, 300 μm. C, The effects of two independent shSox11 constructs on radial migration. The numbers of mCherry-positive cells in the cortical plate were divided by those of all mCherry-positive cells at E18.5. Data are presented as mean ± SD; n = 3 animals per each experimental group. *p < 0.05. D, The distribution of mCherry-positive cells at P5. The numbers of mCherry-positive cells in the indicated layers were divided by those of all mCherry-positive cells. Data are presented as mean ± SD; n = 3 animals per each experimental group. *p < 0.05; **p < 0.01. E, F, The morphology of neurons transfected with either control (top) or shSox11 (bottom) vectors (green). E, Low-magnification images of the cerebral cortex. Scale bar, 400 μm. F, High-magnification confocal microscopic images of the boxed areas in E. Scale bar, 25 μm. CP, Cortical plate; IZ, intermediate zone; SVZ, subventricular zone; VZ, ventricular zone. G–K, Quantification of the morphology of processes of shSox11-transfected migrating neurons at E18.5. Quantification of the total length of processes per cell (G), the number of branches per cell (H), the number of process ends per cell (I), and the number of primary processes per cell (J). Data are presented as mean ± SEM; n = 4 animals per each experimental group; 12 transfected cells per each experimental group were analyzed. *p < 0.01. K, Sholl analysis of the complexity of the processes of transfected neurons. Data are presented as mean ± SEM; n = 4 animals per each experimental group; 12 transfected cells per each experimental group were analyzed.
Figure 9.
Figure 9.
The end of radial migration triggers the reduction of Sox11 expression. A, Experimental procedure. pCAG-EGFP (0.5 mg/ml) and pCAG-DN-Ncad (0.5 mg/ml) were cotransfected into layer 2/3 neurons using in utero electroporation at E15.5. Coronal sections were prepared at P3, and Sox11 immunostaining and Hoechst 33342 staining were performed. B, Layer 2/3 neurons transfected with either control (left) or DN-Ncad (right) vectors (green). Note that DN-Ncad suppresses radial migration of transfected neurons. Numbers indicate the corresponding layers in the cerebral cortex. HP, Hippocampus. Scale bar, 200 μm. C, The expression levels of Sox11 in EGFP-positive transfected neurons. Sections were stained with anti-Sox11 antibody and Hoechst 33342. High-magnification confocal microscopic images of neurons transfected with either control (top) or DN-Ncad (bottom) vectors are shown. Note that the expression levels of Sox11 were lower in DN-Ncad-expressing neurons located in layer 5 (arrowhead) compared with control neurons located in layer 2/3 (arrow). Scale bar, 10 μm. D, Quantification of the expression levels of Sox11 in EGFP-positive neurons. Data are presented as mean ± SEM; n = 3 animals per each experimental group. *p < 0.05.

Comment in

References

    1. Aizawa H, Hu SC, Bobb K, Balakrishnan K, Ince G, Gurevich I, Cowan M, Ghosh A. Dendrite development regulated by CREST, a calcium-regulated transcriptional activator. Science. 2004;303:197–202. doi: 10.1126/science.1089845. - DOI - PubMed
    1. Ako R, Wakimoto M, Ebisu H, Tanno K, Hira R, Kasai H, Matsuzaki M, Kawasaki H. Simultaneous visualization of multiple neuronal properties with single-cell resolution in the living rodent brain. Mol Cell Neurosci. 2011;48:246–257. doi: 10.1016/j.mcn.2011.08.005. - DOI - PubMed
    1. Bando Y, Irie K, Shimomura T, Umeshima H, Kushida Y, Kengaku M, Fujiyoshi Y, Hirano T, Tagawa Y. Control of spontaneous Ca2+ transients is critical for neuronal maturation in the developing neocortex. Cereb Cortex. 2016;26:106–117. doi: 10.1093/cercor/bhu180. - DOI - PubMed
    1. Barnes AP, Polleux F. Establishment of axon-dendrite polarity in developing neurons. Annu Rev Neurosci. 2009;32:347–381. doi: 10.1146/annurev.neuro.31.060407.125536. - DOI - PMC - PubMed
    1. Bergsland M, Werme M, Malewicz M, Perlmann T, Muhr J. The establishment of neuronal properties is controlled by Sox4 and Sox11. Genes Dev. 2006;20:3475–3486. doi: 10.1101/gad.403406. - DOI - PMC - PubMed

Publication types

Substances

LinkOut - more resources