. 2016 Sep;26(9):1245-56.
doi: 10.1101/gr.201244.115. Epub 2016 May 25.

Chromatin dynamics during DNA replication

Affiliations

Chromatin dynamics during DNA replication

Raz Bar-Ziv et al. Genome Res. 2016 Sep.

Abstract

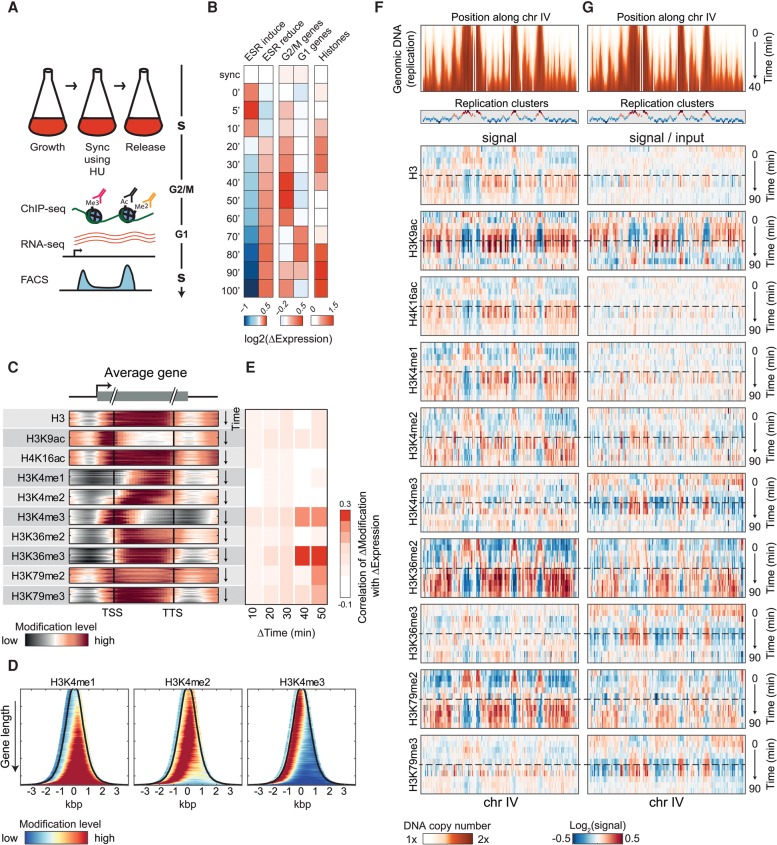
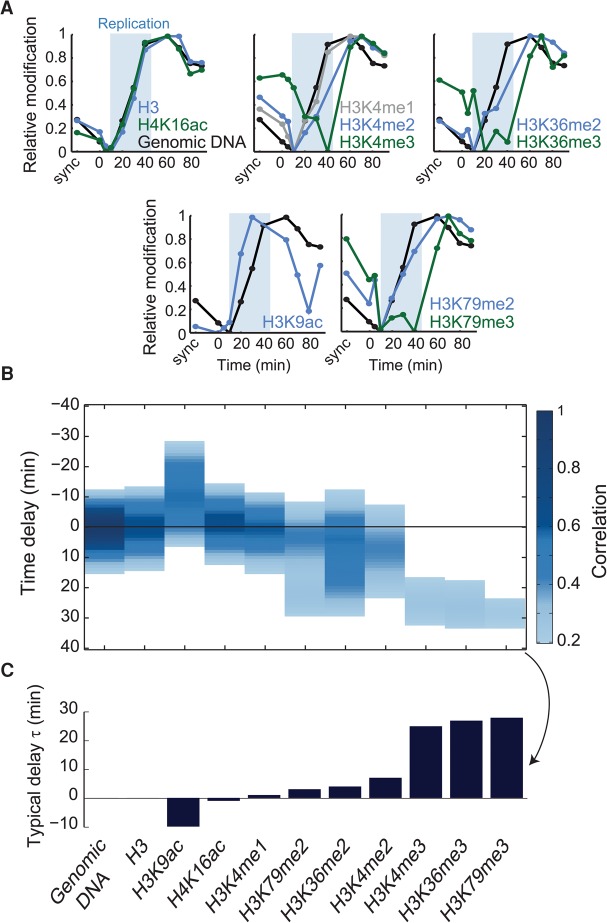
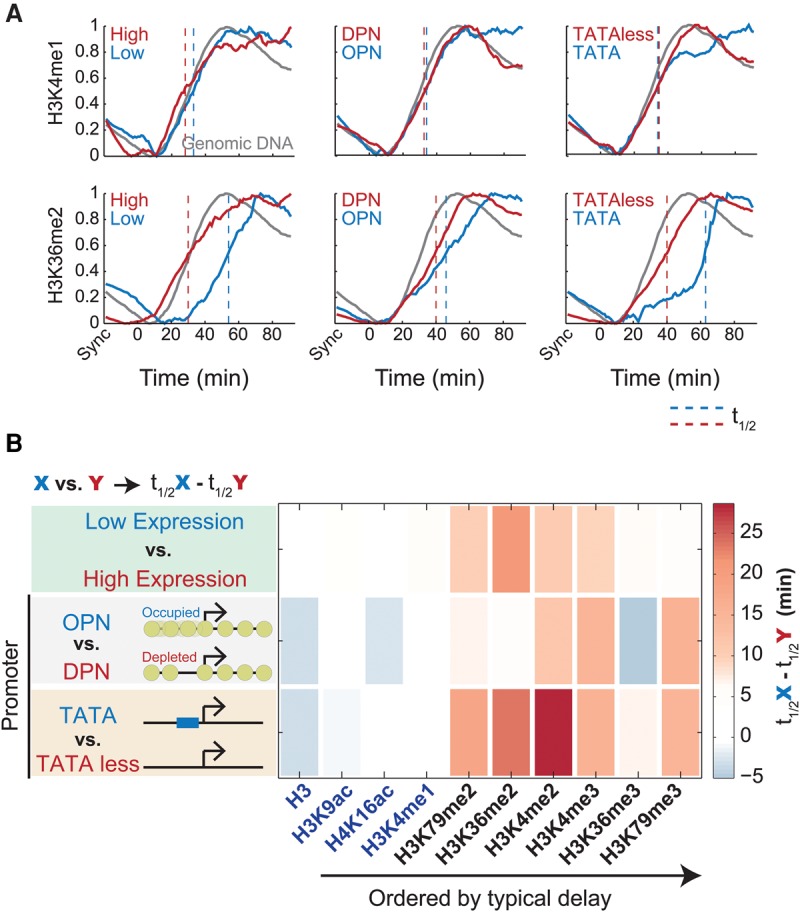
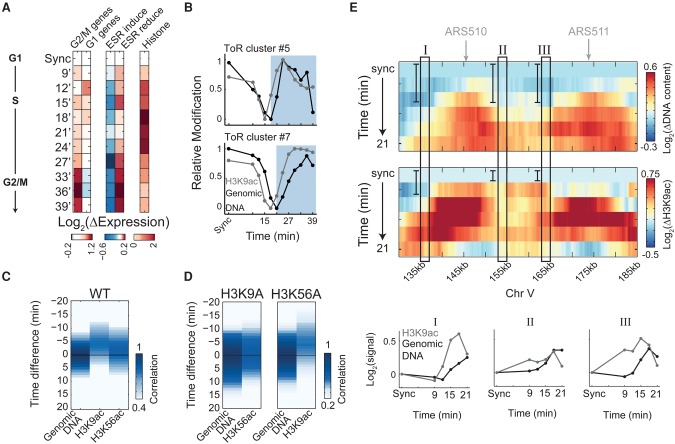
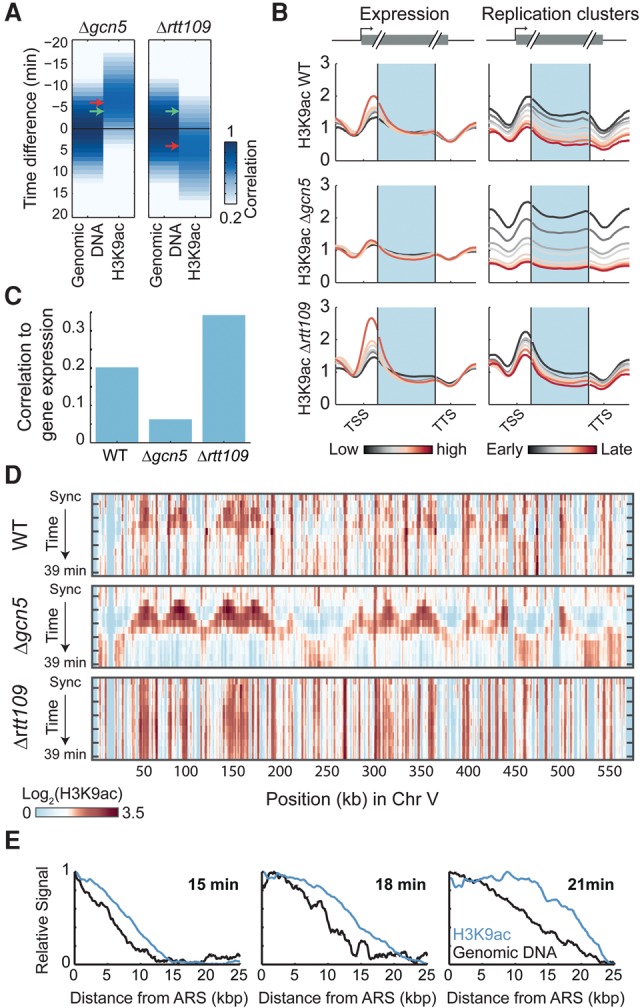
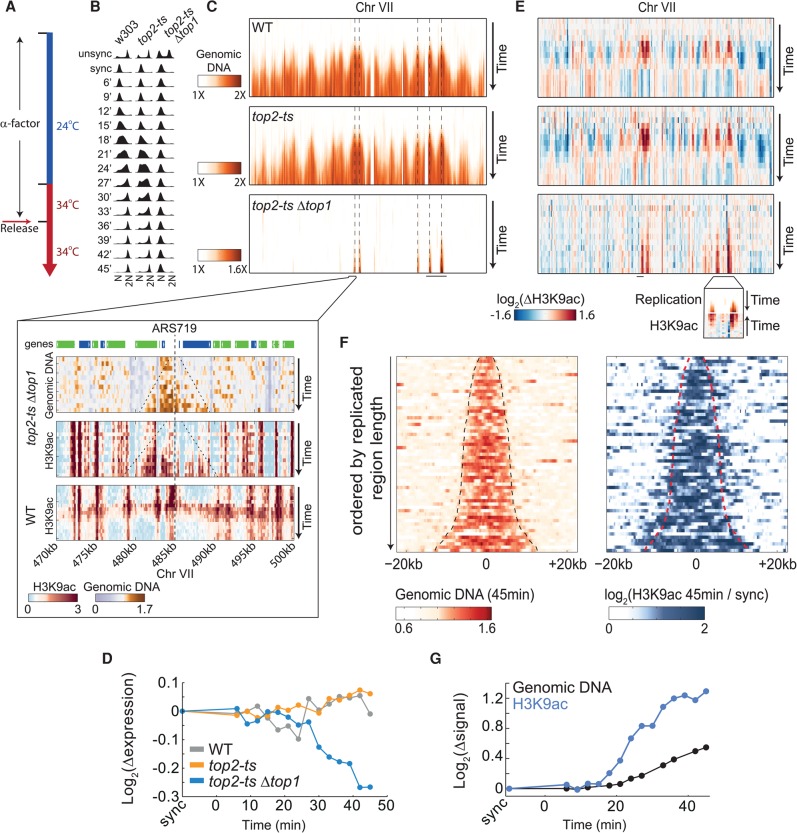
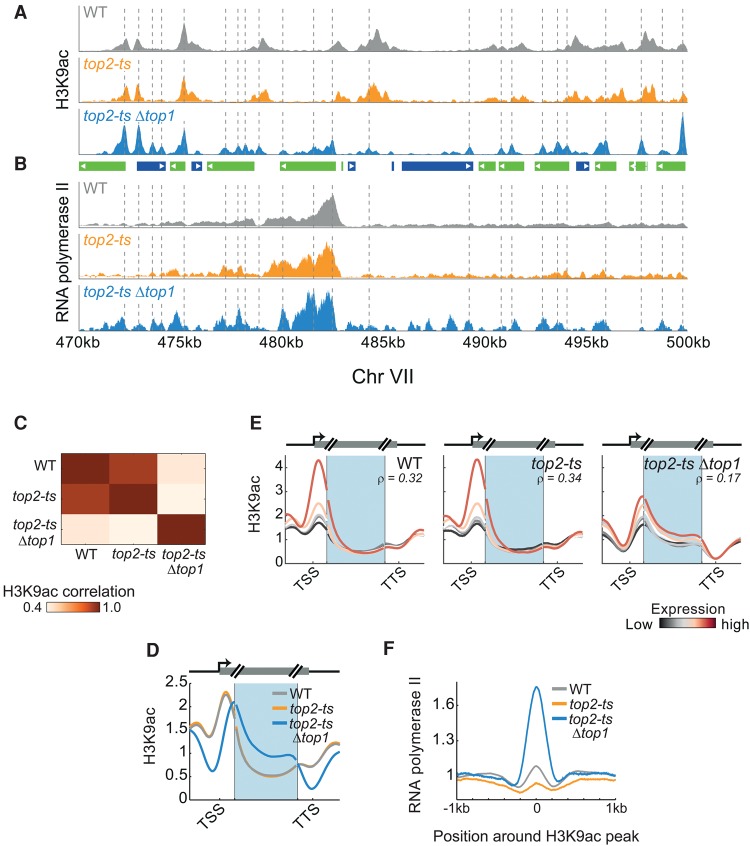
Chromatin is composed of DNA and histones, which provide a unified platform for regulating DNA-related processes, mostly through their post-translational modification. During DNA replication, histone arrangement is perturbed, first to allow progression of DNA polymerase and then during repackaging of the replicated DNA. To study how DNA replication influences the pattern of histone modification, we followed the cell-cycle dynamics of 10 histone marks in budding yeast. We find that histones deposited on newly replicated DNA are modified at different rates: While some marks appear immediately upon replication (e.g., H4K16ac, H3K4me1), others increase with transcription-dependent delays (e.g., H3K4me3, H3K36me3). Notably, H3K9ac was deposited as a wave preceding the replication fork by ∼5-6 kb. This replication-guided H3K9ac was fully dependent on the acetyltransferase Rtt109, while expression-guided H3K9ac was deposited by Gcn5. Further, topoisomerase depletion intensified H3K9ac in front of the replication fork and in sites where RNA polymerase II was trapped, suggesting supercoiling stresses trigger H3K9 acetylation. Our results assign complementary roles for DNA replication and gene expression in defining the pattern of histone modification.


Figures

Figure 1.
Figure 1.
Cell-cycle dynamics of chromatin marks. (A) Experimental scheme. Yeast cells were synchronized to the beginning of S phase using hydroxyurea (HU), released, and followed as they progressed through the cell cycle. Samples for DNA staining (using FACS), RNA-seq, and ChIP-seq were taken every 5–10 min. (B) Gene expression along the cell cycle. Average log2 changes in the expression of cell-cycle genes (G1, G2/M, and histones) and environmental stress response (ESR) genes at the indicated time-points. (C) Enrichment of histone marks at different positions along genes. Metagene representation of the indicated histone marks. Subsequent time-points are shown from top to bottom. Genes were aligned by their transcription start site (TSS) and transcription termination site (TTS) and are normalized (through binning) to the same length. (D) Modification pattern on all genes. Abundance of H3K4 methylations for all genes (transcript +250 bp from both sides), sorted by gene length and aligned to the middle of the transcript. Black line depicts TSS (left) and TTS (right). Data for each gene were averaged over the entire time-course. For other modifications, see Supplemental Figure S2C. (E) Correlations between changes in gene expression and changes in histone modifications. Changes were calculated between time-points separated by the indicated time lag (Δtime). Correlations are over all time-points with the indicated shift and are confined to genes of the ESR (Gasch et al. 2000), which showed a significant variation. For all individual correlations measured also for all genes, see Supplemental Figures S3 and S1D, and for normalization by different total modification dynamics, see Supplemental Figure S13. (F,G) Replication-associated dynamics of histone modifications. DNA content (top; genomic DNA) and the abundance of the indicated histone marks (bottom; as indicated) along chromosome IV are shown. Each plot depicts the signal along the chromosome (horizontal) at different times (vertical) relative to the average in the entire time-course. Assignment of regions to replication clusters is also shown (see also Supplemental Fig. S5A–C). Dashed line indicates the 40-min time-point when replication ends (see also Supplemental Fig. S5D). Histones marks are shown with or without normalization by DNA content, in G and F, respectively.
Figure 2.
Figure 2.
Delayed recovery of histone modifications following DNA replication. (A) Replication-associated dynamics of histone marks. Abundances of genomic DNA (black) or histone marks were averaged over all regions assigned to replication cluster six (mid-late replicating) (for more clusters, see Supplemental Fig. S6). Shaded blue area denotes the time period in which this cluster was replicated. Initial decrease in signal resulted from data normalization, reflecting the increase in signal from earlier replicating loci (see Supplemental Note S1). All signals are log2-transformed, normalized by the signal in synchronized culture, and adjusted to show the same dynamic range. (B,C) Delayed post-replication recovery. Correlations were measured between changes in modification levels at time t and changes in DNA content at time t − τ. These cross-correlations are shown as a function of the delay τ (B). Only correlations higher than 0.2 are shown (see also Methods; Supplemental Fig. S7). The typical delay time between DNA replication and the indicated histone marks was defined as the time τ showing the maximal cross-correlation (C).
Figure 3.
Figure 3.
Post-replication delay in histone modifications depends on gene expression and promoter architecture. (A) Replication-associated dynamics of histone marks (as Fig. 2A) calculated separately for genes with the 25% highest or 25% lowest expression levels (left), genes containing occupied or depleted proximal nucleosome (OPN or DPN, respectively) promoter structure (center), or genes containing TATA/TATA-less promoters (right). Genomic DNA was plotted for comparison (gray). Typical half-life (t1/2) was defined as the time to reach half-maximal increase (dashed line), averaged over the three late-replicating clusters (5–7) for all modifications and features, and plotted in B.
Figure 4.
Figure 4.
H3K9 acetylation precedes replication. (A) Experimental scheme and gene expression. Cells were released from α-factor G1-arrest and sampled every 3 min for DNA staining, RNA-seq, and ChIP-seq of H3K9ac and H3K56ac. Gene expression changes are shown, as in Figure 1B. (B) Prereplication increase in H3K9ac. Same as Figure 2A for the indicated clusters (see more clusters in Supplemental Fig. S8C). (C,D) H3K9ac precedes DNA replication. Cross-correlation analysis as in Figure 2B, for H3K9ac and H3K56ac in wild-type cells (C), and in cells carrying the H3K9A or H3K56A histone variants (D). See replication progression in Supplemental Figure S8, F through H. (E) Prereplication increase in H3K9ac along 55 kb of chromosome V. Same as Figure 1F for wild-type cells released from α-factor synchronization. Data were normalized by the synchronized time-point and were plotted up to 21 min (for the full time-course, see Supplemental Fig. S8D). Autonomously replicating regions (ARSs) are indicated (top). Three 2-kb regions (I–III, marked by rectangles) were averaged for both H3K9ac and DNA content in each time-point and plotted together for comparison.
Figure 5.
Figure 5.
Replication-guided H3K9ac depends on Rtt109, while deletion of Gcn5 abolishes the expression-associated H3K9ac. (A) Prereplication H3K9ac depends on Rtt109. Same as Figure 2B for the indicated mutants. Arrows indicate the typical delay in the WT (green) or in the deletion strain (red). For H3K56ac in Δgcn5, see Supplemental Figure S9D. (B) Metagene pattern of H3K9ac in cells deleted of Gcn5 or Rtt109. Genes were separated into six groups based on their expression levels (left) or based on their replication clusters (right). The corresponding metagene patterns (cf. Fig. 1C) of H3K9ac in synchronized culture or in the middle of S phase (18 min) are shown, respectively. (C) Correlation between H3K9ac abundance and gene expression is lost in cells deleted of Gcn5. Correlations of gene expression to H3K9ac for the indicated strains at the synchronized time-point. Similar results were obtained at all other time-points. (D) The pattern of H3K9ac in wild type combines the replication- and transcription-associated patterns. H3K9ac (raw signal) in the indicated strains is plotted along chromosome V. (E) Spatial spreading of H3K9ac ahead of replication: All early ARS (<21 min in Yabuki et al. 2002) were aligned, and the average H3K9ac and genomic DNA signals were plotted over a 25-kb distance. Signal spreading is shown for three consecutive time-points in the gcn5-deleted strain and normalized by the synchronized time-point (Methods; see Supplemental Fig. S10 for H3K56ac).
Figure 6.
Figure 6.
Topoisomerases depletion intensifies the prereplication H3K9ac. (A) Experimental scheme. Cells were grown in the permissive temperature (24°C), synchronized using α-factor, and 30 min before release transferred to the restrictive temperature (34°C). Cells were released from G1 arrest and sampled every 3 min for DNA staining, RNA-seq, and ChIP-seq of H3K9ac. Binding of RNA polymerase II was measured using ChIP-seq in the synchronized time-point. Gene expression changes of cell-cycle-regulated genes are shown in Supplemental Figure S11A. (B) S-phase progression. Flow cytometry analysis of DNA-stained cells collected at the indicated time-points. (C) Topoisomerase depletion arrests DNA replication. Same as Figure 1F (top) for the indicated strains on chromosome VII. Dashed lines denote confirmed replication origins (based on OriDB) that intersect with regions that were replicated in the double mutant (Nieduszynski et al. 2007). A high-resolution view of a 30-kb region is shown in the inset, together with the corresponding H3K9ac profile. Top panel represents genes. (Blue) Watson; (green) Crick. Dashed lines in inset indicate the replicated region and the replication origin. For all chromosomes, see Supplemental Figure S11B. (D) Topoisomerase depletion represses gene expression in replicated regions. Log2 changes in gene expression, relative to synchronized cells, averaged over all genes (∼400) positioned in regions that were replicated in the topoisomerase-depleted strain. (E) H3K9ac on chromosome VII. H3K9ac normalized by the synchronized time-point. The inset is a blow-up of the indicated region (also marked in C). (F) H3K9ac in replicated regions. All replicated regions in top2-tsΔtop1 were ordered according to their length. DNA abundance (left) and the H3K9ac levels (right) at these regions, 45 min after release, normalized by the synchronized time-point, are plotted. Dashed lines depict the edges of the replicated region. (G) H3K9ac precedes replication. Same as Figure 4B for one of the two clusters replicated in top2-tsΔtop1. For the second cluster, see Supplemental Figure S11C.
Figure 7.
Figure 7.
Replication-independent effects of topoisomerase depletion on H3K9ac and RNA polymerase II. (A,B) Colocalization of RNA polymerase II with replication-independent H3K9ac peaks. H3K9ac levels (A) and RNA pol II binding (B) in synchronized cells. Dashed lines highlight peaks of H3K9ac in the top2-tsΔtop1 strain. Gene positions are depicted in the center, as in Figure 6C (inset). (C) Topoisomerase depletion modifies the genome-wide H3K9ac pattern. The genome-wide correlations between H3K9ac in synchronized cells of the indicated strains. (D) Shift in H3K9ac upon depletion of topoisomerases. Metagene analysis of H3K9ac (as in Fig. 1C) for the indicated strains. (E) Shift in H3K9ac is associated with gene expression levels. Metagene analysis of H3K9ac for genes grouped according to their expression levels (as in Fig. 5B). Expression levels as measured in the relevant strain at the synchronized time-point. Correlation values (ρ) between gene average H3K9ac and gene expression levels are indicated. (F) H3K9ac colocalizes with RNA pol II. Peaks in H3K9ac were identified, the respective regions were aligned by the maximal H3K9ac signal, and the average RNA pol II measured over the aligned regions was plotted.

References

    1. Alabert C, Barth TK, Reverón-Gómez N, Sidoli S, Schmidt A, Jensen ON, Imhof A, Groth A. 2015. Two distinct modes for propagation of histone PTMs across the cell cycle. Genes Dev 29: 585–590. - PMC - PubMed
    1. Annunziato AT. 2005. Split decision: What happens to nucleosomes during DNA replication? J Biol Chem 280: 12065–12068. - PubMed
    1. Bannister AJ, Kouzarides T. 2011. Regulation of chromatin by histone modifications. Cell Res 21: 381–395. - PMC - PubMed
    1. Baxter J, Diffley JFX. 2008. Topoisomerase II inactivation prevents the completion of DNA replication in budding yeast. Mol Cell 30: 790–802. - PubMed
    1. Benson LJ, Gu Y, Yakovleva T, Tong K, Barrows C, Strack CL, Cook RG, Mizzen CA, Annunziato AT. 2006. Modifications of H3 and H4 during chromatin replication, nucleosome assembly, and histone exchange. J Biol Chem 281: 9287–9296. - PubMed

Publication types

MeSH terms