. 2016 Jul;171(3):1704-19.
doi: 10.1104/pp.16.00359. Epub 2016 May 25.

Lack of GLYCOLATE OXIDASE1, but Not GLYCOLATE OXIDASE2, Attenuates the Photorespiratory Phenotype of CATALASE2-Deficient Arabidopsis

Affiliations

Lack of GLYCOLATE OXIDASE1, but Not GLYCOLATE OXIDASE2, Attenuates the Photorespiratory Phenotype of CATALASE2-Deficient Arabidopsis

Pavel Kerchev et al. Plant Physiol. 2016 Jul.

Abstract

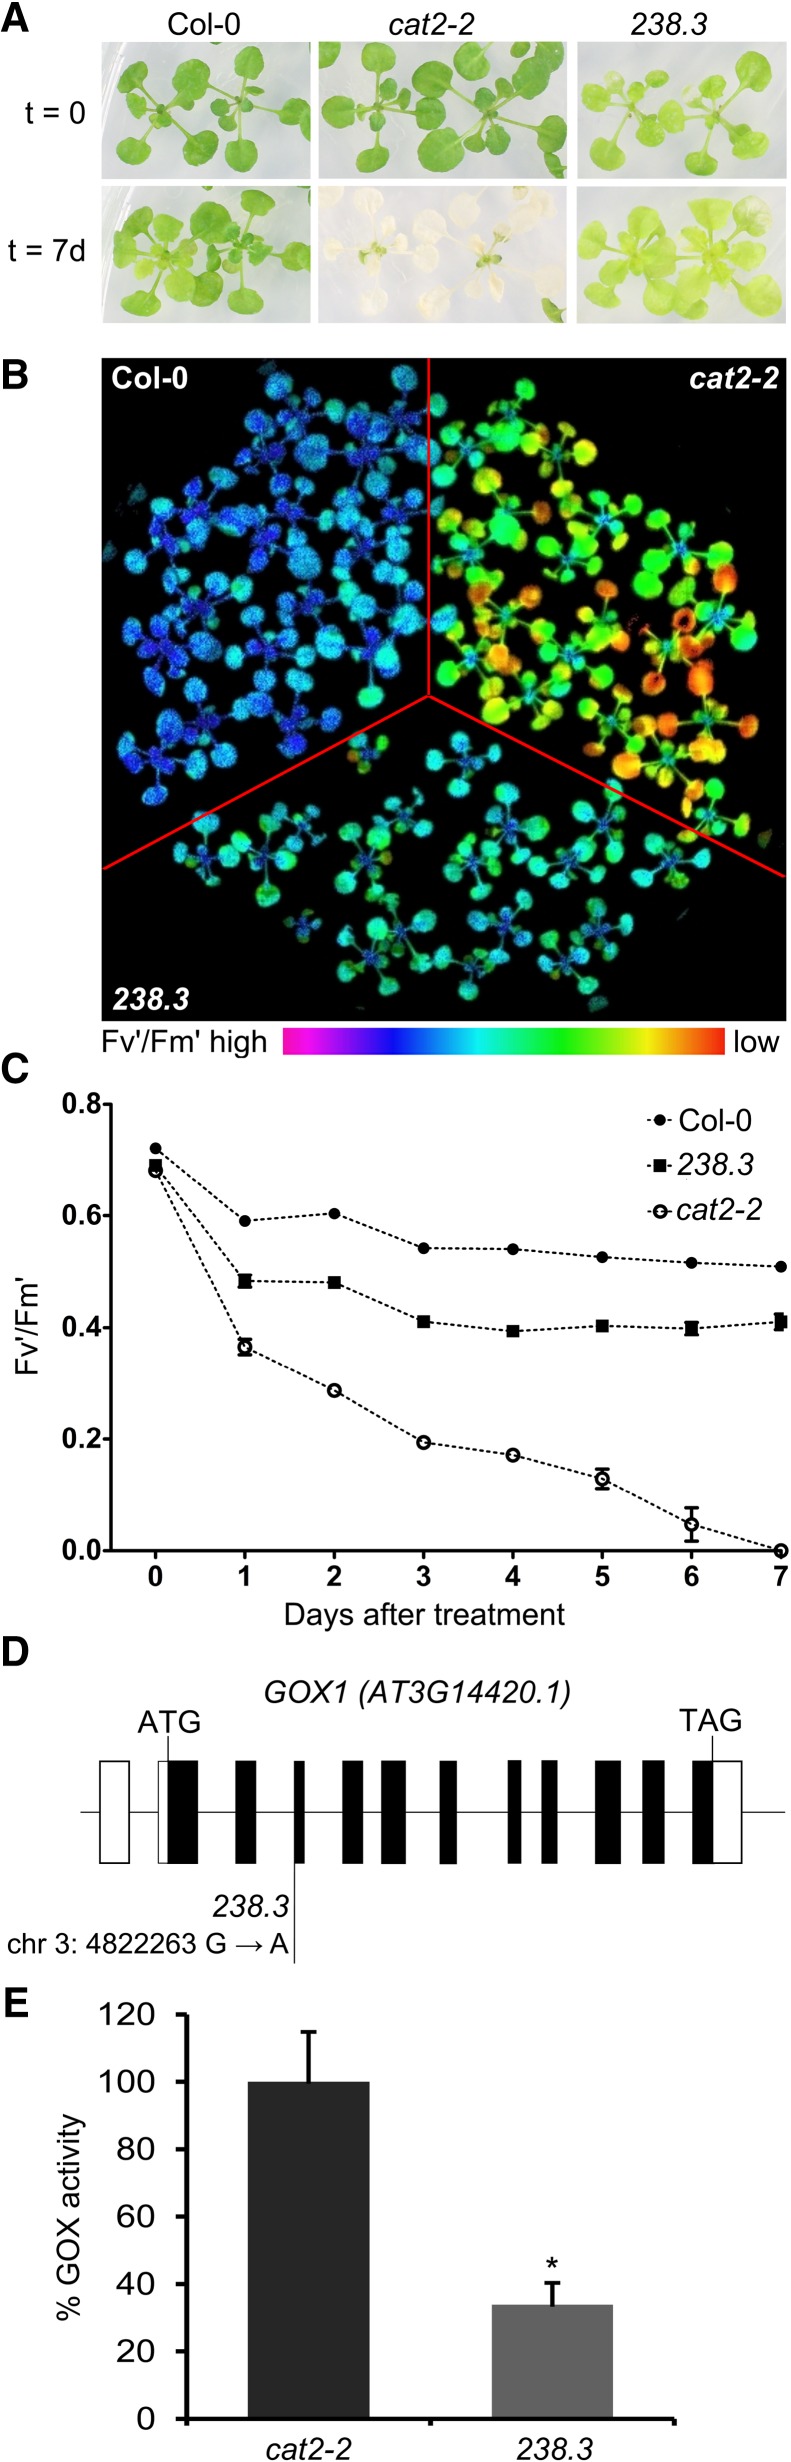
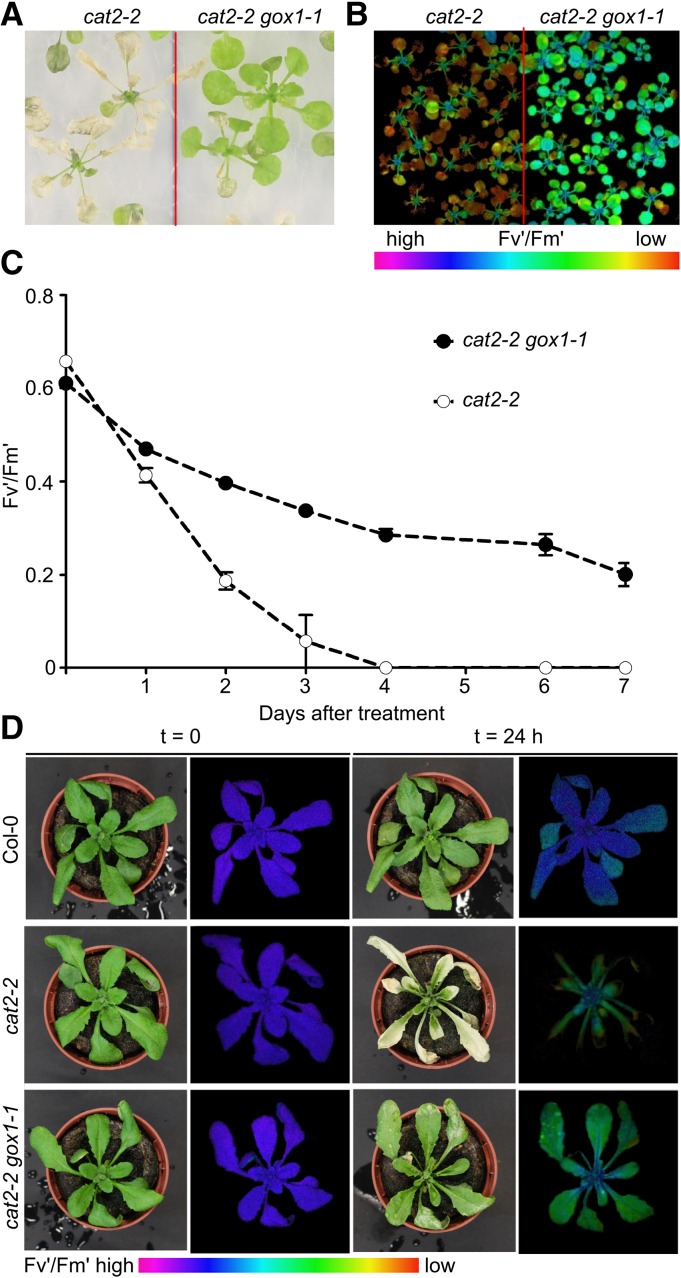
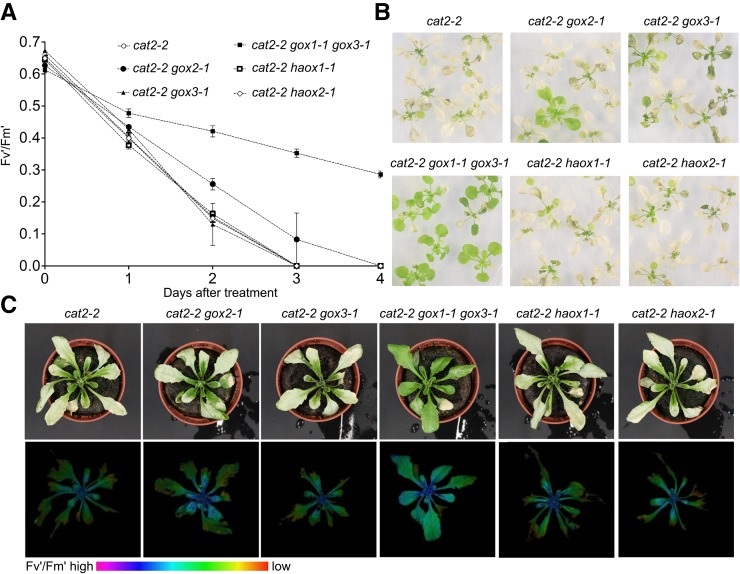
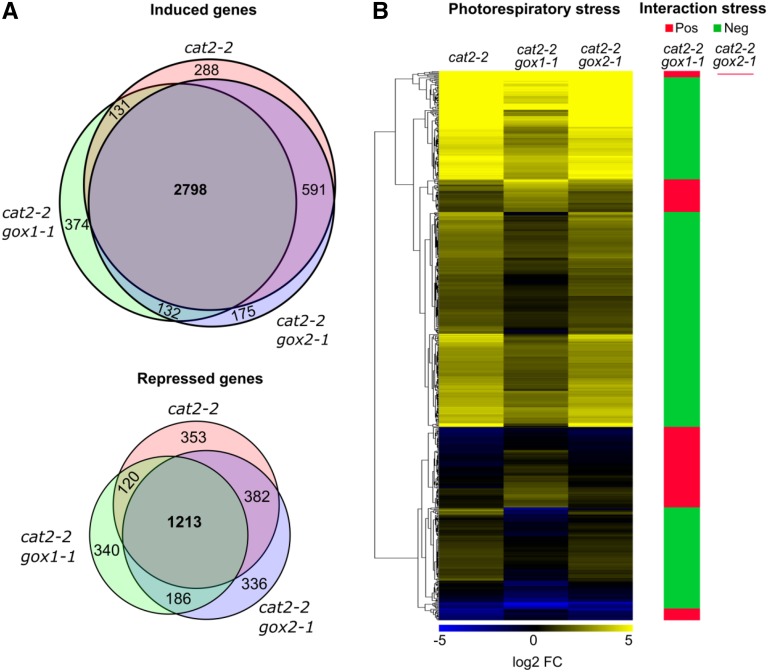
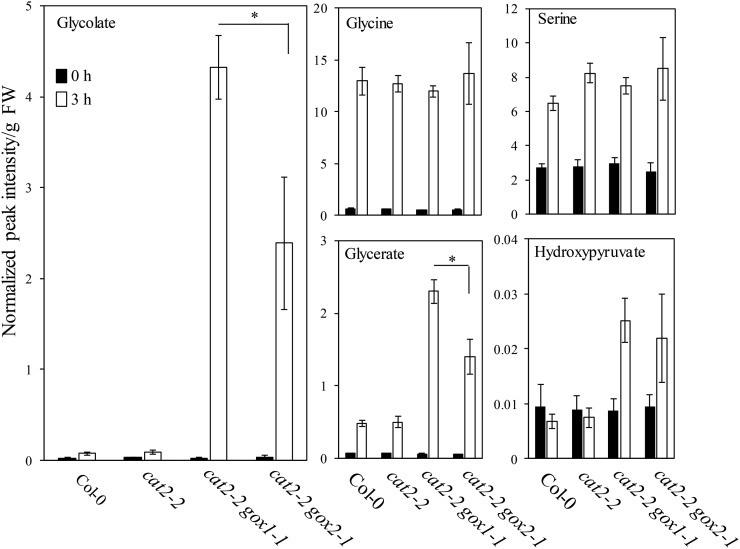
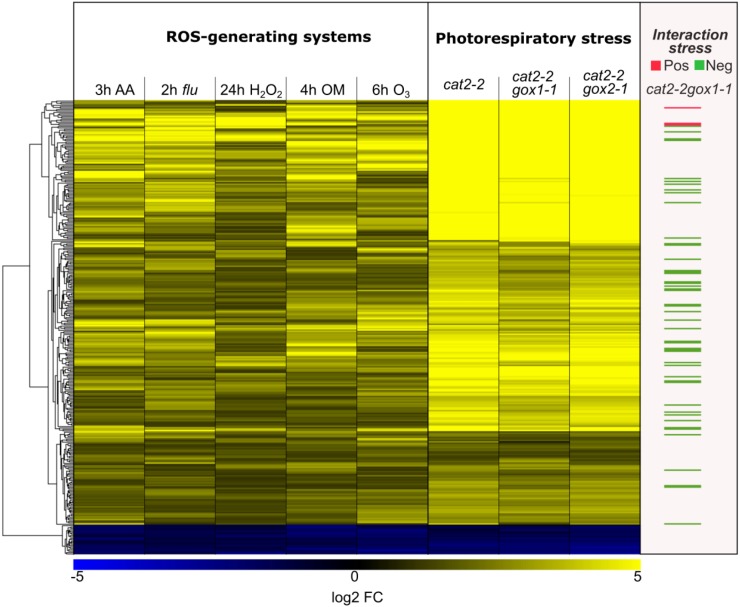
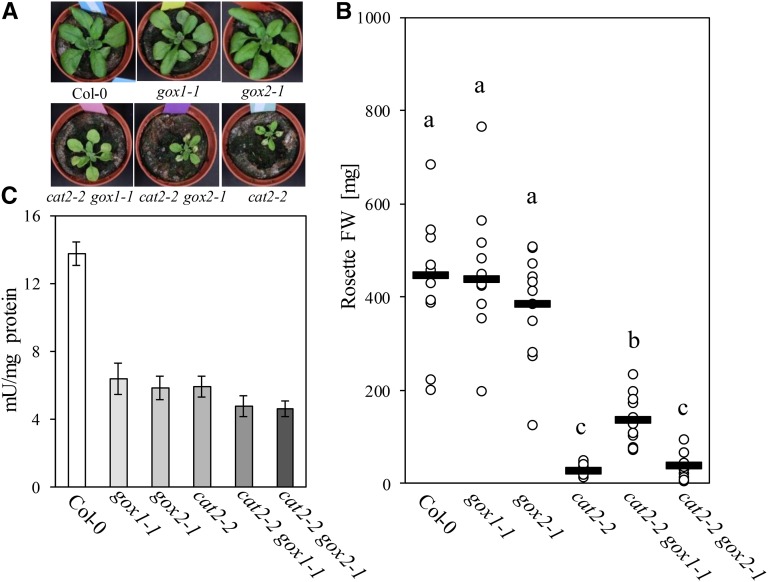
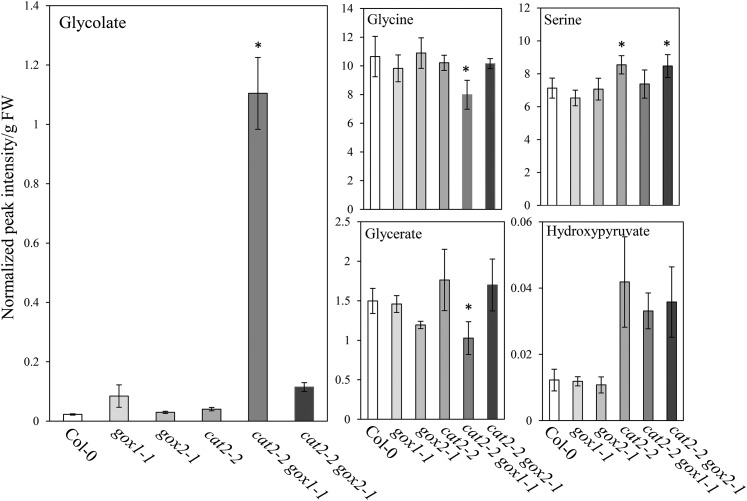
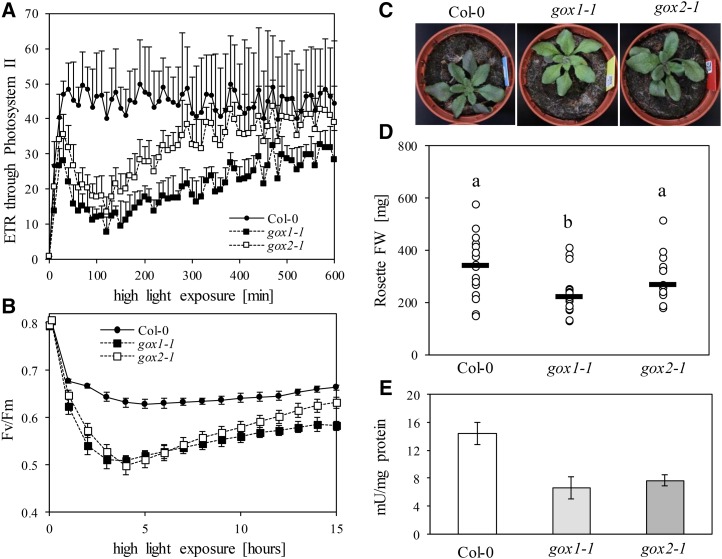
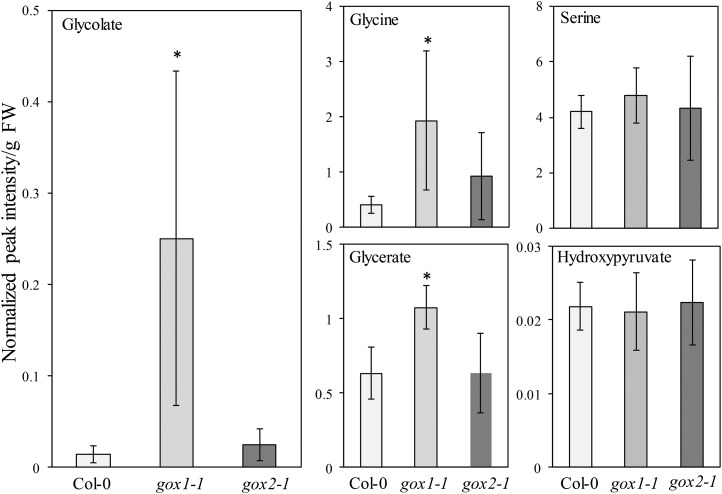
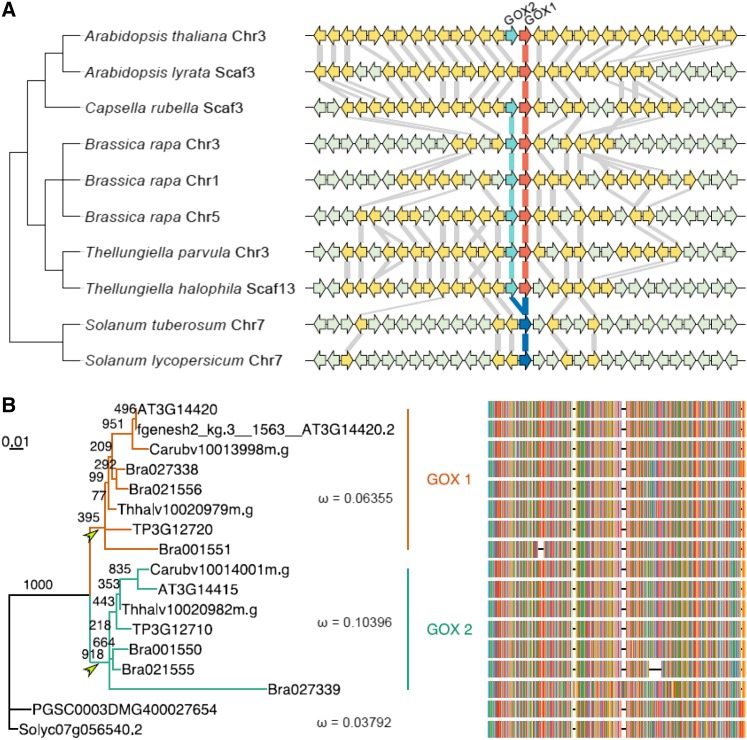
The genes coding for the core metabolic enzymes of the photorespiratory pathway that allows plants with C3-type photosynthesis to survive in an oxygen-rich atmosphere, have been largely discovered in genetic screens aimed to isolate mutants that are unviable under ambient air. As an exception, glycolate oxidase (GOX) mutants with a photorespiratory phenotype have not been described yet in C3 species. Using Arabidopsis (Arabidopsis thaliana) mutants lacking the peroxisomal CATALASE2 (cat2-2) that display stunted growth and cell death lesions under ambient air, we isolated a second-site loss-of-function mutation in GLYCOLATE OXIDASE1 (GOX1) that attenuated the photorespiratory phenotype of cat2-2 Interestingly, knocking out the nearly identical GOX2 in the cat2-2 background did not affect the photorespiratory phenotype, indicating that GOX1 and GOX2 play distinct metabolic roles. We further investigated their individual functions in single gox1-1 and gox2-1 mutants and revealed that their phenotypes can be modulated by environmental conditions that increase the metabolic flux through the photorespiratory pathway. High light negatively affected the photosynthetic performance and growth of both gox1-1 and gox2-1 mutants, but the negative consequences of severe photorespiration were more pronounced in the absence of GOX1, which was accompanied with lesser ability to process glycolate. Taken together, our results point toward divergent functions of the two photorespiratory GOX isoforms in Arabidopsis and contribute to a better understanding of the photorespiratory pathway.


Figures

Figure 1.
Figure 1.
Characterization of line 238.3 that displays attenuated cell death in the absence on peroxisomal catalase under photorespiratory stress. A, Representative bright-field images of 3-week-old Col-0, cat2-2, and 238.3 plants before (top panel) and after 7 d (bottom panel) of photorespiratory stress (restricted gas exchange and continuous light). B, Color-coded image of PSII maximum efficiency (Fv'/Fm') of 3-week-old Col-0, 238.3, and cat2-2 plants exposed to photorespiratory stress for 48 h. C, Fv'/Fm' decrease during the course of the photorespiratory treatment. Data points represent means of three biological replicates ± se. D, GOX1 gene model together with the position of the causative EMS-induced mutation. E, Extractable leaf glycolate oxidase activity from 2-week-old plants grown in vitro expressed as a percentage of the cat2-2 value. Bars represent means of three biological replicates ± se. Asterisks indicate significant differences according to Student’s t test (*P < 0.05).
Figure 2.
Figure 2.
Attenuation of the photorespiratory phenotype of cat2-2 mutants in the absence of GOX1. A, Representative bright-field image of 3-week-old in vitro-grown cat2-2 and cat2-2 gox1-1 mutant plants exposed to photorespiratory stress for 4 d (restricted gas exchange and continuous light). B, Color-coded Fv′/Fm′ images of plants exposed to photorespiratory stress for 48 h. C, PSII maximum efficiency (Fv′/Fm′) decrease in the course of the photorespiratory treatment. Data points represent means of three biological replicates ± se. D, Representative bright-field and color-coded Fv′/Fm′ images of 3-week-old Col-0, cat2-2, and cat2-2 gox1-1 plants grown in soil under high CO2 (3,000 μL L−1) atmosphere and low light (100 μmol m−2 s−1) before (T=0 h) and after (T=24 h) transfer to ambient air and high light (1,000 μmol m−2 s−1).
Figure 3.
Figure 3.
Contribution of (l)-2-hydroxyacid-oxidase family members to the photorespiratory phenotype of cat2-2 mutants. A, Decrease of PSII maximum efficiency (Fv′/Fm′) in 3-week-old in vitro-grown plants during the course of the photorespiratory stress (restricted gas exchange and continuous light). Data points represent means of three biological replicates ± se. B, Representative bright-field images of 3-week-old plants exposed photorespiratory stress for 4 d (restricted gas exchange and continuous light). C, Representative bright-field (top panel) and color-coded Fv′/Fm′ (bottom panel) images of 3-week-old plants grown in soil under high CO2 (3,000 μL L−1) atmosphere and low light (100 μmol m−2 s−1) after transfer to ambient air and high light (1,000 μmol m−2 s−1) for 24 h.
Figure 4.
Figure 4.
Global transcriptome changes triggered by photorespiratory stress in cat2-2, cat2-2 gox1-1, and cat2-2 gox2-1 mutants. Three-week-old plants grown in soil under high CO2 (3,000 μL L−1) atmosphere and low light (100 μmol m−2 s−1) were transferred to ambient air and high light (1,000 μmol m−2 s−1) for 3 h. Genome-wide gene expression levels were quantified in mature rosette leaves before and after exposure to photorespiratory stress using RNA-seq. A, Venn diagrams showing the number of induced (top panel) or repressed (bottom panel) transcripts (|log2 FC| > 1, FDR < 0.01) upon photorespiratory stress. B, Heat map of transcripts that responded significantly (FDR < 0.05) to the photorespiratory stress in a genotype-specific manner according to a two-way ANOVA. Clusters of transcripts with higher or lower expression in the double mutants relative to cat2-2 mutants are marked with red or green, respectively.
Figure 5.
Figure 5.
Changes of photorespiratory intermediates triggered by photorespiratory stress. Three-week-old Col-0, cat2-2, cat2-2 gox1-1, and cat2-2 gox2-1 plants grown in soil under high CO2 (3,000 μL L−1) atmosphere and low light (100 μmol m−2 s−1) were transferred to ambient air and high light (1,000 μmol m−2 s−1) for 3 h. Metabolites were extracted from rosette leaves before (0 h) and after exposure to photorespiratory stress (3 h). Bars represents averages of 5 to 6 replicates ± sd. Data were analyzed with two-way ANOVA using photorespiratory stress (photorespiratory conditions versus control conditions) and genotype as main factors. Asterisks indicate significant differences between genotypes under photorespiratory stress (P < 0.05).
Figure 6.
Figure 6.
Cellular redox homeostasis upon exposure to photorespiratory stress in cat2-2, cat2-2 gox1-1, and cat2-2 gox2-1 mutants. Comparison between the expression patterns of a subset of ROS-responsive genes, obtained by meta-analysis of ROS-generating systems, found in the transcriptome signatures of cat2-2, cat2-2 gox1-1, and cat2-2 gox2-1 mutants. The following experiments were used in the meta-analysis: reillumination of the conditional flu mutant for 2 h after a dark acclimation (2 h flu, GSE10812); treatment of seedlings with oligomycin for 4 h (4 h OM, GSE38965); treatment of seedlings with 50 µM antimycin A for 3 h (3 h AA, GSE41136); exposure of seedlings to ozone for 6 h (6 h O3, E-MEXP-342); treatment of seedlings with 10 mm H2O2 for 24 h (24 h H2O2).
Figure 7.
Figure 7.
Phenotypic characteristics of Col-0, gox1-1, gox2-1, cat2-2, cat2-2 gox1-1, and cat2-2 gox2-1 plants grown under moderate light intensity (300 µmol m−2 s−1). A, Representative bright-field images of 3-week-old plants. B, Rosette fresh weight (FW) of 3-week-old plants. Black lines represent medians from at least 10 replicates and dots individual measurements. Different letters denote homogenous subsets according to a one-way ANOVA with Tukey post hoc test. C, Extractable leaf GOX activity from 3-week-old plants. Bars represent averages from three biological replicates ± sd.
Figure 8.
Figure 8.
Levels of photorespiratory intermediates in rosettes of Col-0, gox1-1, gox2-1, cat2-2, cat2-2 gox1-1, and cat2-2 gox2-1 plants grown under moderate light intensity (300 µmol m−2 s−1). Bars represents averages of 5 to 6 replicates ± sd. Asterisks indicate significant differences (P < 0.05) in comparison to Col-0 according to one-way ANOVA and Tukey post hoc test.
Figure 9.
Figure 9.
Phenotypic characteristics of Col-0, gox1-1, and gox2-1 single mutants under high light. A and B, Changes in photosynthetic electron transfer reactions after shift from a nonphotorespiratory growth environment to high light. Changes in apparent ETR through PSII (A) and maximal quantum yield of PSII (Fv/Fm; B) are plotted against the incubation time under high light. C, Representative bright-field images of 3-week-old plants grown under high light intensities (1,000 µmol m−2 s−1). D, Rosette biomass of 3-week-old plants grown under high light intensities (1,000 µmol m−2 s−1). Black lines represent medians from at least 15 replicates and dots individual measurements. Different letters denote statistical differences according to a one-way ANOVA with Tukey post hoc test. E, Extractable leaf GOX activity from 3-week-old plants grown under high light intensities (1000 µmol m−2 s−1). Bars represent averages from three biological replicates ± sd.
Figure 10.
Figure 10.
Levels of photorespiratory intermediates in rosettes of 3-week-old Col-0, gox1-1, and gox2-1 plants grown under high light intensity (1,000 µmol m−2 s−1). Bars represent averages of 5 to 6 replicates ± sd. Asterisks indicate significant difference (P < 0.05) in comparison to Col-0 according to one-way ANOVA with Tukey post hoc test.
Figure 11.
Figure 11.
Evolutionary analysis of GOX1 and GOX2. A, Conserved synteny surrounding GOX1 and GOX2 as retrieved from Genomicus (v16.03) and visualized with genoPlotR. Arrowed blocks indicate genes, with yellow and gray denoting homologous and nonhomologous genes to Arabidopsis, respectively. Red and green arrows indicate GOX1 and GOX2 in Brassicaceae, respectively, and blue arrows are GOX genes in Solanaceae. Gray lines connect homologous genes between neighbors in the tree. Chromosome or scaffold numbers on which the conserved synteny blocks were found are also indicated. B, Unrooted maximum likelihood tree and multiple sequence alignment for GOX genes. The numbers along branches show bootstrap support. Green and red indicate the GOX1 and GOX2 clade, respectively. Two arrowheads denote two postduplication branches. ω is the ratio of the nonsynonymous substitution rate over the synonymous substitution rate for the indicated clades as calculated with PAML under a three-ratio model.

References

    1. Abat JK, Mattoo AK, Deswal R (2008) S-nitrosylated proteins of a medicinal CAM plant Kalanchoe pinnata- ribulose-1,5-bisphosphate carboxylase/oxygenase activity targeted for inhibition. FEBS J 275: 2862–2872 - PubMed
    1. Bailey CD, Koch MA, Mayer M, Mummenhoff K, O’Kane SL Jr., Warwick SI, Windham MD, Al-Shehbaz IA (2006) Toward a global phylogeny of the Brassicaceae. Mol Biol Evol 23: 2142–2160 - PubMed
    1. Bauwe H, Hagemann M, Kern R, Timm S (2012) Photorespiration has a dual origin and manifold links to central metabolism. Curr Opin Plant Biol 15: 269–275 - PubMed
    1. Birney E, Clamp M, Durbin R (2004) GeneWise and Genomewise. Genome Res 14: 988–995 - PMC - PubMed
    1. Bradford MM. (1976) A rapid and sensitive method for the quantitation of microgram quantities of protein utilizing the principle of protein-dye binding. Anal Biochem 72: 248–254 - PubMed

Publication types