Structural evidence for Nap1-dependent H2A-H2B deposition and nucleosome assembly
- PMID: 27225933
- PMCID: PMC4931181
- DOI: 10.15252/embj.201694105
Structural evidence for Nap1-dependent H2A-H2B deposition and nucleosome assembly
Abstract
Nap1 is a histone chaperone involved in the nuclear import of H2A-H2B and nucleosome assembly. Here, we report the crystal structure of Nap1 bound to H2A-H2B together with in vitro and in vivo functional studies that elucidate the principles underlying Nap1-mediated H2A-H2B chaperoning and nucleosome assembly. A Nap1 dimer provides an acidic binding surface and asymmetrically engages a single H2A-H2B heterodimer. Oligomerization of the Nap1-H2A-H2B complex results in burial of surfaces required for deposition of H2A-H2B into nucleosomes. Chromatin immunoprecipitation-exonuclease (ChIP-exo) analysis shows that Nap1 is required for H2A-H2B deposition across the genome. Mutants that interfere with Nap1 oligomerization exhibit severe nucleosome assembly defects showing that oligomerization is essential for the chaperone function. These findings establish the molecular basis for Nap1-mediated H2A-H2B deposition and nucleosome assembly.
Keywords: H2A–H2B; Nap1; chromatin; histone chaperone; nucleosome assembly.
© 2016 The Authors. Published under the terms of the CC BY NC ND 4.0 license.
Figures

Analysis of MNase‐digested chromatin DNA fragments from wild‐type (WT, sizes indicated in black) and nap1Δ (N, sizes indicated in red) cells by agarose gel electrophoresis. Diagram illustrating reduction in array length in nap1Δ cells.
Frequency distribution of nucleosomal DNA size (WT in gray fill with nap1Δ in blue traces) from H3 ChIP‐seq.
Calculation of nucleosome fuzziness as the standard deviation of nucleosome (or tag) positions. See also Appendix Fig S1.
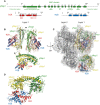
Domain architecture of yNap1, H2A, and H2B. The
H istoneb indingr egion (HBR1 and HBR2) of yNap1 and the yN ap1b indingr egion (NBR1 and NBR2) of H2A are indicated. Regions involved in higher‐order oligomerization are shown (IF1 and IF2).Ribbon view of the asymmetric crystallographic unit containing a (yNap1c2–H2AΔ14–H2BΔ28)6 assembly. For clarity, only layer 1 of the complex is shown. Layer 1 contains three protomers A–C that are related by two perpendicular non‐crystallographic dyads (
 ).
).Side view of the complex. The layer 2 omitted from panel (B) is shown in gray. The yNap1 dimer is shown in green and yellow, H2A in red, and H2B in blue. See also Fig EV1.
View of the yNap1–H2A–H2B protomer complex with labeling of secondary structure elements.
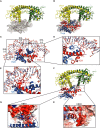
- A, B
2F0–Fc omit electron density map for the region comprising H2A–H2B contoured at 1σ in absence (A) or presence (B) of H2A/H2B in ribbon representation. Similar views as in Fig 2A–C are shown.
- C–E
DNA binding of the H2A–H2B heterodimer.
- F
View of the ternary complex with H2A–H2B in ribbon representation. APBS‐calculated electrostatics (−7 kT to +7 kT) were mapped onto yNap1 dimer surface.
- G
HBR1.
- H
HBR2.

Overview of the yNap1c2–H2AΔ14–H2BΔ28 complex.
Residues R17, R20, R29, R32, R35, and K36 of H2A make contacts with the acidic HBR1 in yNap1 comprising residues D201, D205, and E310.
Residues K75, R77, and R81 of H2A make polar contacts with the HBR2 comprising residues E332, D333, and E339 in α8 of yNap1.
In vitro GST‐pulldown assay showing the role of residues in the HBR interfaces in H2A–H2B binding. The mutant‐labeled HBR1 (lane 6) contains the triple mutation D201R, D205R, and E310R, and HBR2 (lane 12), the triple mutations E332, D333, and E336. HBR1 + 2 (lane 13) contains all six mutations. The mutant‐labeled HBR1 + 2A (lane 14) has alanine replacements in the six HBR residues. Top panel: Bound. Bottom panel: Input.
Disruption of the Nap1–histone interaction by H2A mutation. Bottom panel: Inputs of the coexpressed proteins (soluble extract) and top panel the material bound to the glutathione affinity column were analyzed by SDS–PAGE and Coomassie staining.
Controls showing input (bottom) and bound (top) fractions. See also Fig EV2.
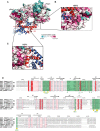
The yNap1 dimer is color‐coded according to the sequence conservation.
HBR2.
HBR1. The higher the conservation, the darker the color. Similar views as in Fig 3A–C are shown.
Nap1‐like histone chaperons with highlighted conserved residues. Secondary structure elements are shown above the amino acid sequences. The histone binding region 1 or 2 (HBR1 or HBR2) as well as the oligomerization interface (IF1) of yNap1 are highlighted in green. Key residues in the HBR1 and HBR2 (●) as well as IF1 (▵) are indicated. The structure‐based sequence alignment was performed using Pymol (Schrodinger, 2010) and ClustalW (Thompson et al, 1994). The figure was generated using Espript (Gouet et al, 2003).
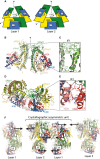
Cartoon illustrating the arrangement of the two layers of the yNap1c2–H2A–H2B oligomer.
A ribbon view of the protomers B and C comprising the IF1 interface.
Close‐up view of interactions in the IF1 oligomerization interface.
Ribbon view of protomers A and A' comprising the interlayer oligomerization interface IF2.
Close‐up view of interactions in the IF2 interface.
Crystal packing interactions. To illustrate packing, the two layers were moved apart. Packing of the two layers in the crystallographic asymmetric unit is stabilized by two interlayer IF2 interfaces (indicated by two arrows facing each other) between protomers A–A' and B–B'. The IF2 interface between protomers C provides for packing to the neighboring unit cells. H2A is colored in red, H2B in blue, and yNap1 in green and yellow. See also Fig EV3.
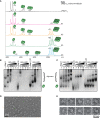
- A
Native mass spectra of yNap1c against varying concentrations of H2AΔ14–H2BΔ28.
- B
Native PAGE assay of yNap1 binding to H2A–H2B (lanes 1–5), yNap1c binding to H2A–H2B (lanes 6–10), or of yNap1_IF1 to H2A–H2B (lanes 11–15).
- C
Native PAGE assay of H2AΔ14_IF2–H2BΔ28 binding to yNap1 (lanes 1–5) or yNap1c (lanes 6–10) or yNap1_IF1 (lanes 11–15). Samples were separated by 6% native PAGE and visualized by Coomassie staining.
- D, E
EM analysis of the full‐length yNap1–H2A–H2B complex.
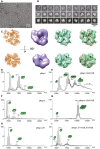
- A
EM analysis of the yNap1c2–H2AΔ14–H2BΔ28 complex. Representative raw image of negatively stained particles.
- B
Representative particles (1st row), class averages coming from the projection matching procedure (2nd row) and comparison of the class averages with projections from a final model generated after four projection matching cycles (3rd row).
- C
From left to right: Crystal structure of the (yNap1c2–H2A–H2B)6 complex in two different orientations (brown); 60 Å‐filtered structure of the complex (magenta); 3D reconstruction of the complex from negatively stained particles (green) and fit of the crystal structure into the EM map.
- D–I
Mass spectra of yNap1 variants in the absence and presence of H2A–H2B. yNap1 in complex in the absence (D) or presence of H2A–H2B (E). yNap1c in the absence (F) or bound to H2A–H2B (G). The oligomerization mutant yNap1_IF1 alone (H) or in complex with H2A_IF2Δ14–H2BΔ28 (I). yNap1 is shown in green circles and H2A–H2B as red and blue asterisks.
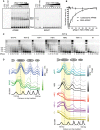
Native PAGE gel showing the result of an affinity shift assay scanned to detect AF488‐ (left) or AF647‐labeled DNA (right); 31 nM–4 μM of yNap1–H2A–H2B (lanes 6–13) was incubated with a mixture of 0.8 μM AF488‐labeled H3–H4–DNA tetrasome complexes and 0.8 μM AF647‐labeled DNA (lane 5). Lanes 1–3 show migration of tetrasomes (tetra), nucleosomes (nucl), or free H2A–H2B obtained by salt deposition onto AF647‐labeled DNA.
Intensity of the nucleosome band (nucl) is plotted. The value at 4 μM of yNap1–H2A–H2B (lane 13) was set to 100%. For non‐specific DNA binding, the value in the absence of H2A–H2B (lane 5) was set to 100% intensity and disappearance of the free DNA AF647 band was plotted. Each curve is representative of three independent experiments performed on different days. Standard deviations are shown.
Analysis of MNase‐digested chromatin DNA fragments from wild‐type (BY4741), nap1Δ, and nap1Δ cells complemented with different yNap1 expression plasmids. Total MNase units per 50 ml of culture are indicated on the bottom of the lanes. Kb+: DNA marker.
Positional representation of MNase‐titrated nucleosomal arrays from panel (C), comparing with BY4741 (blue traces) with NAP1 deletion (green traces) and other mutants (HBR1—black, HBR2—red, HBR1 + 2—purple, and IF1—gold traces). Color gradients indicate MNase concentrations (from high to low), and the yellow box represents mononucleosomes. Dashed lines represent nucleosome dyad with respect to BY4741 (WT). Traces are offset vertically for ease of visibility. See also Fig EV4I.

- A
Native PAGE gel showing the result of a multiple fluorescence relative affinity shift assay in the absence of yNap1; 31 nM–8 μM H2A–H2B (lanes 4–12) were incubated with a mixture of 0.7 μM AF488‐labeled H3–H4–DNA tetrasome complexes and 0.7 μM AF647‐labeled DNA. The gel was scanned to detect AF488‐ (left) or AF647‐labeled DNA (right). Lane 1 shows migration of tetrasomes (tetra). Appearance of nucleosomes (nucl) is indicated.
- B
To quantify nucleosome assembly, the intensity of the band (nucl) was plotted as a function of H2A–H2B concentration. To measure non‐specific DNA binding, the disappearance of the free DNA AF647 band was plotted. The value in the absence of H2A–H2B (lane 1) was set to 100% intensity. The curve is representative of three independent experiments performed on different days. Standard deviations are indicated.
- C, D
Same experiment as in (A) for the yNap1_IF1–H2A–H2B and for the yNap1c–H2A–H2B.
- E
Nucleosome assembly rescue assay. Increasing amounts 1 μM–4 μM H2A–H2B were added to 0.7 μM AF488‐labeled H3–H4–DNA tetrasome complexes (lane 1) and resulted in non‐specific aggregation at 2–4 μM H2A–H2B (lanes 2–4). Incubation of 4 μM H2A–H2B with increasing amounts 0.31 μM–5 μM of yNap1 (lanes 5–9) resulted in a rescue of nucleosome assembly and prevented non‐specific DNA binding of H2A–H2B. The yNap1_HBR1 + 2 (lanes 10–14) show a defect in this rescue assay.
- F
Same experiment as in (E) for the yNap1_HBR1 (lanes 5–9) and yNap1_HBR2 (lanes 10–14).
- G
Same experiment as in (E) for the yNap1c (lanes 5–9) and yNap1_IF1 (lanes 10–14).
- H
Quantification of the “rescue” activity of yNap1 variants. Each data point is the mean of three independent measurements. The error bar indicates the standard deviation of the data.
- I
To show the composition of the salt assembled tetrasome and nucleosome preparations, the same sample was run on a native and SDS–PAGE gel.
- J
Expression controls for yNap1 mutants. Nap1 pool in BY4741, Nap1Δ, and Nap1 mutants compared with TBP (TATA binding protein) as loading control.

References
MeSH terms
Substances
Grants and funding
LinkOut - more resources
Full Text Sources
Other Literature Sources

