

The time-of-day of myocardial infarction onset affects healing through oscillations in cardiac neutrophil recruitment
- PMID: 27226028
- PMCID: PMC4967945
- DOI: 10.15252/emmm.201506083
The time-of-day of myocardial infarction onset affects healing through oscillations in cardiac neutrophil recruitment
Abstract
Myocardial infarction (MI) is the leading cause of death in Western countries. Epidemiological studies show acute MI to be more prevalent in the morning and to be associated with a poorer outcome in terms of mortality and recovery. The mechanisms behind this association are not fully understood. Here, we report that circadian oscillations of neutrophil recruitment to the heart determine infarct size, healing, and cardiac function after MI Preferential cardiac neutrophil recruitment during the active phase (Zeitgeber time, ZT13) was paralleled by enhanced myeloid progenitor production, increased circulating numbers of CXCR2(hi) neutrophils as well as upregulated cardiac adhesion molecule and chemokine expression. MI at ZT13 resulted in significantly higher cardiac neutrophil infiltration compared to ZT5, which was inhibited by CXCR2 antagonism or neutrophil-specific CXCR2 knockout. Limiting exaggerated neutrophilic inflammation at this time point significantly reduced the infarct size and improved cardiac function.
Keywords: circadian rhythm; fibrosis; myocardial infarction healing; neutrophils; progenitors.
© 2016 The Authors. Published under the terms of the CC BY 4.0 license.
Figures
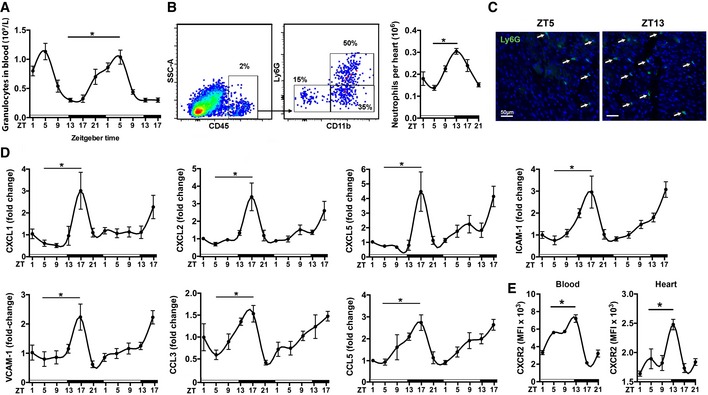
Baseline blood counts of granulocytes. One‐way
ANOVA ; n = 8 mice perZT ; *P = 0.0001ZT 5 versusZT 13.Flow cytometric quantification of neutrophils in digested hearts. The representative dot plots show the gating strategy for cardiac neutrophils (
CD 45+Ly6G+CD 11b+) atZT 5. One‐wayANOVA ; n = 5 mice perZT ; *P = 0.0001ZT 5 versusZT 13.Representative immunostainings for neutrophils in the myocardium (left ventricle), identified as Ly6G positive (20× magnification).
Cardiac
mRNA expression levels normalized toHPRT . One‐wayANOVA ; n = 5 mice perZT ;ZT 5 versusZT 17: *P = 0.0064 (CXCL 1), *P = 0.0007 (CXCL 2), *P = 0.0007 (CXCL 5), *P = 0.0001 (ICAM ‐1), *P = 0.0009 (VCAM ‐1), *P = 0.0181 (CCL 3), *P = 0.0360 (CCL 5).Mean fluorescence intensity (
MFI ) ofCXCR 2 expression by neutrophils in blood and heart. One‐wayANOVA ; n = 3 mice forZT 1,ZT 17,ZT 21 and n = 5 forZT 5,ZT 9,ZT 13;ZT 5 versusZT 13: *P = 0.0425 (blood), *P = 0.0078 (heart).
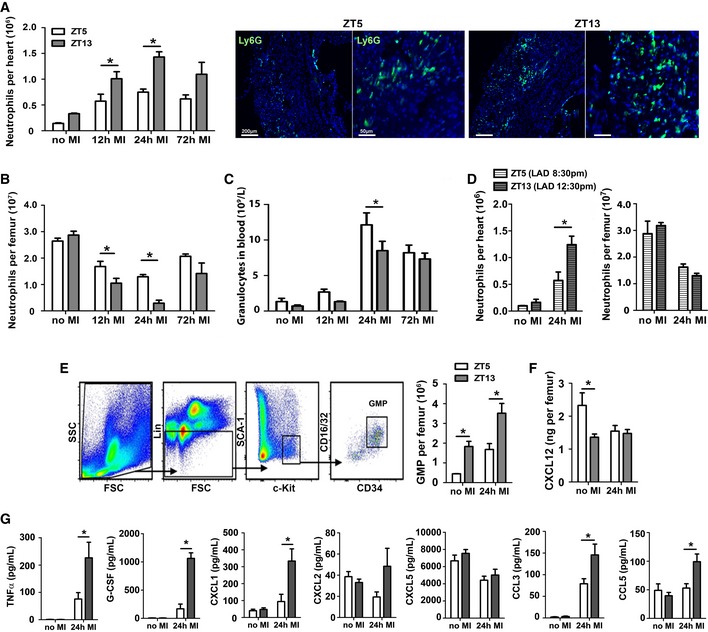
Flow cytometric analysis of neutrophils in hearts and representative immunostainings for neutrophils in the infarct area, identified as Ly6G positive (5× and 20× magnifications). Two‐way
ANOVA followed by Bonferroni post hoc test; n = 5 mice for noMI , n = 5 for 12 h post‐MI , n = 3 for 24 h post‐MI , and n = 3 for 72 h post‐MI in bothZT groups;ZT 5 versusZT 13: *P = 0.0161 (12 hMI ), *P = 0.003 (24 hMI ).Flow cytometric analysis of neutrophils in bone marrow. Two‐way
ANOVA followed by Bonferroni post hoc test; n = 5 mice for noMI , n = 5 for 12 h post‐MI , n = 4 for 24 h post‐MI , and n = 4 for 72 h post‐MI in bothZT groups;ZT 5 versusZT 13: *P = 0.0471 (12 hMI ), *P = 0.0035 (24 hMI ).Blood counts of granulocytes. Two‐way
ANOVA followed by Bonferroni post hoc test; n = 9 mice for noMI , n = 10 for 12 h post‐MI , n = 13 for 24 h post‐MI , and n = 10 for 72 h post‐MI in bothZT groups;ZT 5 versusZT 13: *P = 0.0364 (24 hMI ).Flow cytometric analysis of neutrophils in hearts and bone marrow under inverted light cycle conditions. Two‐way
ANOVA followed by Bonferroni post hoc test; n = 3 mice for noMI in bothZT groups, n = 5 forZT 5 and n = 6 forZT 13 at 24 h post‐MI ;ZT 5 versusZT 13: *P = 0.0147 (24 hMI ).Representative gating strategy for
GMP s in the bone marrow, identified as lineage negative (CD 11b−, Gr1−, B220−,CD 3−, and Ter119−) and Sca‐1−, c‐kit+,CD 16/32+, andCD 34+. Flow cytometric quantification ofGMP in the bone marrow. Two‐wayANOVA followed by Bonferroni post hoc test; n = 4 mice for noMI and 24 h post‐MI in both groups;ZT 5 versusZT 13: *P = 0.0077 (noMI ), *P = 0.0013 (24 hMI ).CXCL 12 levels in bone marrow lavage. Two‐wayANOVA followed by Bonferroni post hoc test; n = 7 mice for noMI and n = 6 for 24 h post‐MI in both groups;ZT 5 versusZT 13: *P = 0.0077 (noMI ), *P = 0.0013 (24 hMI ).Plasma levels of pro‐inflammatory cytokines and chemokines. Two‐way
ANOVA followed by Bonferroni post hoc test; n = 11 mice for noMI in bothZT groups, n = 7 forZT 5 and n = 8 forZT 13 at 24 h post‐MI ;ZT 5 versusZT 13: *P = 0.0271 (CXCL 12, noMI ), *P = 0.0108 (TNF ‐α, 24 hMI ), *P = 0.001 (G‐CSF , 24 hMI ), *P = 0.005 (CXCL 1, 24 hMI ), *P = 0.0005 (CXCL 2, 24 hMI ), *P = 0.0016 (CCL 3 24 hMI ), *P = 0.0144 (CCL 5, 24 hMI ).
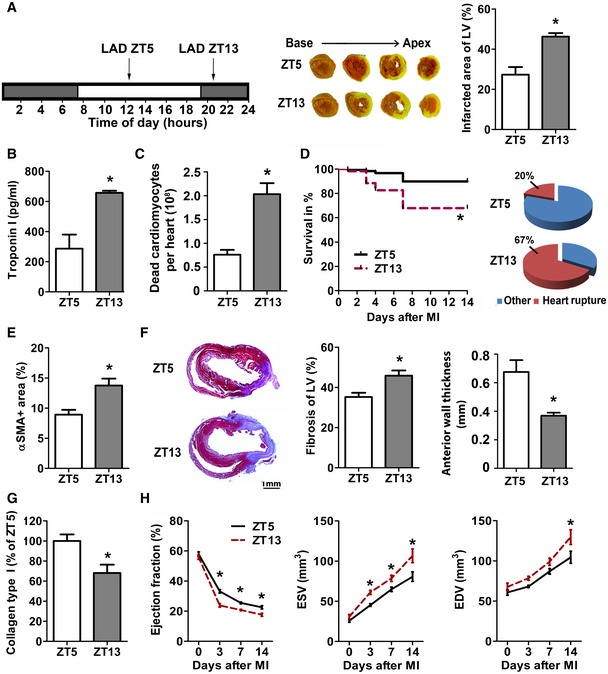
Permanent
LAD occlusion was performed atZT 5 orZT 13.TTC staining (white, infarct; red, vital myocardium) and quantification of infarct size normalized to the left ventricle (LV ). Student's t‐test; n = 4 mice forZT 5 and n = 5 forZT 13MI ; *P = 0.0041.Plasma troponin I levels 24 h after
MI . Student's t‐test; n = 4 mice forZT 5 and n = 5 forZT 13MI ; *P = 0.0007.Flow cytometric analysis of dead cardiomyocytes (
CD 45−, Zombie+) 24 h afterMI . Student's t‐test; n = 3 mice in both groups; *P = 0.0072.Survival rates after
MI and cause of death. Log‐rank test; n = 87 mice in both groups; *P = 0.0006.Myofibroblasts within infarcts were quantified by alpha‐smooth muscle actin (α
SMA ) staining as ratio between stained and total area of random fields. Student's t‐test; n = 4 mice in both groups; *P = 0.0134.Masson's trichome staining of fibrosis (blue, collagen; red, vital myocardium) and quantification relative to total
LV (*P = 0.0095) as well asLV anterior wall thickness (*P = 0.0068) 7 days afterMI . Student's t‐test; n = 6 mice forZT 5 and n = 7 forZT 13MI .Analysis of relative collagen type I content identified by Sirius Red staining 7 days after
MI . Student's t‐test; n = 4 mice forZT 5 and n = 5 forZT 13MI ; *P = 0.0175.Echocardiographic assessment of ejection fraction (
EF ), end‐systolic volume (ESV ), and end‐diastolic volume (EDV ). Two‐wayANOVA ; n = 6 mice for noMI for both groups, n = 6 forZT 5 and n = 9 forZT 13 at 72 h post‐MI , n = 8 for both groups at 7 days post‐MI , and n = 7 forZT 5 and n = 5 forZT 13 at 14 days post‐MI ;ZT 5 versusZT 13: *P = 0.0001 (EF , 3 days), *P = 0.0042 (EF , 7 days), *P = 0.0121 (EF , 14 days); *P = 0.0253 (ESV , 3 days), *P = 0.0421 (ESV , 7 days), *P = 0.0005 (ESV , 14 days); *P = 0.0053 (EDV , 14 days).
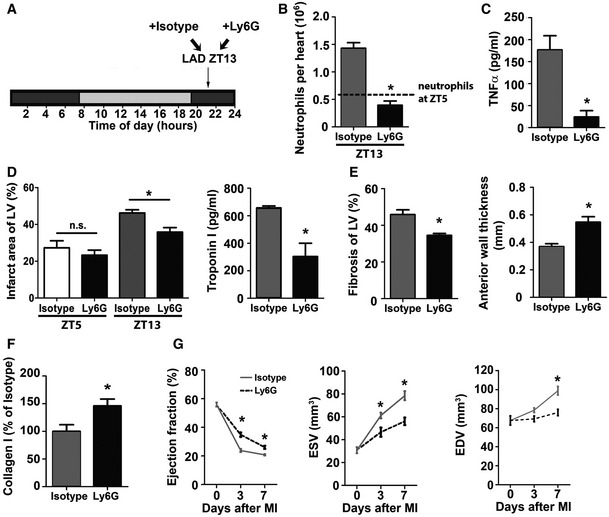
Permanent
LAD occlusion was performed atZT 13 followed by injection of isotype or Ly6G antibody 45 min after surgery and then every 24 h.Flow cytometric analysis of cardiac neutrophils 24 h after
ZT 13MI . The dotted line indicates cardiac neutrophil counts 24 h afterZT 5MI , as shown in Fig 2A. Student's t‐test; n = 3 mice for isotype and n = 5 for Ly6G injected mice; *P = 0.0004.Plasma
TNF ‐α levels 24 h afterZT 13MI . Student's t‐test. n = 8 independent samples for isotype and n = 6 for Ly6G injected mice; *P = 0.0019.Infarct size relative to left ventricular area (
LV ) and plasma troponin I levels 24 h afterZT 5 orZT 13MI . Student's t‐test; for infarct size, n = 3 mice in both groups forZT 5 and n = 4 mice for isotype and n = 3 mice for Ly6G atZT 13; isotype versus Ly6G: *P = 0.0158 (ZT 13). For troponin levels, n = 8 mice for isotype and n = 6 mice for Ly6G withZT 13MI ; *P = 0.0012.Masson's trichrome staining of fibrosis (blue, collagen; red, vital myocardium) and quantification relative to total area of the
LV (*P = 0.0084); morphometric quantification of theLV anterior wall thickness (*P = 0.0027) 7 days afterZT 13MI . Student's t‐test; n = 5 mice for isotype and n = 4 mice for Ly6G.Analysis of collagen type I fibers within infarcts identified by Sirius Red staining 7 days after
ZT 13MI . Student's t‐test; n = 5 mice for isotype and n = 4 mice for Ly6G; *P = 0.0375.Echocardiographic measurement of ejection fraction (
EF ), end‐systolic volume (ESV ) and end‐diastolic volume (EDV ) before and afterZT 13MI . Two‐wayANOVA ; n = 6 mice for noMI in both groups, n = 9 for isotype and n = 5 for Ly6G at 72 h post‐MI , and n = 8 for isotype and n = 4 for Ly6G at 7 days post‐MI . Isotype versus Ly6G: *P = 0.0001 (EF , 3 days), *P = 0.0227 (EF , 7 days);MI *P = 0.0133 (ESV , 3 days), *P = 0.0004 (ESV , 7 days); *P = 0.0017 (EDV , 7 days).
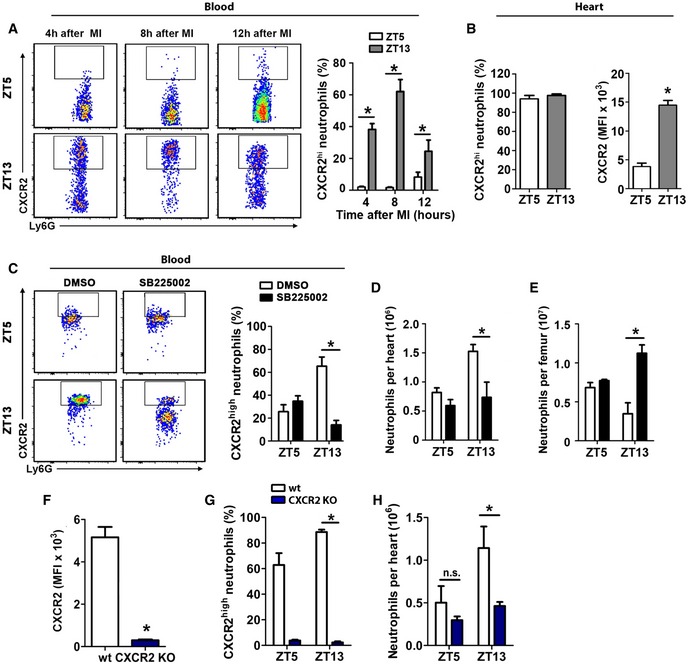
Representative flow cytometric analysis and quantification of
CXCR 2high neutrophils in the blood afterZT 5 andZT 13MI . Two‐wayANOVA followed by Bonferroni post hoc test; n = 4 mice for all time points in both groups;ZT 5 versusZT 13: *P = 0.0001 (4 h), *P = 0.0001 (8 h), *P = 0.0447 (12 h).Percentage and mean fluorescence intensity (
MFI ) ofCXCX 2 expression by cardiac neutrophils 12 h post‐MI afterZT 5 andZT 13MI . Student's t‐test; n = 4 mice in both groups; *P = 0.0001.Percentage of
CXCR 2high neutrophils in the blood 24 h afterZT 5 orZT 13MI in mice receivingCXCR 2 antagonistSB 225002 or vehicle. Two‐wayANOVA followed by Bonferroni post hoc test; n = 4 mice in both groups;DMSO versusSB 225002: *P = 0.0005 (ZT 13).Flow cytometric quantification of neutrophils in hearts 24 h after
ZT 5 orZT 13MI in mice receivingCXCR 2 antagonistSB 225002 or vehicle. Two‐wayANOVA followed by Bonferroni post hoc test; n = 4 mice in both groups;DMSO versusSB 225002: *P = 0.0079 (ZT 13).Flow cytometric quantification of neutrophils in bone marrow 24 h after
ZT 5 orZT 13MI in mice receivingCXCR 2 antagonistSB 225002 or vehicle. Two‐wayANOVA followed by Bonferroni post hoc test; n = 4 mice in both groups;DMSO versusSB 225002: *P = 0.0002 (ZT 13).MFI ofCXCR 2 expression atZT 5 in the blood 24 h afterMI in wild‐type (WT ) andCXCR 2KO mice. Student's t‐test. n = 6 mice in both groups; *P = 0.0001.Percentage of
CXCR 2hi blood neutrophils 24 h afterZT 5 orZT 13MI inWT andCXCR 2KO mice. Two‐wayANOVA followed by Bonferroni post hoc test; forZT 5 n = 6 mice in both groups, forZT 13 n = 7WT mice and n = 5CXCR 2KO mice;WT versusCXCR 2KO : *P = 0.0001 (ZT 13).Flow cytometric quantification of neutrophils in hearts 24 h after
MI inZT 5 andZT 13‐operatedWT andCXCR 2KO mice. Two‐wayANOVA followed by Bonferroni post hoc test; forZT 5 n = 6 mice in both groups, forZT 13 n = 7WT mice and n = 5CXCR 2KO mice;WT versusCXCR 2KO : *P = 0.0461 (ZT 13), ns = not significant.
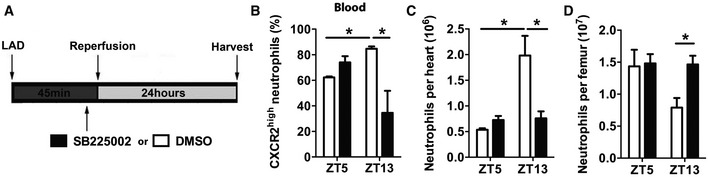
Schematic representation of transient ischemia and reperfusion protocol, performed at
ZT 5 andZT 13. TheCXCR 2 antagonistSB 225002 or vehicle was injected 5 min before reopening theLAD .Percentage of
CXCR 2hi neutrophils in the blood 24 h afterZT 5 orZT 13MI in mice receivingCXCR 2 antagonistSB 225002 or vehicle. Two‐wayANOVA followed by Bonferroni post hoc test; n = 5 mice in both groups atZT 5, n = 5 mice for vehicle, and n = 6 mice forSB 225002 atZT 13;DMSO versusSB 225002: *P = 0.0046 (ZT 13);ZT 5 versusZT 13: *P = 0.0153 (DMSO ).Flow cytometric quantification of cardiac neutrophils 24 h after
ZT 5 orZT 13MI in mice receivingCXCR 2 antagonistSB 225002 or vehicle. Two‐wayANOVA ; n = 5 mice in both groups atZT 5, n = 5 mice for vehicle, and n = 6 mice forSB 225002 atZT 13;DMSO versusSB 225002: *P = 0.0006 (ZT 13);ZT 5 versusZT 13: *P = 0.0001 (DMSO ).Flow cytometric quantification of neutrophils in bone marrow 24 h after
ZT 5 orZT 13MI in mice receivingCXCR 2 antagonistSB 225002 or vehicle. Two‐wayANOVA followed by Bonferroni post hoc test; n = 5 mice in both groups atZT 5, n = 5 mice for vehicle, and n = 6 mice forSB 225002 atZT 13;DMSO versusSB 225002: *P = 0,0486 (ZT 13).
References
-
- Chia S, Nagurney JT, Brown DF, Raffel OC, Bamberg F, Senatore F, Wackers FJ, Jang IK (2009) Association of leukocyte and neutrophil counts with infarct size, left ventricular function and outcomes after percutaneous coronary intervention for ST‐elevation myocardial infarction. Am J Cardiol 103: 333–337 - PubMed
-
- Fournier S, Eeckhout E, Mangiacapra F, Trana C, Lauriers N, Beggah AT, Monney P, Cook S, Bardy D, Vogt P et al (2012) Circadian variations of ischemic burden among patients with myocardial infarction undergoing primary percutaneous coronary intervention. Am Heart J 163: 208–213 - PubMed
Publication types
MeSH terms
Substances
Grants and funding
LinkOut - more resources
Full Text Sources
Other Literature Sources
Medical
