. 2016 Jul 1;143(13):2464-77.
doi: 10.1242/dev.130278. Epub 2016 May 25.

A system for studying mechanisms of neuromuscular junction development and maintenance

Affiliations

A system for studying mechanisms of neuromuscular junction development and maintenance

Valérie Vilmont et al. Development. .

Abstract

The neuromuscular junction (NMJ), a cellular synapse between a motor neuron and a skeletal muscle fiber, enables the translation of chemical cues into physical activity. The development of this special structure has been subject to numerous investigations, but its complexity renders in vivo studies particularly difficult to perform. In vitro modeling of the neuromuscular junction represents a powerful tool to delineate fully the fine tuning of events that lead to subcellular specialization at the pre-synaptic and post-synaptic sites. Here, we describe a novel heterologous co-culture in vitro method using rat spinal cord explants with dorsal root ganglia and murine primary myoblasts to study neuromuscular junctions. This system allows the formation and long-term survival of highly differentiated myofibers, motor neurons, supporting glial cells and functional neuromuscular junctions with post-synaptic specialization. Therefore, fundamental aspects of NMJ formation and maintenance can be studied using the described system, which can be adapted to model multiple NMJ-associated disorders.

Keywords: Co-culture; Differentiation; Myofiber; NMJ.


Conflict of interest statement

Competing interests

The authors declare no competing or financial interests.

Figures

Fig. 1.
Fig. 1.
Timeline for spinal cord explant and murine myofibers co-culture. Days are expressed relative to day of spinal cord explant plating on myotubes. Fixation of co-culture was performed at Day 14 for staining purposes but co-cultures may be maintained for up to 4 weeks with regular medium changes.
Fig. 2.
Fig. 2.
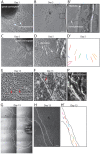
Morphological characterization of co-culture. (A) Day 1. Spinal cord explant showing extensions of nerve processes (arrows) on top of primary myoblasts. (B,B′) Day 3. Nerve processes (arrow) forming contact with myotubes (arrowhead). Boxed area is magnified in B′. (C) Day 5. Nerve processes are longer and extended over large distances away from the spinal cord explant. (D,D′) Day 5. Myotubes are still immature. They do not show peripheral nuclei (inset shows magnification of boxed area). As shown by colored lines highlighting outlines of myofibers in D′, the myofibers do not show alignment. (E) Day 13. Myofibers with peripheral nuclei, a hallmark of differentiation (red arrows). (F,F′) Day 13. Myofibers show peripheral nuclei (red arrow) and multiple contacts with nerve processes (white arrows). Boxed area is magnified in F′. (G) Day 13. Myotubes form bundles around the spinal cord explant. Metamorph software was used to acquire adjacent images with a 4× objective in order to cover a surface of 1.5 cm in height and 1 cm in width. (H,H′) Day 13. Myofibers show bundling and their regular alignment is shown in H′. Aligned myofibers bundle is outlined. Scale bars: 100 µm (A-H).
Fig. 3.
Fig. 3.
Characterization of neuronal populations at Day 14. (A) Representative images of co-culture stained for VaChT (green) and DAPI (blue). (B) Representative image of co-culture stained for ChAT (green) and DAPI (blue). (C) Representative image of co-culture stained for β-III tubulin (TuJ1; green), GFAP (red) and DAPI (blue). (D) Representative image of co-culture stained for β-III tubulin (TuJ1; green), O4 (red) and DAPI (blue). Insets show magnifications of boxed areas. Scale bars: 20 µm.
Fig. 4.
Fig. 4.
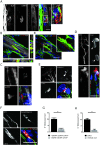
Characterization of myofibers at Day 14. (A) Representative z-projection of differentiated myofiber stained for DHPR (green), RyR (red) and DAPI (blue). (B) Quantification of myofibers with peripheral nuclei in aneural vs neural conditions. Error bars indicate s.e.m.; 67 myofibers in aneural and 87 myofibers in co-culture have been counted in three independent experiments. P-values from Welch's t-test. (C) Quantification of myofibers with transversal triads in aneural versus neural conditions. Error bars indicate s.e.m.; 67 myofibers in aneural and 87 myofibers in co-culture have been counted in three independent experiments. ***P<0.001 (Welch's t-test). (D) Representative z-projection of differentiated myofiber stained for RyR (green), α-actinin (red) and DAPI (blue). (D′) Line scan of boxed region in D showing average intensity of RyR compared with α-actinin. Arrowheads indicate doublets. (E) Representative images of differentiated myofibers in aneural and co-culture conditions. (F) Quantification of myofiber thickness in aneural versus co-culture conditions. Error bars indicate s.e.m.; 44 myofibers in aneural and 40 myofibers in co-culture have been counted in three independent experiments. ****P<0.0001 (Mann–Whitney test). (G) Representative image of myofibers, stained for DHPR or Ryr (gray) and DAPI (blue), grown on Matrigel versus laminin in aneural versus neural conditions. (H) Representative z-projection image of myofiber bundle stained for RyR (green), dystrophin (red) and DAPI (blue) in co-culture conditions. Scale bars: 20 µm.
Fig. 5.
Fig. 5.
Characterization of neuromuscular junction at Day 14. (A) Representative image of co-culture stained for TuJ1 (green), AChRs (α-BTX) (red), RyR (gray) and DAPI (blue). Colocalization of AChR clusters with nerve terminal (boxed area) is magnified. (B) Representative z-projection of a co-culture showing NMJ complexity. Orthogonal view in x-axis and y-axis confirm colocalization of AChR nerve endings. (B′) 3D reconstruction image of the NMJ shown in B without the myofiber, showing interaction between AChR clusters and nerve endings (boxed area magnified in inset). (C) In situ hybridization detects AChRε at NMJ. The presence of AChRε is detected with a red fluorescent probe (marked in green in the figure), presynaptic terminal stained for TuJ1 (gray), post-synaptic terminal for α-BTX (red) and DAPI (blue). (D) Representative image of presynaptic terminal stained for NFH (green), α-BTX (red), Syne-1 (gray) and DAPI (blue). Extrasynaptic nuclei of same fiber indicated by the arrows show decreased Syne-1 expression compared with the synaptic nucleus indicated by the arrowhead. (E) Representative image of co-culture stained for TuJ1 (green), α-BTX (red), synapsin I (gray) and DAPI (blue). (F) Representative image of presynaptic terminal stained for TuJ1 (green), α-BTX (red), synaptotagmin (gray) and DAPI (blue). (G) Quantification of NMJs with or without addition of BDNF, GDNF and CNTF. Error bars indicate s.e.m.; three independent experiments. **P<0.01 (Welch's t-test). (H) Quantification of NMJs in whole spinal cord explants versus ventral root explants. Error bars indicate s.e.m.; three independent experiments. **P<0.01 (Welch's t-test). Scale bars: 10 µm (A,E); 20 µm (B-D,F).
Fig. 6.
Fig. 6.
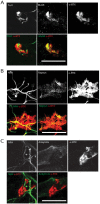
Characterization of post-synaptic specialization at Day 14. (A) Representative z-projection of differentiated myofibers stained for α-BTX (red) and TuJ1 or MuSK (green). (B) Representative z-projection of differentiated myofibers stained for α-BTX (red) and NFH or Rapsyn (green). (C) Representative image of differentiated myofibers stained for α-BTX (red) and NFH or ankyrin G (green). Scale bars: 20 µm.
Fig. 7.
Fig. 7.
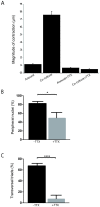
Differences between muscle contraction in aneural versus co-culture conditions. (A) Average amplitude of contraction observed over 80 s (equal to 160 frames) has been calculated for each condition (± TTX). Error bars indicate s.e.m; n=160. (B) Quantification of myofibers with peripheral nuclei with or without addition of TTX at early time points (day 4 until day 14). Error bars indicate s.e.m.; three independent experiments. *P<0.05 (Welch's t-test). (C) Quantification of myofibers with triads with or without addition of TTX at early time points (day 4 until day 14). Error bars indicate s.e.m.; three independent experiments. ****P<0.0001 (Welch's t-test).
Fig. 8.
Fig. 8.
Intracellular recordings of myofiber membrane potential. (A) Lower trace: representative recording of the spontaneous electrical activity found in some myofibers, independently of innervation. Upper trace: enlarged time scale showing the moments preceding the spike. Depolarization to the spike threshold is due to activation of a T-type calcium current (Sciancalepore et al., 2005). (B) Lower trace: membrane potential recording in an innervated and non-spontaneously active myofiber. Arrows mark the occurrence of two sub-threshold postsynaptic potentials (PSPs). Upper trace: enlarged time scale showing the moments preceding the spike and pointing out the PSP triggering the spike. (C) PSPs in two different innervated myofibers (left and right traces, respectively). (D) PSP blockade with 50 µM curare puffed in the recording chamber. Upper traces show the individual PSPs before and after curare application. Sensitivity to curare confirmed the nicotinic nature of these PSPs. (E) Example of a recording showing a combination of spontaneous firing with synaptic-induced spikes. Arrowheads mark the spikes induced by synaptic events. Right traces: enlarged time scale for two spikes induced by PSPs.

Similar articles

Cited by

References

    1. Achtstätter T., Moll R., Anderson A., Kuhn C., Pitz S., Schwechheimer K. and Franke W. W. (1986). Expression of glial filament protein (GFP) in nerve sheaths and non-neural cells re-examined using monoclonal antibodies, with special emphasis on the co-expression of GFP and cytokeratins in epithelial cells of human salivary gland and pleomorphic adenomas. Differentiation 31, 206-227. 10.1111/j.1432-0436.1986.tb00401.x - DOI - PubMed
    1. Apel E. D., Glass D. J., Moscoso L. M., Yancopoulos G. D. and Sanes J. R. (1997). Rapsyn is required for MuSK signaling and recruits synaptic components to a MuSK-containing scaffold. Neuron 18, 623-635. 10.1016/S0896-6273(00)80303-7 - DOI - PubMed
    1. Apel E. D., Lewis R. M., Grady R. M. and Sanes J. R. (2000). Syne-1, a dystrophin- and klarsicht-related protein associated with synaptic nuclei at the neuromuscular junction. J. Biol. Chem. 275, 31986-31995. 10.1074/jbc.M004775200 - DOI - PubMed
    1. Arnold A.-S., Christe M. and Handschin C. (2012). A functional motor unit in the culture dish: co-culture of spinal cord explants and muscle cells. J. Vis. Exp. 62, doi:10.3791/3616 10.3791/3616 - DOI - PMC - PubMed
    1. Askanas V., Kwan H., Alvarez R. B., Engel W. K., Kobayashi T., Martinuzzi A. and Hawkins E. F. (1987). De novo neuromuscular junction formation on human muscle fibres cultured in monolayer and innervated by foetal rat spinal cord: ultrastructural and ultrastructural-cytochemical studies. J. Neurocytol. 16, 523-537. 10.1007/BF01668506 - DOI - PubMed

Publication types