. 2016;17(1):19-34.
doi: 10.3727/105221616X691631. Epub 2016 May 24.

Thyroid Hormone Receptor β Agonist Induces β-Catenin-Dependent Hepatocyte Proliferation in Mice: Implications in Hepatic Regeneration

Affiliations

Thyroid Hormone Receptor β Agonist Induces β-Catenin-Dependent Hepatocyte Proliferation in Mice: Implications in Hepatic Regeneration

Tamara Feliciano Alvarado et al. Gene Expr. 2016.

Abstract

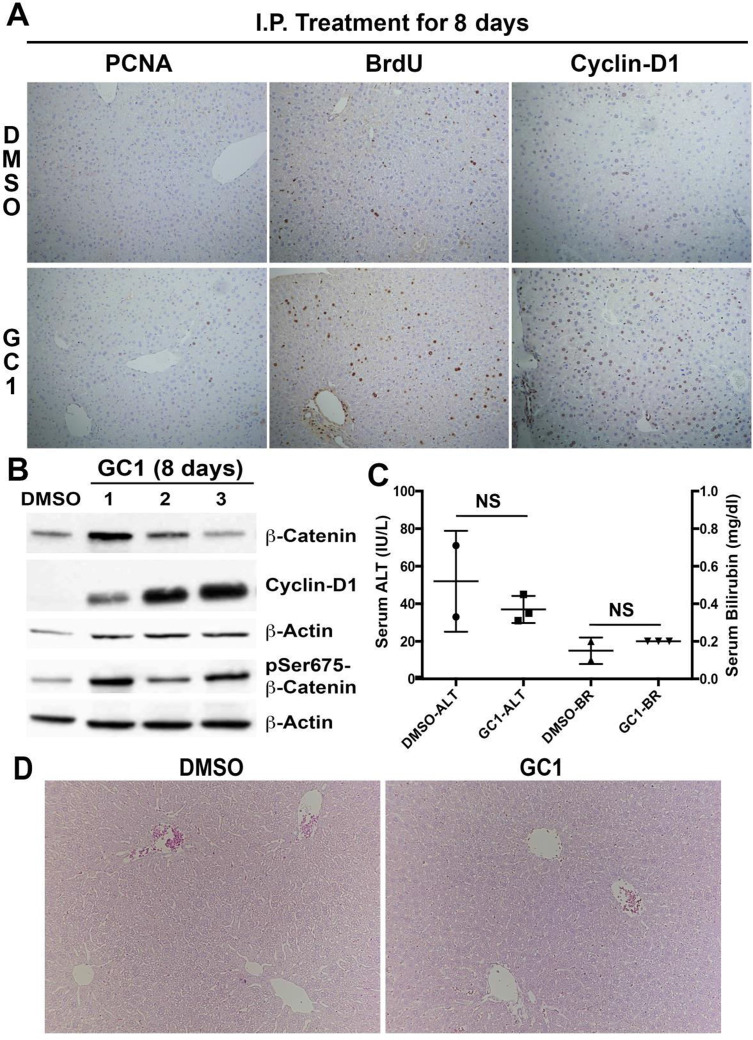
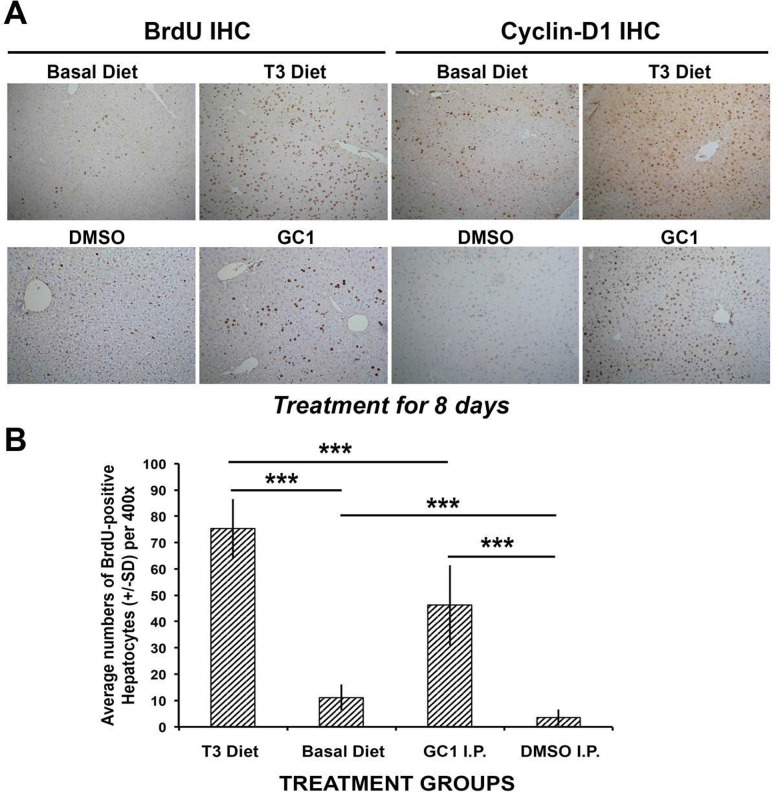
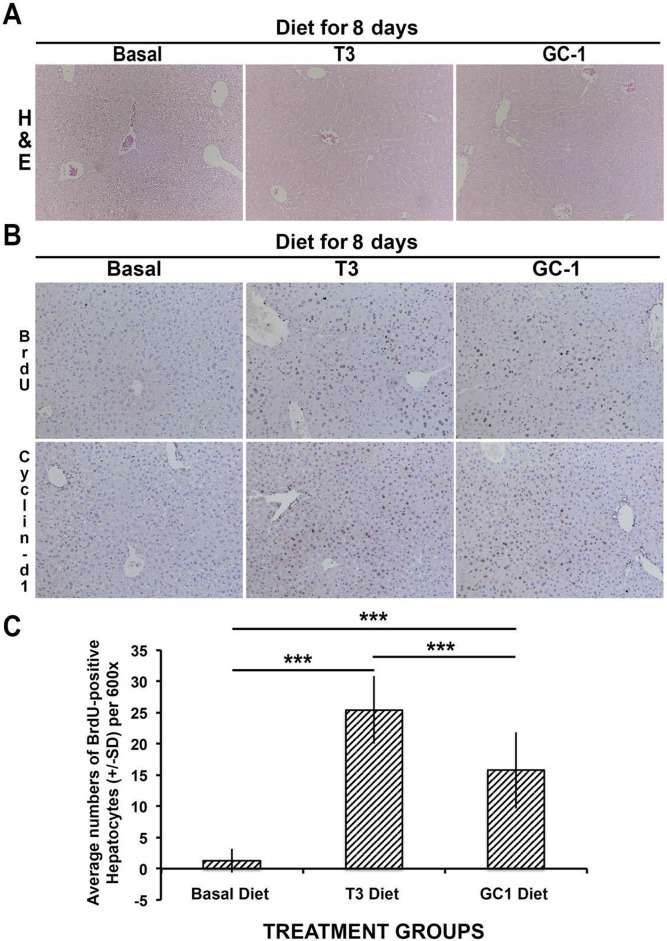
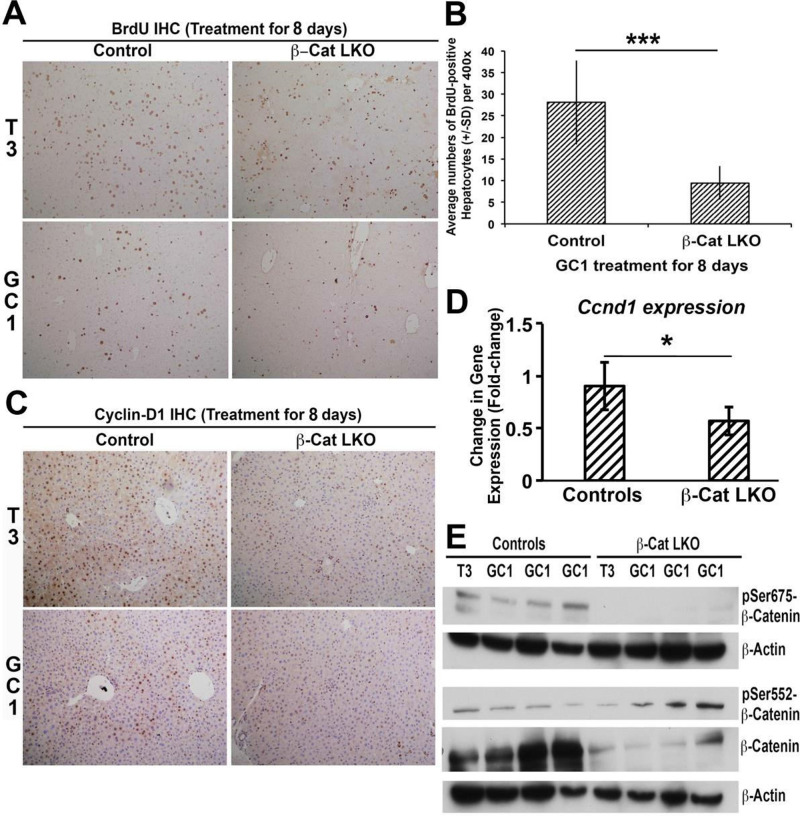
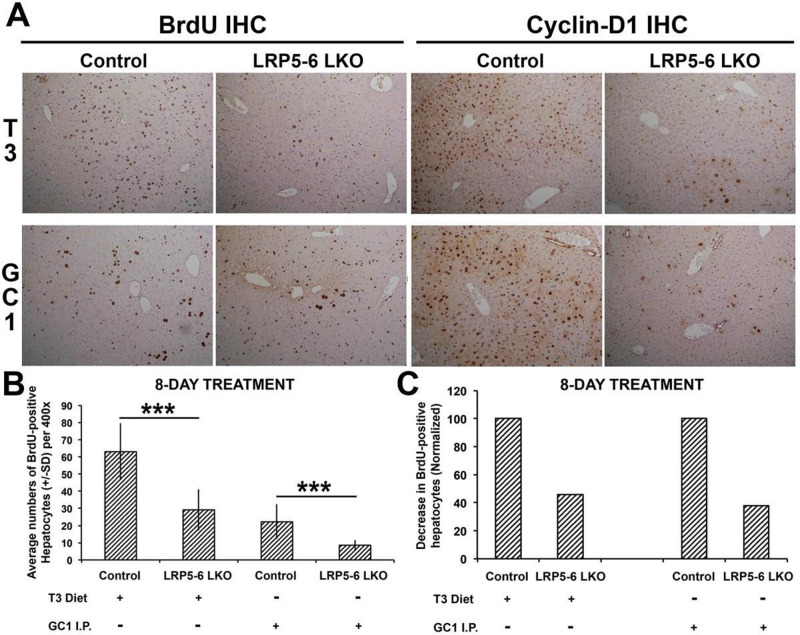
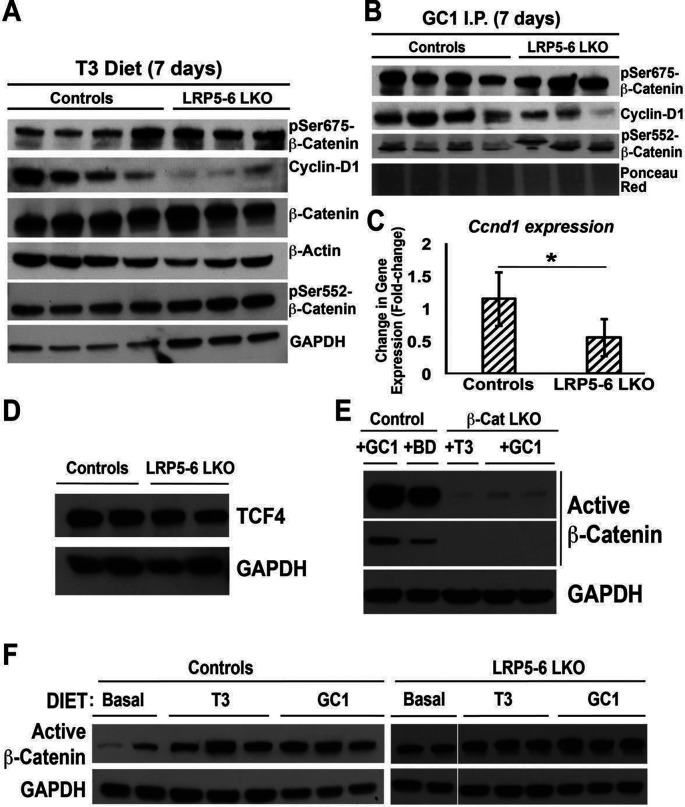
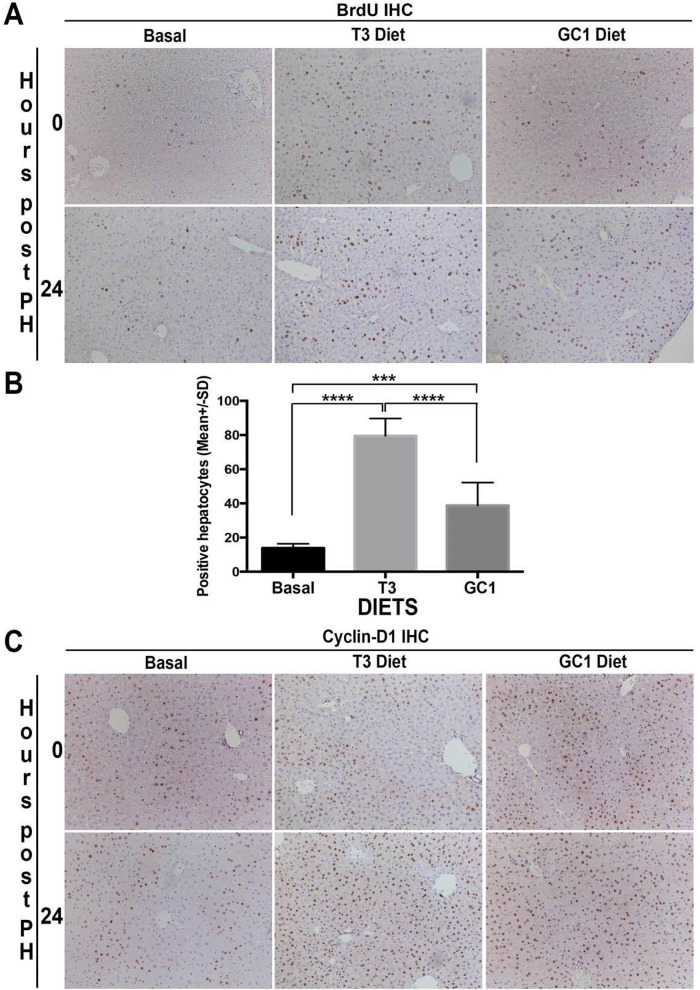
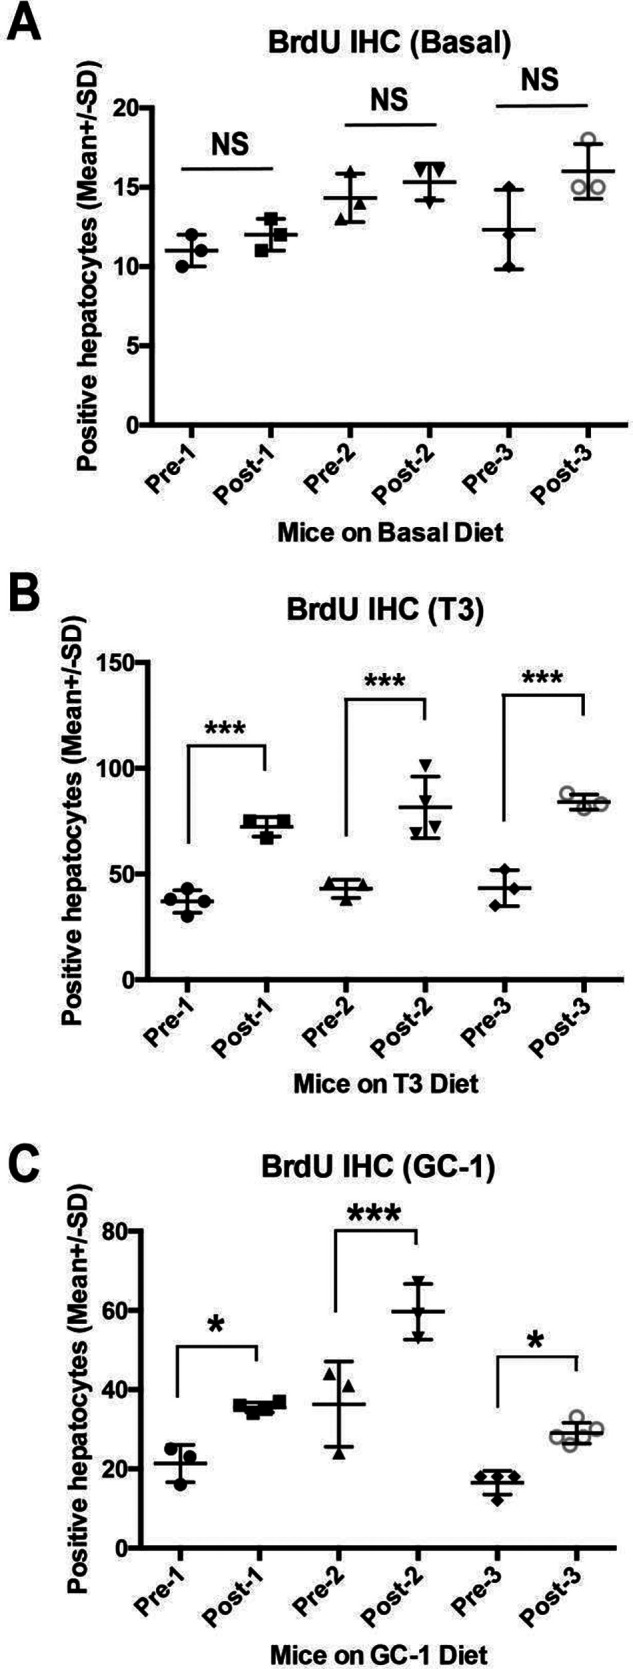
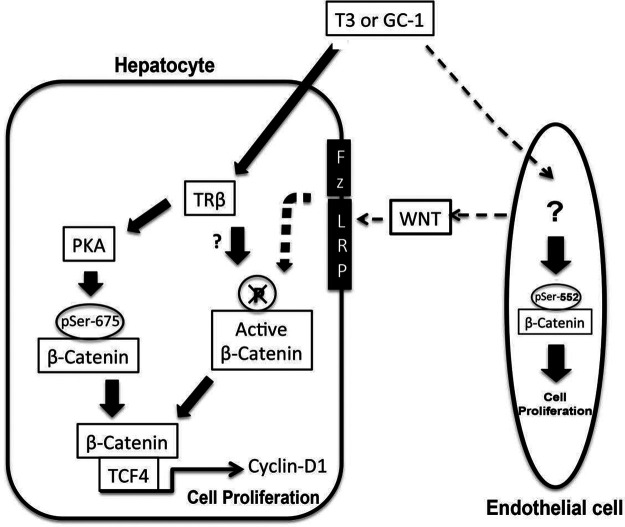
Triiodothyronine (T3) induces hepatocyte proliferation in rodents. Recent work has shown molecular mechanism for T3's mitogenic effect to be through activation of β-catenin signaling. Since systemic side effects of T3 may preclude its clinical use, and hepatocytes mostly express T3 hormone receptor β (TRβ), we investigated if selective TRβ agonists like GC-1 may also have β-catenin-dependent hepatocyte mitogenic effects. Here we studied the effect of GC-1 and T3 in conditional knockouts of various Wnt pathway components. We also assessed any regenerative advantage of T3 or GC-1 when given prior to partial hepatectomy in mice. Mice administered GC-1 showed increased pSer675-β-catenin, cyclin D1, BrdU incorporation, and PCNA. No abnormalities in liver function tests were noted. GC-1-injected liver-specific β-catenin knockouts (β-catenin LKO) showed decreased proliferation when compared to wild-type littermates. To address if Wnt signaling was required for T3- or GC-1-mediated hepatocyte proliferation, we used LRP5-6-LKO, which lacks the two redundant Wnt coreceptors. Surprisingly, decreased hepatocyte proliferation was also evident in LRP5-6-LKO in response to T3 and GC-1, despite increased pSer675-β-catenin. Further, increased levels of active β-catenin (hypophosphorylated at Ser33, Ser37, and Thr41) were evident after T3 and GC-1 treatment. Finally, mice pretreated with T3 or GC-1 for 7 days followed by partial hepatectomy showed a significant increase in hepatocyte proliferation both at the time (T0) and 24 h after surgery. In conclusion, like T3, TRβ-selective agonists induce hepatocyte proliferation through β-catenin activation via both PKA- and Wnt-dependent mechanisms and confer a regenerative advantage following surgical resection. Hence, these agents may be useful regenerative therapies in liver transplantation or other surgical settings.


Figures

Figure 1
Figure 1
Thyroid hormone receptor β agonist GC-1 induces hepatocyte proliferation in wild-type mice. (A) Representative photomicrographs (100×) of immunohistochemistry for BrdU and PCNA showed increased proliferation in GC-1-treated mouse livers compared with DMSO controls. Nuclear cyclin D1 was also increased in GC-1-treated mice. (B) Western blot of whole-liver lysates showed increased cyclin D1 and pSer675-β-catenin in GC-1-treated mice compared with DMSO control. (C) Bar graphs shows that the difference in ALT and bilirubin (BR) levels between the experimental groups and control animals was not significant (NS), and all values were within normal limits. (D) Comparable normal hepatic histology in 8-day DMSO and GC-1-injected control mice (100×).
Figure 2
Figure 2
Comparison of T3 diet-supplemented versus GC-1-injected mice. (A) Immunohistochemistry for BrdU and cyclin D1 shows increased staining in the T3 and GC-1 treatment groups when compared with respective controls (100×). (B) Bar graphs showing average number of BrdU-positive hepatocyte nuclei per high-power field (HPF) (400×) in different conditions. Ten HPFs were counted for each group. T3 diet showed the highest proliferation when compared with basal diet and with GC-1 injections (***p < 0.001). GC-1 showed increased proliferation when compared to DMSO-injected controls (***p < 0.001). DMSO-injected controls had less baseline proliferation than basal diet-fed animals with no other intervention (***p < 0.001).
Figure 3
Figure 3
Increased hepatocyte proliferation in wild-type mice fed T3-supplemented (4 mg/kg) and GC-1-supplemented (5 mg/kg) diets. (A) Similar hepatic histology is observed in H&E-stained sections in basal diet-, T3 diet-, and GC diet-fed mice as shown in representative images from all three groups (100×). (B) Immunohistochemistry shows increased BrdU incorporation and increased nuclear cyclin D1 in both T3 diet- and GC-1 diet-fed groups when compared to basal diet-fed animals (100×). (C) Bar graphs showing average number of BrdU-positive hepatocyte nuclei per HPF (600×) in different conditions. Ten HPFs were counted for each group. T3- and GC-1-fed animals had significantly more BrdU-positive hepatocyte nuclei than basal diet GC-1-fed mice (***p < 0.001). Interestingly, a significant difference in hepatocyte proliferation was also evident between the T3 diet- and GC-1-diet fed mice (***p < 0.001).
Figure 4
Figure 4
β-Catenin in hepatocytes is required for GC-1-induced hepatocyte proliferation. (A) Immunohistochemistry for BrdU shows decreased staining in T3 diet-fed and GC-1-injected β-cat-LKO mice as compared to control mice. As shown in previous work, there is increased proliferation in control mice fed T3 diet (100×). (B) Bar graphs showing average number of BrdU-positive hepatocyte nuclei per HPF (400×) in GC-1-injected β-cat-LKO as compared to control mice. A total 10 HPFs per group were counted. A significant difference in hepatocyte proliferation was observed between the two groups (***p < 0.001). (C) Immunohistochemistry for cyclin D1 shows increased staining in the livers of littermate control mice that received T3 or GC-1 as compared to notably less staining in β-cat-LKO mice (100×). (D) Real-time PCR shows significant decrease in mRNA expression of cyclin D1 in GC-1-injected β-catenin-LKO mice as compared to littermate controls (one-tailed t-test, *p < 0.05). (E) Representative Western blots using liver lysates from β-cat-LKO and controls after treatment with T3 or GC-1. As expected, β-catenin and pSer675-β-catenin levels are absent or low. Interestingly, pSer552-β-catenin levels are similar to wild-type or slightly increased.
Figure 5
Figure 5
T3- and GC-1-induced proliferation is blunted in the absence of redundant Wnt coreceptors LRP5-6 in hepatocytes. (A) BrdU and cyclin D1 immunohistochemistry shows decreased staining of hepatocytes in LRP5-6-LKO as compared to littermate controls in response to T3 and GC-1 administration. Continued staining of smaller nonparenchymal cells is observed in controls and LRP5-6-LKO in response to T3 and GC-1 (100×). (B) Bar graph shows a significant decrease in the number of hepatocytes displaying BrdU-positive nuclei per HPF (400×) in the liver sections of LRP5-6 versus controls in response to T3 and GC-1 (***p < 0.001). (C) Normalizing BrdU counts to their respective controls show that LRP5-6-LKO shows comparably reduced percentage of hepatocyte labeling in response to T3 and GC-1.
Figure 6
Figure 6
T3 and GC-1 induce β-catenin activation via both PKA and Wnt signaling. (A) Representative Western blots showing comparable total β-catenin levels in liver lysates from controls and LRP5-6 administered T3 diet for 8 days. Despite increased levels of pSer675-β-catenin and pSer552-β-catenin, decreased cyclin D1 was evident in the LRP5-6-LKO group. GAPDH and β-actin were loading controls. (B) Representative Western blots showing comparable total β-catenin levels in liver lysates from controls and LRP5-6 injected with GC-1 for 8 days. Despite comparably high levels of pSer675-β-catenin and even greater pSer552-β-catenin levels in LRP5-6-LKO liver lysates, cyclin D1 levels were notably lower in this group. Ponceau Red shows comparable loading in all lanes. (C) RT-PCR shows reduced mRNA expression of cyclin D1 gene in the livers from GC-1-injected LRP5-6-LKO as compared to controls (one-tailed t-test, *p < 0.05). (D) Western blot shows comparable levels of TCF4 in the liver lysates of LRP5-6-LKO and littermate control livers. GAPDH shows equal loading in all lanes. (E) Representative Western blot shows that 8 days of GC-1 diet fed to animals leads to notably increased levels of active β-catenin (upper panel, darker exposure; lower panel, lighter exposure). Liver lysates from T3 or GC-1 administered β-cat-LKO show very low levels of active β-catenin, presumably from the nonparenchymal cells. GAPDH represents comparable loading in all lanes. (F) Representative Western blot shows notable increase in active β-catenin levels in liver lysates from control littermates administered T3 or GC-1 for 8 days as compared to basal diet. However, comparable levels of active β-catenin were observed in LRP5-6-LKO liver lysates fed basal diet or administered T3 or GC-1 diet for 8 days. GAPDH depicts equal loading in each lane.
Figure 7
Figure 7
Increased hepatocyte proliferation and cyclin D1 expression after partial hepatectomy in mice pretreated with T3- or GC-1-supplemented diet for 8 days. (A) Immunohistochemistry for BrdU shows increased numbers of hepatocyte staining positive after 8 days of T3 or GC-1 feeding ad libitum as compared to mice fed basal diet. The analysis was carried out in lobes that were surgically removed at the time of hepatectomy (time 0). A further increase in BrdU staining was evident in regenerating livers at 24 h in animals that were maintained on T3 or GC-1 diet postsurgery as compared to the group fed basal diet after surgery (100×). (B) Bar graph shows a significant increase in the number of BrdU-positive hepatocytes at 24 h after hepatectomy in the control diet-fed group versus T3 diet-fed group (****p < 0.0001) and control diet-fed group versus GC-1 diet-fed group (***p < 0.001). Further, a significant difference was also observed between the T3- and GC-1-fed group (**** p  < 0.0001). (C) Immunohistochemistry for cyclin D1 shows increased numbers of hepatocyte staining positive after 8 days of T3 or GC-1 feeding ad libitum as compared to mice fed basal diet. The analysis was carried in lobes that were surgically removed at the time of hepatectomy (time 0). A further increase in cyclin D1 staining was evident in regenerating livers at 24 h in animals that were maintained on T3 or GC-1 diet postsurgery as compared to the group fed basal diet after surgery (100×).
Figure 8
Figure 8
Increased hepatocyte proliferation after partial hepatectomy in mice pretreated with T3- or GC-1-supplemented diet for 8 days. (A) Bar graph showing no significant (NS) differences in the average number of number of BrdU-positive hepatocytes per 100× field in liver sections in three independent mice on basal diet at the time of hepatectomy (Pre-1-3) versus at 24 h after hepatectomy in the same animals (Post-1-3). (B) Bar graph showing significant differences (***p < 0.001) in the average number of number of BrdU-positive hepatocytes per 100× field in liver sections in three independent mice on T3 diet at the time of hepatectomy (Pre-1-3) versus at 24 h after hepatectomy in the same animals (Post-1-3). (C) Bar graph showing significant differences (*p < 0.05; ***p < 0.001) in the average number of number of BrdU-positive hepatocytes per 100× field in liver sections in three independent mice on GC-1 diet at the time of hepatectomy (Pre-1-3) versus at 24 h after hepatectomy in the same animals (Post-1-3).
Figure 9
Figure 9
Mechanism of T3/GC-1-induced β-catenin activation leading to cyclin D1 expression and cell proliferation. In hepatocytes, T3/GC-1 appears to activate β-catenin via PKA-dependent mechanism as well as through canonical Wnt signaling. It is likely that T3/GC-1 may induce β-catenin activation in endothelial cells to induce cell proliferation and also may stimulate Wnt release to activate β-catenin in hepatocytes in a paracrine fashion.

References

    1. Karp SJ. Clinical implications of advances in the basic science of liver repair and regeneration. Am J Transplant. 2009;9:1973–80. - PubMed
    1. Monga SP. Role and regulation of beta-catenin signaling during physiological liver growth. Gene Expr. 2014;16:51–62. - PMC - PubMed
    1. Monga SP. Beta-catenin signaling and roles in liver homeostasis, injury, and tumorigenesis. Gastroenterology 2015;148:1294–310. - PMC - PubMed
    1. Goessling W, North TE, Lord AM, Ceol C, Lee S, Weidinger G, Bourque C, Strijbosch R, Haramis AP, Puder M, Clevers H, Moon RT, Zon LI. APC mutant zebrafish uncover a changing temporal requirement for Wnt signaling in liver development. Dev Biol. 2008;320:161–74. - PubMed
    1. Nejak-Bowen KN, Thompson MD, Singh S, Bowen WC Jr, Dar MJ, Khillan J, Dai C, Monga SP. Accelerated liver regeneration and hepatocarcinogenesis in mice overexpressing serine-45 mutant beta-catenin. Hepatology 2010;51:1603–13. - PMC - PubMed

MeSH terms