. 2016 May 25;283(1831):20160692.
doi: 10.1098/rspb.2016.0692.

Rhythmic modulation of visual contrast discrimination triggered by action

Affiliations

Rhythmic modulation of visual contrast discrimination triggered by action

Alessandro Benedetto et al. Proc Biol Sci. .

Abstract

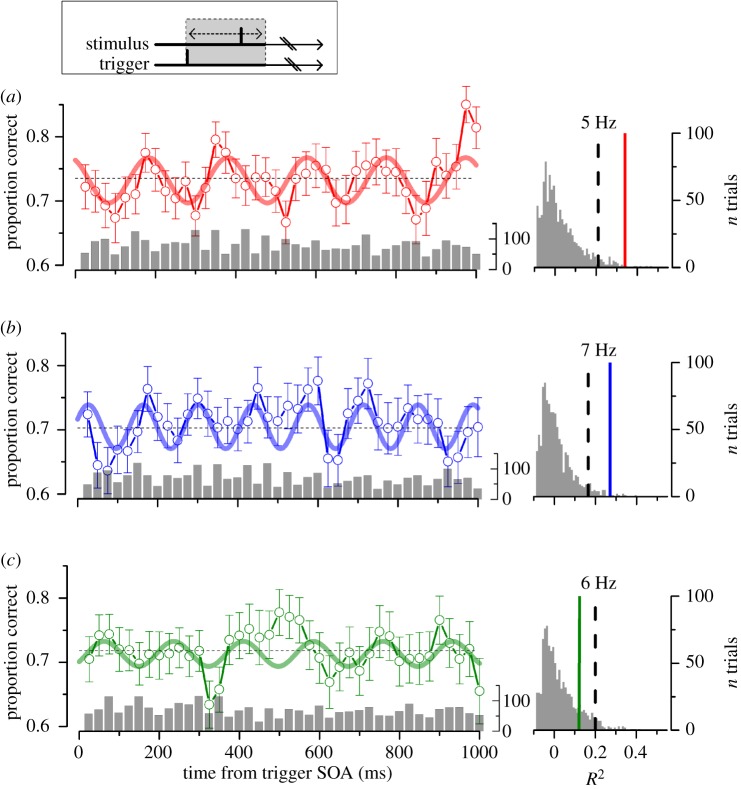
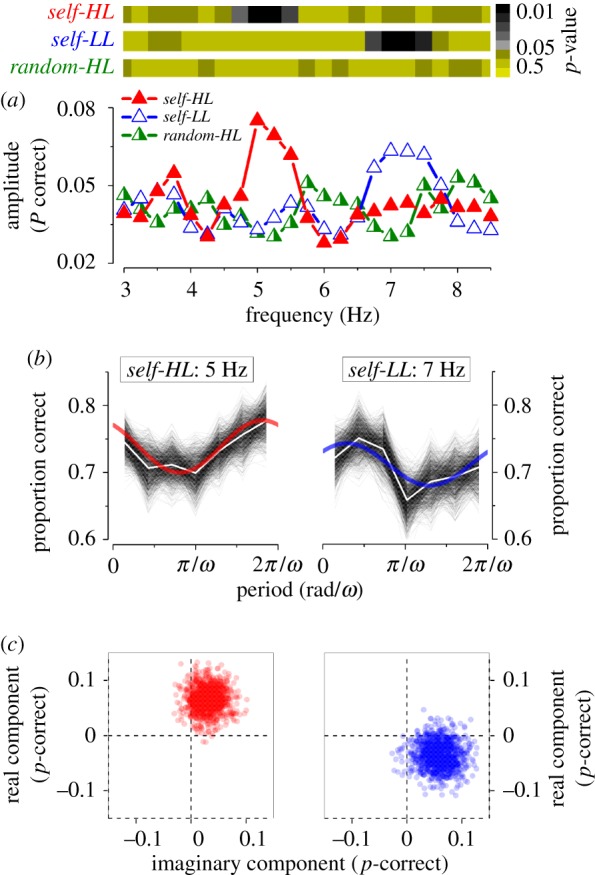
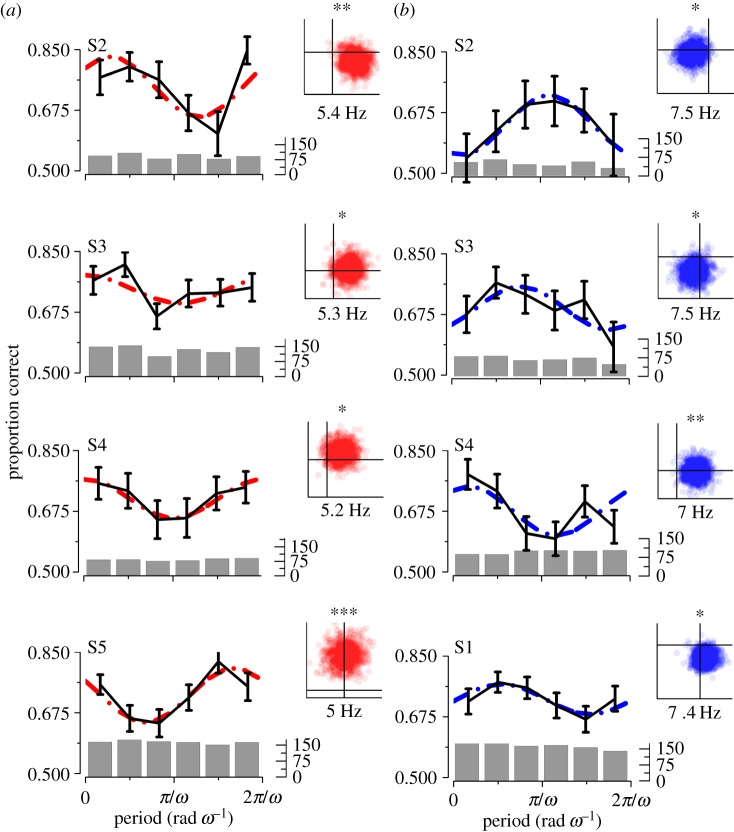
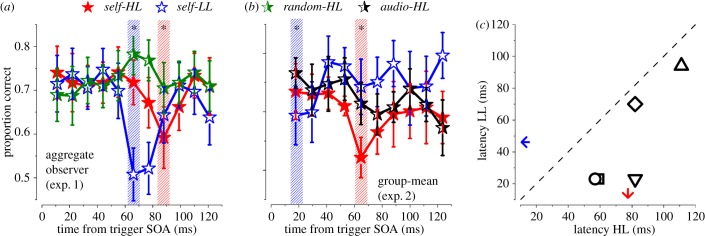
Recent evidence suggests that ongoing brain oscillations may be instrumental in binding and integrating multisensory signals. In this experiment, we investigated the temporal dynamics of visual-motor integration processes. We show that action modulates sensitivity to visual contrast discrimination in a rhythmic fashion at frequencies of about 5 Hz (in the theta range), for up to 1 s after execution of action. To understand the origin of the oscillations, we measured oscillations in contrast sensitivity at different levels of luminance, which is known to affect the endogenous brain rhythms, boosting the power of alpha-frequencies. We found that the frequency of oscillation in sensitivity increased at low luminance, probably reflecting the shift in mean endogenous brain rhythm towards higher frequencies. Importantly, both at high and at low luminance, contrast discrimination showed a rhythmic motor-induced suppression effect, with the suppression occurring earlier at low luminance. We suggest that oscillations play a key role in sensory-motor integration, and that the motor-induced suppression may reflect the first manifestation of a rhythmic oscillation.

Keywords: action and perception; contrast discrimination; endogenous rhythm; sensory–motor integration; visual oscillations.


Figures

Figure 1.
Figure 1.
Left: contrast discrimination performance as function of delay (stimulus onset asynchrony, SOA) from the self-trigger condition at high-luminance (a, self-HL; red) and at low-luminance (b, self-LL, blue); random-trigger condition at high-luminance (c, random-HL, green). Aggregate observer, n = 5. Bar plots show the number of independent observations for each bin (on average 74 ± 23). Vertical lines represent the s.e.m. from bootstrapping; thick lines represent the best sinusoidal fit to the data; horizontal dashed lines represent the average correct response. Right: adjusted-R2 distribution obtained by fitting the random shuffled data with the sinusoidal functions of a, b and c, respectively. Dashed lines mark 0.95 probability; thick lines mark the R2 for self-HL (p = 0.005), self-LL (p = 0.008) and random-HL condition (p = 0.12). (Online version in colour.)
Figure 2.
Figure 2.
Spectral analysis of visual performance of the aggregate observer. (a) Bottom: amplitude for self-HL (red filled triangles), self-LL (blue empty triangles) and random-HL (green half-filled triangles) conditions. Top: statistical significance in colour code for the three conditions calculated by a two-dimensional cluster spread derived by bootstrap as shown in (c). (b) Spectral analysis applied to the most significant harmonic component for self-HL and self-LL (5 and 7 Hz respectively). Bootstrap simulations (thin lines), their mean (white line) and best-fit model (continuous thick line) for the self-HL and self-LL conditions. (c) Two-dimensional polar statistics for the two most significant frequencies analysed. Real and imaginary components of each bootstrap for the self-trigger conditions. Points clustered away from the origin, indicating statistical significance as reported in (a) top row. (Online version in colour.)
Figure 3.
Figure 3.
Single subject spectral analysis of visual performance in experiment 1 for self-HL (a) and self-LL (b) conditions. Each panel shows the most significant frequency modulation in the range between 4.8–5.5 and 6.8–7.5 for self-HL and self-LL respectively. Six equal bins for each frequency. Dashed lines: best-fit model. Black lines: means and s.e.m. Bar plot shows the number of independent observations for each bin. Insets on the left: the two-dimensional statistics for the individual frequencies, each point corresponds to a bootstrap iteration. p-values significant levels: 0.05*, 0.01** and 0.001***. (Online version in colour.)
Figure 4.
Figure 4.
Proportion correct in the first 120 ms from trigger in experiments 1 and 2. (a) Aggregated observer results for experiment 1 (n = 5). (b) Group subject mean and s.e.m for experiment 2 (n = 5). Red filled stars: self-HL; Blue empty stars: self-LL; Green half-filled stars: random-HL; Black half-filled stars: audio-HL. Dashed bars indicate points statistically different from the mean of the curves (binomial test). Asterisk: p < 0.05. (c) Scatter plot of individual subjects’ latency corresponding to the minimum performance for self-HL and self-LL conditions in experiment 2. The arrows indicate the means across subjects. All points are below the equality line, indicating the minimum performance is reached earlier at low than high luminance. Bin size is equal to 12 ms with 50% overlap. (Online version in colour.)

References

    1. Spaak E, de Lange FP, Jensen O. 2014. Local entrainment of alpha oscillations by visual stimuli causes cyclic modulation of perception. J. Neurosci. 34, 3536–3544. (10.1523/Jneurosci.4385-13.2014) - DOI - PMC - PubMed
    1. Tomassini A, Spinelli D, Jacono M, Sandini G, Morrone MC. 2015. Rhythmic oscillations of visual contrast sensitivity synchronized with action. J. Neurosci. 35, 7019–7029. (10.1523/Jneurosci.4568-14.2015) - DOI - PMC - PubMed
    1. VanRullen R, Koch C. 2003. Is perception discrete or continuous? Trends Cogn. Sci. 7, 207–213. (10.1016/S1364-6613(03)00095-0) - DOI - PubMed
    1. Busch NA, Dubois J, VanRullen R. 2009. the phase of ongoing EEG oscillations predicts visual perception. J. Neurosci. 29, 7869–7876. (10.1523/Jneurosci.0113-09.2009) - DOI - PMC - PubMed
    1. de Lange FP, Rahnev DA, Donner TH, Lau H. 2013. Prestimulus oscillatory activity over motor cortex reflects perceptual expectations. J. Neurosci. 33, 1400–1410. (10.1523/Jneurosci.1094-12.2013) - DOI - PMC - PubMed

Publication types

LinkOut - more resources