. 2016 Jul 8;291(28):14468-82.
doi: 10.1074/jbc.M115.696781. Epub 2016 May 12.

Genetic Ablation of Calcium-independent Phospholipase A2γ Induces Glomerular Injury in Mice

Affiliations

Genetic Ablation of Calcium-independent Phospholipase A2γ Induces Glomerular Injury in Mice

Hanan Elimam et al. J Biol Chem. .

Abstract

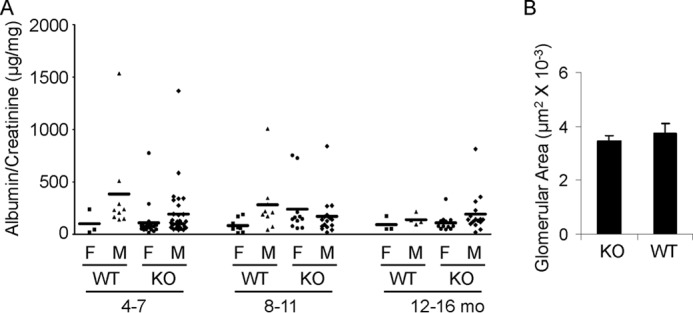
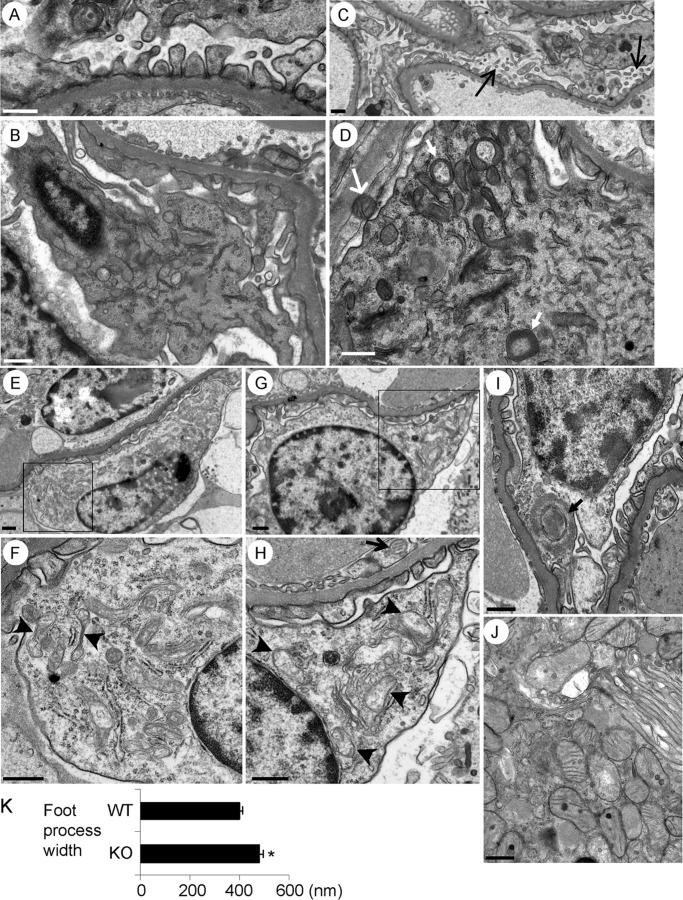
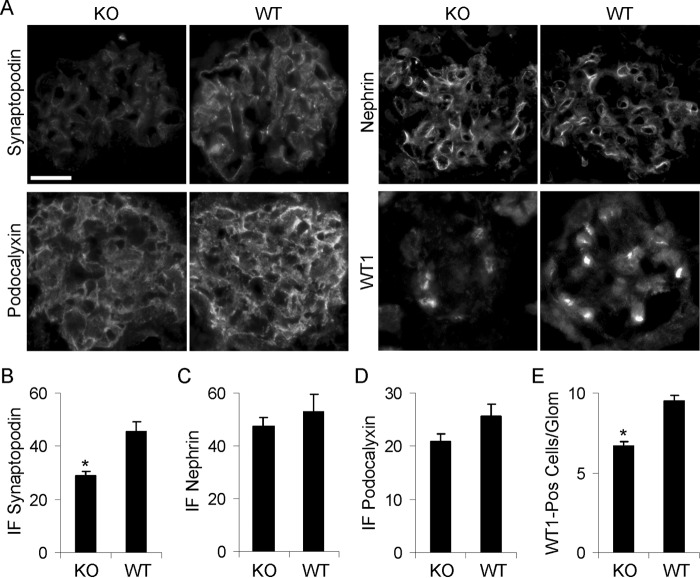
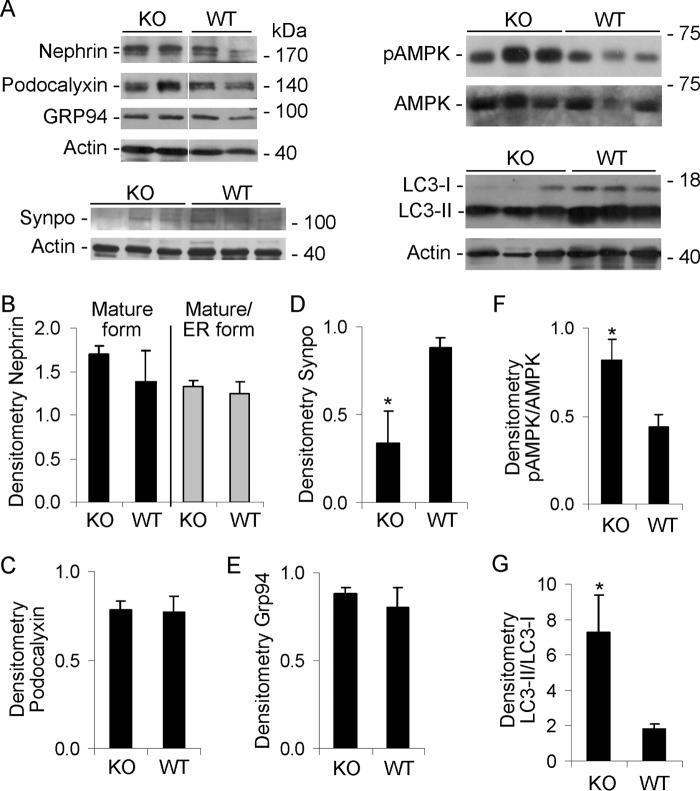
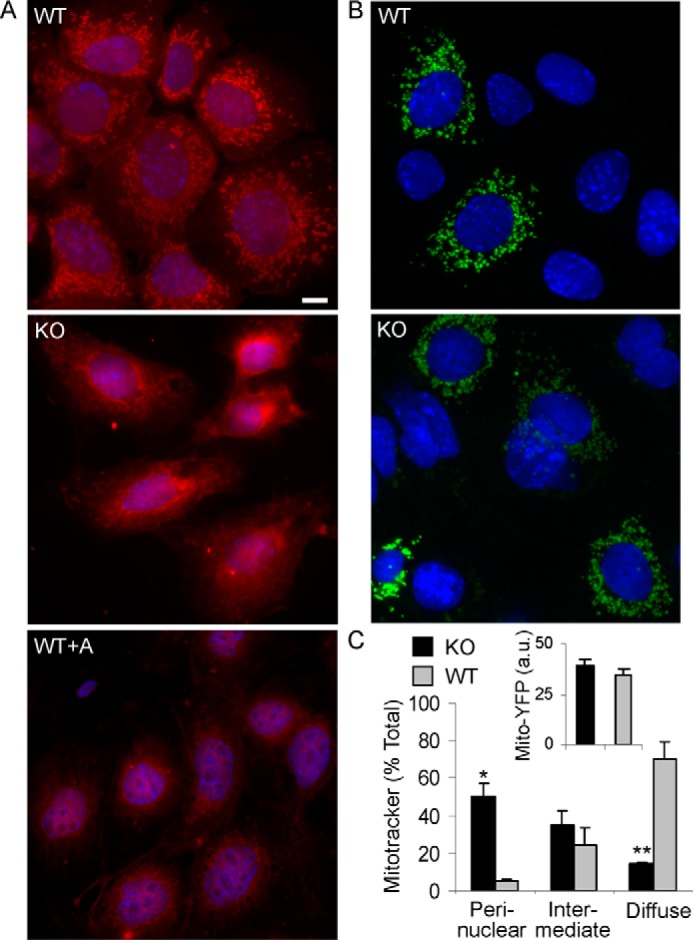
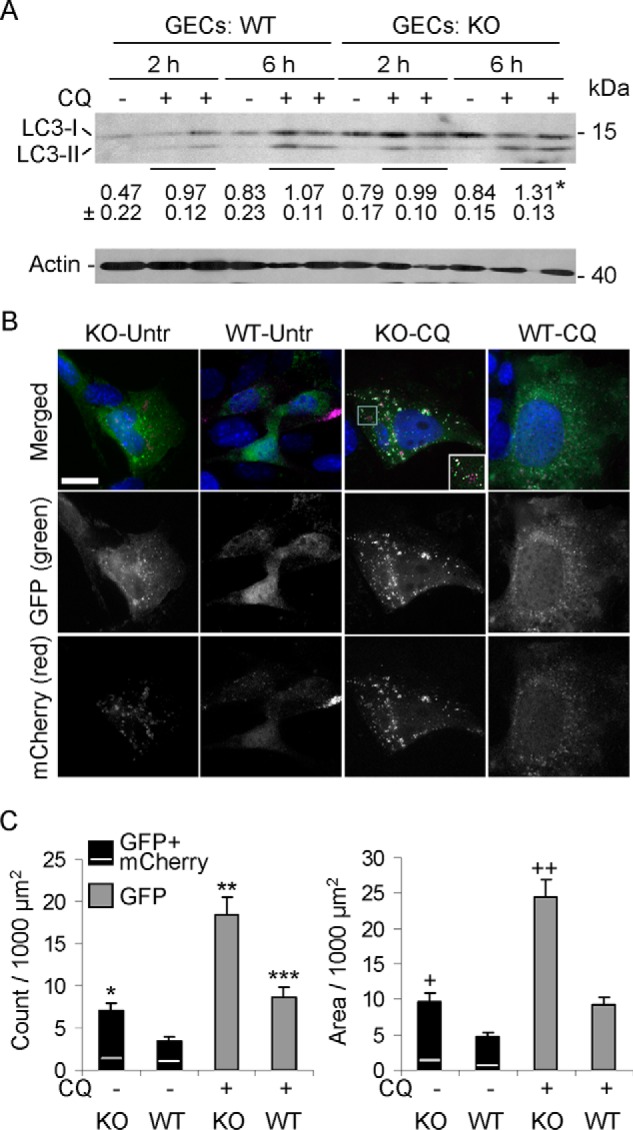
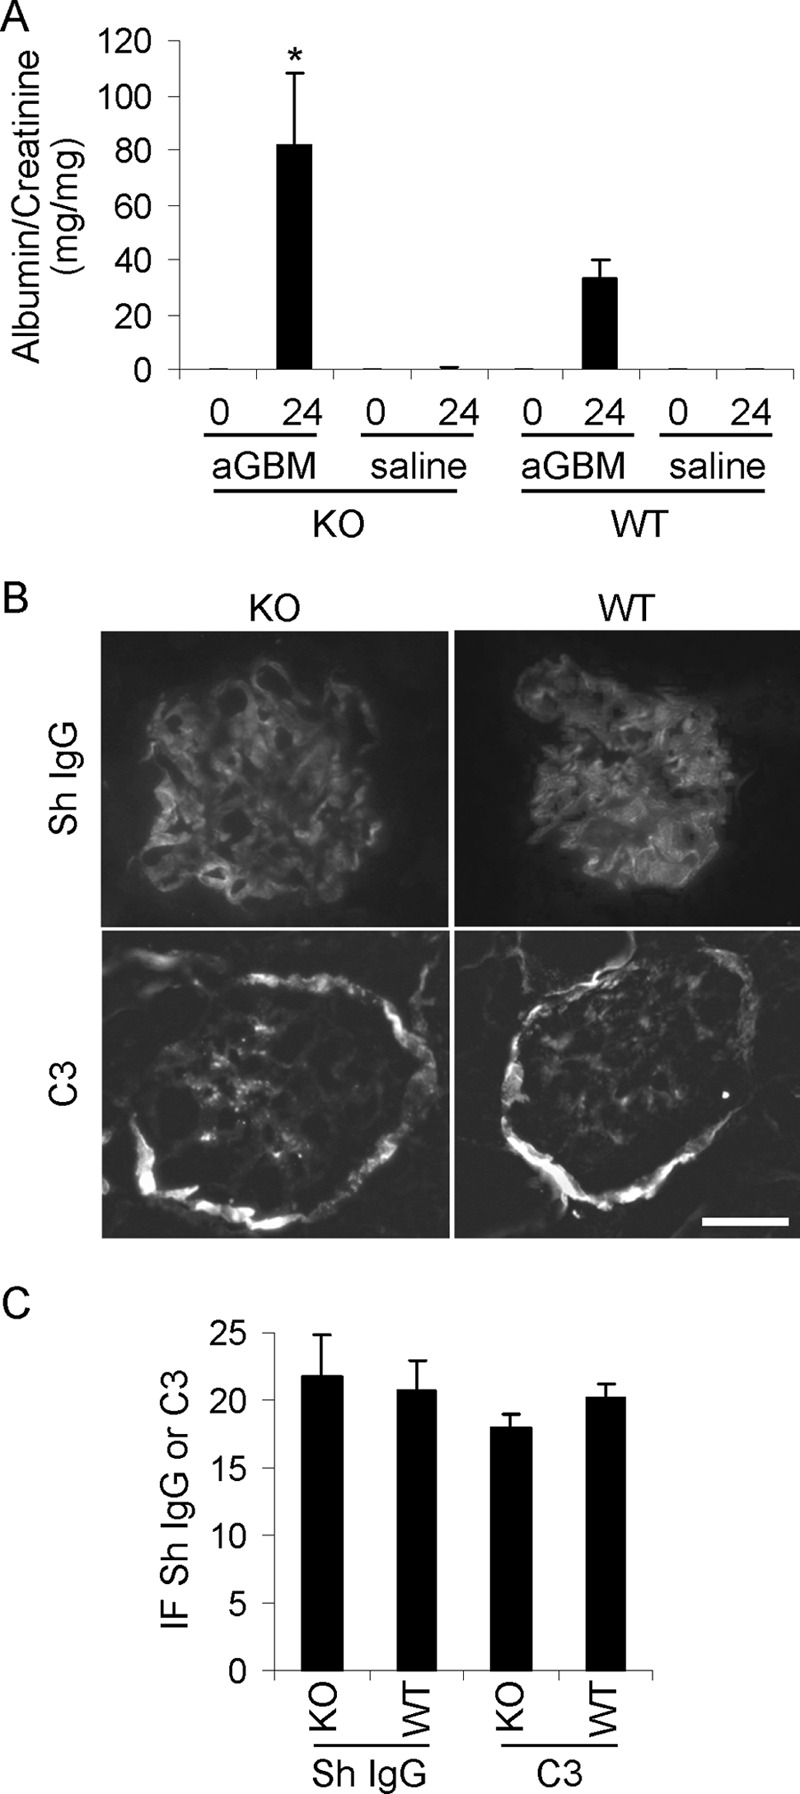
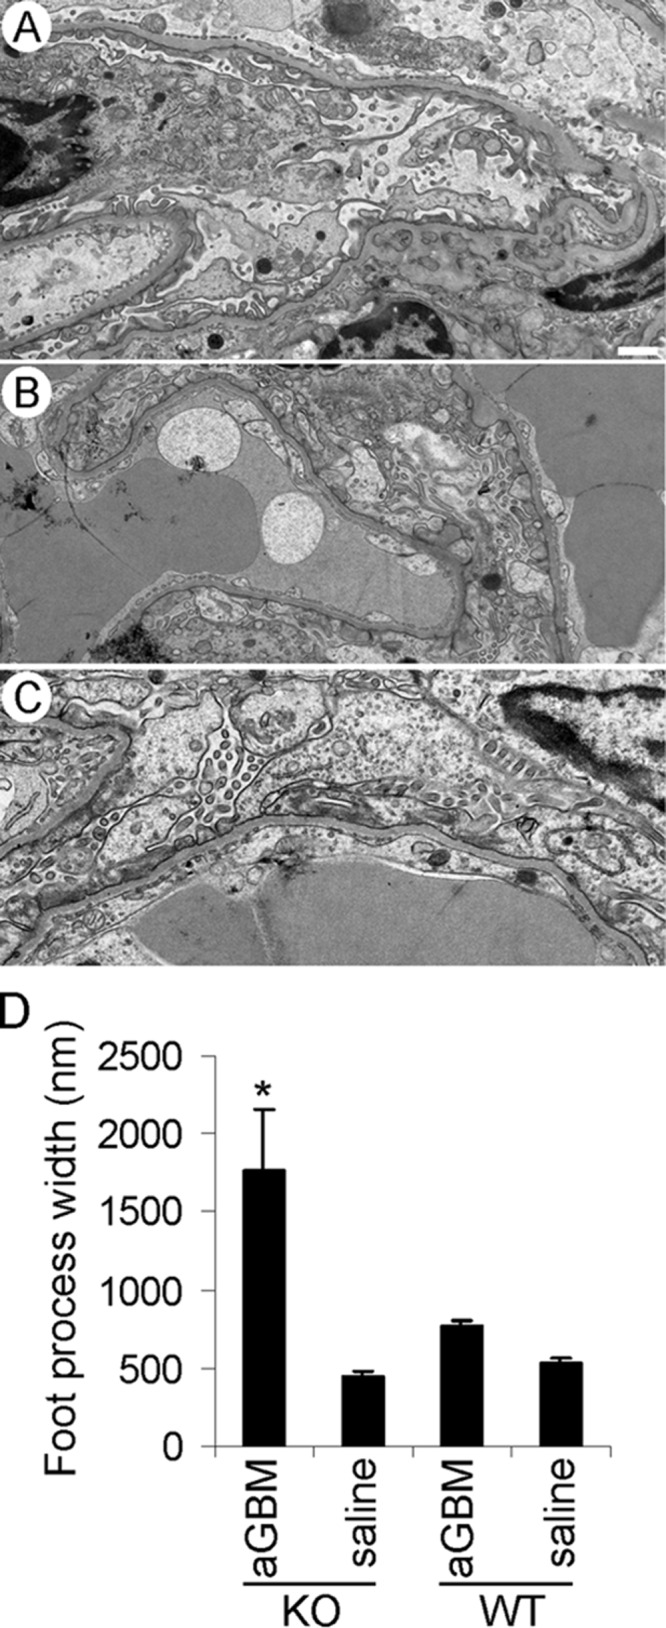
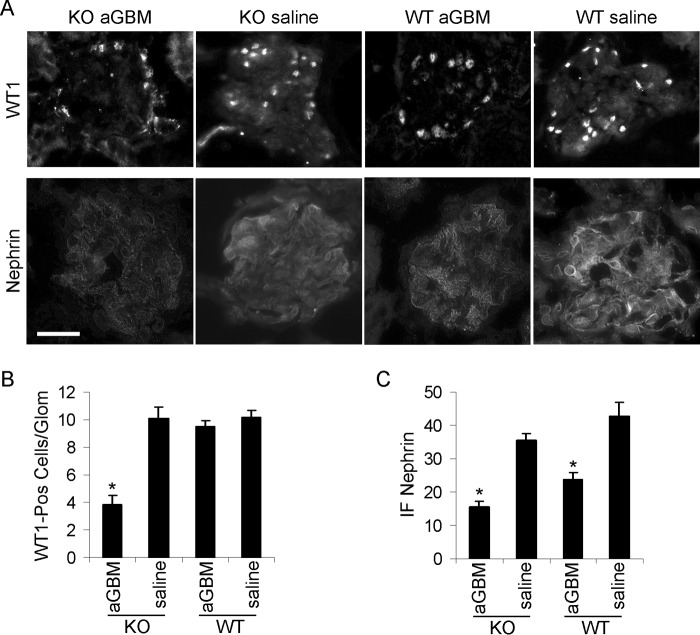
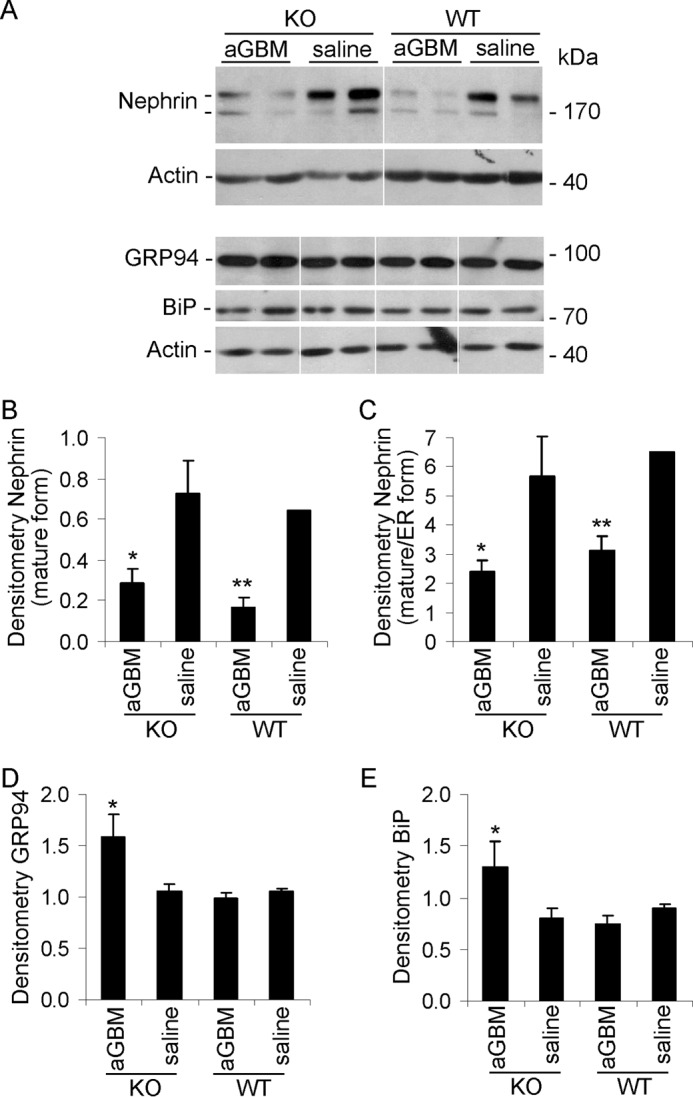
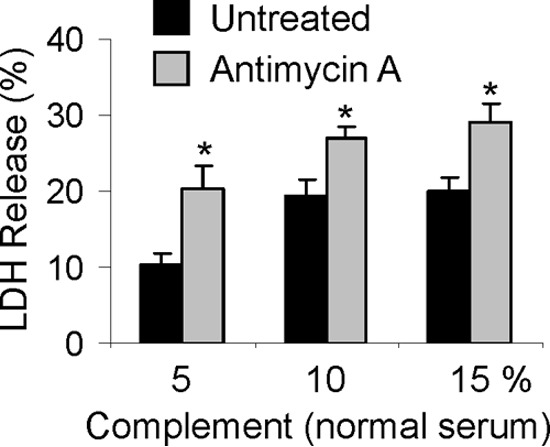
Glomerular visceral epithelial cells (podocytes) play a critical role in the maintenance of glomerular permselectivity. Podocyte injury, manifesting as proteinuria, is the cause of many glomerular diseases. We reported previously that calcium-independent phospholipase A2γ (iPLA2γ) is cytoprotective against complement-mediated glomerular epithelial cell injury. Studies in iPLA2γ KO mice have demonstrated an important role for iPLA2γ in mitochondrial lipid turnover, membrane structure, and metabolism. The aim of the present study was to employ iPLA2γ KO mice to better understand the role of iPLA2γ in normal glomerular and podocyte function as well as in glomerular injury. We show that deletion of iPLA2γ did not cause detectable albuminuria; however, it resulted in mitochondrial structural abnormalities and enhanced autophagy in podocytes as well as loss of podocytes in aging KO mice. Moreover, after induction of anti-glomerular basement membrane nephritis in young mice, iPLA2γ KO mice exhibited significantly increased levels of albuminuria, podocyte injury, and loss of podocytes compared with wild type. Thus, iPLA2γ has a protective functional role in the normal glomerulus and in glomerulonephritis. Understanding the role of iPLA2γ in glomerular pathophysiology provides opportunities for the development of novel therapeutic approaches to glomerular injury and proteinuria.

Keywords: Phospholipase A; autophagy; cell injury; glomerulonephritis; mitochondria; podocyte; proteinuria.


Figures

FIGURE 1.
FIGURE 1.
iPLA2γ deletion does not alter urinary albumin excretion in mice. A, urinary albumin/creatinine ratio. Each point represents the urine collection of a single mouse taken at monthly intervals between 4 and 16 months (mo) of age. WT and iPLA2γ KO mice were divided into groups according to sex (male (M) and female (F)). There are no significant differences among the groups. B, glomerular surface area was measured in light micrographs of KO and WT mice (age 10–11 months). There were no significant differences between groups (3 mice/group; 14–24 measurements/group). Error bars, S.E.
FIGURE 2.
FIGURE 2.
Kidney cell ultrastructure in 10–11-month-old mice (electron microscopy). A, podocyte foot processes in iPLA2γ-KO mice appeared structurally intact. B, podocyte from a WT, control mouse shows intact cell organelles, including mitochondria. C, podocytes from an iPLA2γ KO mouse show microvillous transformation and membrane vesiculation (arrows). D–I, podocytes from iPLA2γ-KO mice show abnormal mitochondria and autophagic vacuoles. F and H, magnified views of the areas in E and G outlined by boxes, respectively. Mitochondria in podocytes show aggregation, disruption of membranes, and loss of cristae (arrowheads in F and H), whereas some mitochondria appear to be undergoing fission (F). In D and I, the closed arrows point to autophagosomes in podocytes. Mitochondria in a parietal epithelial cell (open arrow, D) and a glomerular endothelial cell (open arrow, H) appear normal. The ER (F and H) and nuclei (E–I) in podocytes appear intact. J, proximal tubular epithelial cell from an iPLA2γ-KO mouse shows normal mitochondria. The brush border is seen on the top right of the photomicrograph. Bar, 500 nm. Glomeruli were examined in five KO and three WT mice, 2–3 glomeruli/mouse. K, quantification of foot process width in iPLA2γ-KO and WT mice. *, p < 0.0005 KO versus WT (21–22 measurements/group). Error bars, S.E.
FIGURE 3.
FIGURE 3.
Expression of synaptopodin, nephrin, podocalyxin, and WT1 in 10–11-month-old WT and iPLA2γ-KO mice. A, kidney sections were stained with specific antibodies and were examined by immunofluorescence microscopy. Bar, 20 μm. B–D, quantification of fluorescence intensity in arbitrary units (3–7 glomeruli/mouse in three KO and two WT mice, or 11–18 glomeruli/group, were analyzed). B, synaptopodin: p < 0.0002, KO versus WT. E, WT1-positive (pos) nuclei: p < 0.0001, KO versus WT (6–12 glomeruli/mouse in three KO and two WT mice, or 34–55 glomeruli/group, were analyzed). Error bars, S.E.
FIGURE 4.
FIGURE 4.
Effect of iPLA2γ deletion on expression of nephrin (fully glycosylated and ER forms), podocalyxin, GRP94, synaptopodin (synpo), phospho-AMPK (pAMPK), AMPK, and LC3-I and -II. Glomeruli were isolated from 10–11-month-old WT and iPLA2γ-KO mice. Lysates were immunoblotted, as indicated. A, representative immunoblots. The white lines in the top panel indicate reassembly of noncontiguous gel lanes. There were no adjustments made to the digital images among the lanes that would alter the information in the panels. B–G, densitometric quantification. B, C, and E, there were no significant differences in the expression of fully glycosylated nephrin (top nephrin band), nephrin maturation (ratio of top to bottom band), podocalyxin, and GRP94 between groups (3–5 mice/group). D, synaptopodin was significantly lower in KO glomeruli. *, p < 0.05, 3 mice/group. F, the ratio of phospho-AMPK/AMPK was significantly greater in KO glomeruli. *, p < 0.04, 4 mice/group. G, the ratio of LC3-II/LC3-I was significantly greater in KO mice. *, p = 0.01, 7–9 mice/group. Because the intensity of the LC3-I band in A was relatively weak, the immunoblot was repeated using a longer exposure time. This resulted in enhanced signals in LC3-I bands, although the signals of the LC3-II bands became oversaturated. Nevertheless, the LC3-II/LC3-I ratio remained significantly elevated in the KO mice compared with WT (results not shown). Error bars, S.E.
FIGURE 5.
FIGURE 5.
Mitochondrial function in cultured GECs. A, WT or iPLA2γ KO GECs were incubated with Mitotracker Red CMX-Ros (25 nm for 30 min). In most WT cells, the mitochondria stained brightly and were found diffusely throughout the cytoplasm. In many iPLA2γ KO cells, cytoplasmic staining was faint or absent, and the mitochondria were collapsed in a perinuclear distribution. The latter resembled the staining of Mitotracker Red in WT podocytes that had been treated with antimycin A (WT+A; 10 μm for 30 min) to induce mitochondrial dysfunction. Bar, 15 μm. Cells showing diffuse, perinuclear, and intermediate Mitotracker Red CMX-Ros staining patterns are quantified in the graph (C; intermediate pattern indicates perinuclear localization but with some diffuse staining). *, p < 0.0005; **, p < 0.0001, KO versus WT (170 KO cells and 228 WT cells). B, GECs were transiently transfected with mito-YFP. Images were obtained after 24 h. In transfected cells, expression of mito-YFP was comparable between KO and WT cells. The inset (C) shows quantification of YFP fluorescence intensity in arbitrary units (a.u.) (22–30 cells/group). Error bars, S.E.
FIGURE 6.
FIGURE 6.
Autophagy is enhanced in iPLA2γ KO GECs in culture. A, deletion of iPLA2γ in GECs increases the ratio of LC3-II/LC3-I. WT or iPLA2γ KO GECs were incubated with or without chloroquine (CQ; 15 μm) for 2 or 6 h. Shown is a representative immunoblot of GEC lysates. Values below the LC3 immunoblot indicate mean ± S.E. ratios of LC3-II/LC3-I in the eight groups (four experiments). *, p < 0.03 KO versus WT at 6 h (+CQ). B, iPLA2γ KO GECs in culture show greater numbers of mCherry- and GFP-LC3-II puncta compared with WT cells (representative fluorescence micrographs). GECs were transiently transfected with mCherry-GFP-LC3B (0.1 μg of plasmid DNA/well). After 24 h, cells were untreated (Untr; −) or treated with 15 μm chloroquine (CQ; +). Images were obtained after 6 h. Bar, 25 μm. The inset (KO-CQ, merged) is an enlargement of the area within the square. C, quantification of GFP-LC3-II puncta and GFP-LC3-II puncta area. Results were normalized per 1000 μm2 of cell area. In the bars showing the GFP + mCherry LC3-II puncta/area, the GFP and mCherry components are above and below the white line, respectively. The mCherry component is that which did not colocalize with GFP. *, p < 0.005, KO-untreated versus WT-untreated. **, p < 0.0001, KO-CQ versus WT-CQ; p < 0.0001, KO-CQ versus KO-Untr; and ***, p < 0.01 WT-CQ versus WT-untreated. +, p < 0.002 KO-untreated versus WT-untreated; ++, p < 0.0001 KO-CQ versus WT-CQ and p < 0.0001 KO-CQ versus KO-untreated (11–12 cells/group). Error bars, S.E.
FIGURE 7.
FIGURE 7.
iPLA2γ deletion exacerbates albuminuria in anti-GBM nephritis. Nephritis was induced in WT and iPLA2γ KO mice (3–4 months of age) via single intravenous injection of sheep anti-rat GBM antiserum (aGBM). Control mice received saline. The urinary albumin/creatinine ratio was measured before and 24 h after the injection. A, after the induction of anti-GBM nephritis, iPLA2γ KO mice had greater albuminuria compared with WT. *, p < 0.05, iPLA2γ KO anti-GBM versus WT anti-GBM. KO anti-GBM, n = 7 mice (4 females and 3 males); WT anti-GBM, n = 7 mice (2 females and 5 males); KO control, n = 4 mice; WT control, n = 4 mice. B, immunofluorescence staining for sheep (Sh) anti-GBM IgG and mouse complement C3 in mice with anti-GBM nephritis (at 24 h). There is bright glomerular fluorescence staining for sheep IgG in both WT and iPLA2γ KO mice. Fainter glomerular C3 staining was present in both groups of mice. The C3 staining of Bowman's capsule (surrounding the glomerulus) is observed in normal mouse kidneys and is not due to the administration of anti-GBM antibody. Bar, 20 μm. C, quantification of anti-GBM antibody and complement C3 deposition (fluorescence intensity) in arbitrary units shows no significance differences between groups. Error bars, S.E.
FIGURE 8.
FIGURE 8.
iPLA2γ deletion exacerbates abnormalities in podocyte ultrastructure in anti-GBM nephritis. Kidneys of four albuminuric mice (two iPLA2γ KO and two WT; 3–5 glomeruli/mouse) and three control mice (saline-treated groups) were examined by electron microscopy. A, an iPLA2γ KO mouse (age 3 months) injected with saline shows normal podocyte ultrastructure. Foot processes, cell bodies, and intracellular organelles appear intact (bar, 500 nm). B, WT mouse (age 3 months) injected with anti-GBM antibody. In this electron micrograph, podocyte foot processes appear widened with segmental effacement. There is some villous transformation of the podocyte plasma membranes. C, iPLA2γ KO mouse (age 3 months) injected with anti-GBM antibody. Podocyte cell bodies appear swollen, and the cell membranes show marked villous transformation and microvesiculation. Podocyte foot processes are almost completely effaced. D, quantification of foot process width in iPLA2γ-KO and WT mice. *, p < 0.0001 KO/anti-GBM versus other groups, 9–36 measurements/group. Error bars, S.E.
FIGURE 9.
FIGURE 9.
Immunofluorescence staining for WT1 and nephrin in anti-GBM nephritis. A and B, iPLA2γ deletion reduced podocyte number in anti-GBM nephritis. WT1 immunofluorescence was assessed in two WT mice without and with anti-GBM antibody and four iPLA2γ KO mice (age 3–4 months), without and with anti-GBM antibody. Bar, 20 μm. B, quantification of WT1-positive nuclei per glomerulus (25–36 glomeruli/group). *, p < 0.001 KO/anti-GBM versus WT/anti-GBM. A and C, nephrin immunofluorescence intensity was assessed in iPLA2γ KO mice without (n = 2) and with anti-GBM antibody (n = 6) and in WT mice without (n = 2) and with anti-GBM antibody (n = 5). *, p < 0.0001 anti-GBM versus saline (14–31 measurements/group). Error bars, S.E.
FIGURE 10.
FIGURE 10.
Effect of iPLA2γ on the expression of nephrin and ER stress proteins in anti-GBM nephritis. Glomeruli were isolated from 3-month-old WT and iPLA2γ KO mice that were treated with anti-GBM antibody or saline (at 24 h). Lysates were immunoblotted as indicated. A, representative immunoblots. The white lines indicate reassembly of noncontiguous gel lanes. There were no adjustments made to the digital images among the lanes that would alter the information in the panels. B–E, densitometric quantification. B and C, anti-GBM antibody reduced expression of mature nephrin (top nephrin band) as well as maturation of nephrin (ratio of top to bottom band) in both WT and iPLA2γ KO mice. B, *, p < 0.02; **, p < 0.01, anti-GBM versus saline (3–4 mice/group). C, *, p = 0.05; **, p < 0.02 anti-GBM versus saline (3–4 mice/group). D and E, anti-GBM antibody increased expression of GRP94 and BiP (GRP78) in iPLA2γ KO mice. D, *, p < 0.005 KO/anti-GBM versus KO/saline (3–4 mice/group). E, *, p < 0.02, KO/anti-GBM versus KO/saline (3–4 mice/group). Error bars, S.E.
FIGURE 11.
FIGURE 11.
Mitochondrial injury enhances complement-mediated cytotoxicity. Cultured GECs were preincubated with or without antimycin A (10 μm, 30 min). Then untreated and antimycin A-treated GECs were incubated with anti-GEC antibody (40 min) and complement (5, 10, and 15% normal serum; heat-inactivated serum in controls) for 40 min. Cytolysis was monitored by release of LDH. *, p < 0.001 antimycin A versus untreated (four experiments). Antimycin A had no significant independent effect on cytolysis. Error bars, S.E.

References

    1. Murakami M., and Kudo I. (2002) Phospholipase A2. J. Biochem. 131, 285–292 - PubMed
    1. Six D. A., and Dennis E. A. (2000) The expanding superfamily of phospholipase A2 enzymes: classification and characterization. Biochim. Biophys. Acta 1488, 1–19 - PubMed
    1. Ramanadham S., Ali T., Ashley J. W., Bone R. N., Hancock W. D., and Lei X. (2015) Calcium-independent phospholipases A2 and their roles in biological processes and diseases. J. Lipid Res. 56, 1643–1668 - PMC - PubMed
    1. Schaloske R. H., and Dennis E. A. (2006) The phospholipase A2 superfamily and its group numbering system. Biochim. Biophys. Acta 1761, 1246–1259 - PubMed
    1. Mancuso D. J., Jenkins C. M., and Gross R. W. (2000) The genomic organization, complete mRNA sequence, cloning, and expression of a novel human intracellular membrane-associated calcium-independent phospholipase A2. J. Biol. Chem. 275, 9937–9945 - PubMed

Publication types

MeSH terms