. 2016 Jul 1;291(27):14170-14184.
doi: 10.1074/jbc.M115.710947. Epub 2016 May 11.

Lysosomal Dysfunction Caused by Cellular Accumulation of Silica Nanoparticles

Affiliations

Lysosomal Dysfunction Caused by Cellular Accumulation of Silica Nanoparticles

Irene Schütz et al. J Biol Chem. .

Abstract

Nanoparticles (NPs) are widely used as components of drugs or cosmetics and hold great promise for biomedicine, yet their effects on cell physiology remain poorly understood. Here we demonstrate that clathrin-independent dynamin 2-mediated caveolar uptake of surface-functionalized silica nanoparticles (SiNPs) impairs cell viability due to lysosomal dysfunction. We show that internalized SiNPs accumulate in lysosomes resulting in inhibition of autophagy-mediated protein turnover and impaired degradation of internalized epidermal growth factor, whereas endosomal recycling proceeds unperturbed. This phenotype is caused by perturbed delivery of cargo via autophagosomes and late endosomes to SiNP-filled cathepsin B/L-containing lysosomes rather than elevated lysosomal pH or altered mTOR activity. Given the importance of autophagy and lysosomal protein degradation for cellular proteostasis and clearance of aggregated proteins, these results raise the question of beneficial use of NPs in biomedicine and beyond.

Keywords: autophagy; caveolae; endocytosis; endosome; lysosome; silica nanoparticles.


Figures

SCHEME 1.
SCHEME 1.
Scheme illustrating the synthesis of AHAPS-functionalized SiNPs using the microemulsion and Stöber technique (see “Experimental Procedures”).
FIGURE 1.
FIGURE 1.
SiNPs are internalized largely via dynamin 2-mediated caveolar endocytosis. A, transmission electron microscopy images and corresponding size distributions of FITC-labeled SiNPs (a, left) and non-labeled SiNPs (b, right) functionalized with AHAPS. Scale bar, 200 nm. B, representative immunoblots of HeLa cell lysates after treatment with siRNA. Protein levels for clathrin (4.9 ± 2.6% of control), flotillin 1 (15.0 ± 0.9% of control), caveolin 1 (5.1 ± 0.9% of control), or caveolin 1 smartpool (4.4 ± 3.6% of control) and dynamin 2 (5% of control) were determined using Image J software. C, quantification of SiNP uptake as shown in D. Depicted is the mean SiNP fluorescence intensity of HeLa cells treated with siRNAs against clathrin (91.8 ± 6.8%), flotillin 1 (84.7 ± 2.0%), caveolin 1 (52.8 ± 8.2% for single or 62.9 ± 8.8% for smartpool siRNA), or dynamin 2 (49.9 ± 10.3%) (n = 3–10 independent experiments; *, p < 0.05; **, p < 0.01). ns, not significant. D, Representative confocal microscopy images of HeLa cells incubated with SiNPs after depletion of clathrin, flotillin 1, caveolin 1 (single or smartpool siRNA), or dynamin 2. Scale bar, 10 μm.
FIGURE 2.
FIGURE 2.
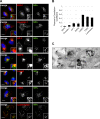
SiNPs accumulated in lysosomes. A, confocal microscopy images of HeLa cells illustrating the subcellular localization of internalized SiNPs after 4 h (green channel) and various organellar markers (red channel). EEA1 and the caveolar marker protein caveolin-1 do not colocalize with internalized SiNPs. There is a partial colocalization of SiNPs with the trans-Golgi network/endosomal proteins AP-1 and mannose 6-phosphate receptor (M6PR). SiNPs strongly colocalize with the lysosomal membrane protein LAMP1 and CD63. A profound colocalization of SiNPs with lysosomes was also observed in living cells after incubation with LysoTracker Red. Scale bar, 10 μm. B, Pearson's correlation coefficients of SiNPs with different organellar markers: EEA1 (early endosomes), 0.080 ± 0.014; caveolin 1 (caveolae), 0.068 ± 0.001; AP-1 (trans-Golgi network/recycling endosomes), 0.161 ± 0.032; M6PR (trans-Golgi network/endosomes), 0.212 ± 0.008; LAMP1 (late endosomes/lysosomes), 0.396 ± 0.023; CD63 (late endosomes/lysosomes), 0.474 ± 0.012; LysoTracker (lysosomes), 0.439 ± 0.021. n = 3 independent experiments. C, electron micrographs of lysosomes acquired after 4 h (left) or 24 h (right) of HeLa cell incubation with SiNPs. Scale bars, 500 nm.
FIGURE 3.
FIGURE 3.
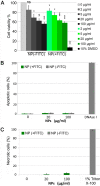
SiNPs accumulation in lysosomes reduced metabolic activity but did not induce apoptotic or necrotic death of cells. A, reduced metabolic activity of SiNP-treated (24 h) HeLa cells assayed by MTT. Viability was determined for cells treated with 2 μg ml−1 SiNPs (85.0 ± 9.4% (−FITC) and 83.1 ± 4.9% (+FITC)) with 5 μg ml−1 SiNPs (68.8 ± 7.6% (−FITC) and 74.0 ± 5.8% (+FITC)), with 20 μg ml−1 SiNPs (62.3 ± 4.8% (−FITC) and 63.2 ± 2.9% (+FITC)), and 100 μg ml−1 SiNPs (55.8 ± 4.0%(−FITC) and 58.0 ± 2.6% (+FITC), respectively). ns, non-significant; *, p < 0.05; **, p < 0.01; ***, p < 0.001. B, SiNP treatment of HeLa cells does not induce apoptotic cell death. Apoptotic cell death of HeLa cells treated for 24 h with 20 μg ml−1 or 100 μg ml1 SiNPs analyzed by TUNEL staining. Cells treated with DNase I for 15 min served as a positive control. C, SiNP treatment of HeLa cells does not induce necrotic cell death. Necrotic cell death of HeLa cells treated for 24 h with 20 μg ml−1 or 100 μg ml1 SiNPs analyzed by lactate dehydrogenase (LDH) release into the medium. Lactate dehydrogenase activity released by complete lysis of HeLa cells after treatment with 1% Triton X-100 was set to 100%.
FIGURE 4.
FIGURE 4.
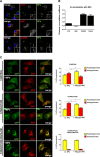
Effects on autophagy in SiNP-loaded cells. A, immunoblot analysis of control cells or cells treated with 20 μg/ml SiNPs (NPs (low)) or 100 μg/ml SiNPs (NPs (high)) for LC3-I (inactive precursor), LC3-II (the active autophagosome-associated form), and p62. The LC3-II/LC3-I ratio was quantified and normalized to control cells: control (set to 1); NPs (low) (3.1 ± 0.9); NPs (high) (5.0 ± 1.2). p62 quantification: control (set to 1); NPs (low) (3.04 ± 1.4); NPs (high) (6.38 ± 3.9). n = 4 independent experiments; *, p < 0.05. B, left, confocal images of control or SiNP-treated HeLa cells (low, 20 μg/ml; high, 100 μg/ml) stained for the autophagosomal marker LC3. Right, quantification of LC3 intensity levels in control cells (set to 100%) and in cells incubated with low NPs (129.1 ± 4.6%) and high NPs (274.8 ± 58.6%). Values represent the mean ± S.E. for n = 4 independent experiments; *, p < 0.05. C, left, confocal images of control or SiNP-treated HeLa cells (low, 20 μg/ml; high, 100 μg/ml) stained for the autophagic marker p62. Right, quantification of p62 intensity levels in control cells (set to 100%) and in cells incubated with low NPs (260.9 ± 42.4%) and with high NPs (313.3 ± 55.4%). Data represent mean ± S.E., n = 3 independent experiments; *, p < 0.05. D, left, confocal images of control or Fe2O3-NP-treated HeLa cells (low, 20 μg/ml; high, 100 μg/ml) stained for the autophagosomal marker LC3. Right, quantification of LC3 intensity levels in control cells (set to 100%) and in cells incubated with low NPs (177.87 ± 65.3%) and with high NPs (182.64 ± 78.3%). Data represent mean ± S.E., n = 2 independent experiments. E, representative confocal images of HeLa cells treated or not with 100 μg/ml SiNPs (NPs (high)) and co-stained for LC-3 and LAMP1. Scale bar, 10 μm.
FIGURE 5.
FIGURE 5.
SiNPs induced the accumulation of autophagy markers by blocking autophagic flux. A, untreated or treated HeLa cells with 100 μg/ml FITC-labeled SiNPs (FITC-NPs) for 24 h were incubated in complete DMEM medium and in serum-free starvation medium for 4 h in the presence or absence of bafilomycin A1 and then analyzed by Western blotting for the autophagosomal marker LC3. The LC3-II/LC3-I ratio was quantified and normalized to untreated control cells. Shown are non-starved control cells (set to 1), starved control cells (2.52 ± 0.2), starved control cells treated with 100 nm bafilomycin A1 (4.002 ± 0.5), non-starved cells incubated with FITC-NPs (3.98 ± 0.87), starved FITC-NPs-treated cells in the absence (4.84 ± 1) or presence of 100 nm bafilomycin A1 (5.13 ± 1.2). Data are the mean ± S.E.; n = 4 independent experiments; *, p < 0.05. B, untreated or treated HeLa cells with 100 μg/ml non-labeled SiNPs (NL-NPs) were incubated as above and then analyzed by Western blotting LC3. The LC3-II/LC3-I ratio was quantified and normalized to untreated control cells. Shown are non-starved control cells (set to 1), starved control cells (1.69 ± 0.2), starved control cells treated with 100 nm bafilomycin A1 (3.49 ± 0.3), non-starved cells incubated with NL-NPs (2.41 ± 0.2), starved NL-NP-treated cells in the absence (2.83 ± 0.5) or presence of 100 nm bafilomycin A1 (3.76 ± 0.4). Data are the mean ± S.E.; n = 4 independent experiments; *, p < 0.05; ***, p < 0.001. C, left, confocal images of untreated or treated HeLa cells with 100 μg/ml FITC-NPs or NL-NPs and incubated as above. After fixation, cells were stained for LC3. Right, quantification of LC3 puncta per cell of every condition: non-starved control cells (21.37 ± 10), starved control cells (53.63 ± 19), starved control cells treated with 100 nm bafilomycin A1 (80.61 ± 16.6), non-starved cells incubated with FITC-NPs (75.56 ± 4.5), starved FITC-NP-treated cells in the absence (74.99 ± 7.5) or presence of 100 nm bafilomycin A1 (66.11 ± 3.5), non-starved cells incubated with NL-NPs (84.72 ± 13.3), starved NL-NP-treated cells in the absence (67.47 ± 11.7) or presence of 100 nm bafilomycin A1 (76.96 ± 18.7). Data are the mean ± S.E.; n = 3 independent experiments; *, p < 0.05.
FIGURE 6.
FIGURE 6.
Lysosomal SiNP accumulation did not alter mTORC1 signaling. A, left, immunoblot analysis of control cells or cells treated with 100 μg/ml SiNPs for phospho-ULK1 (Ser-757) and phospho-p70 S6K (Thr-389). Baf A1 (100 nm) was added to the medium (for 4 h) where indicated. Actin served as loading control. Middle, quantification of phospho-ULK1: non-starved (set to 1), non-starved + Baf A1 (1.12 ± 0.06), starved (0.22 ± 0.08), SiNPs (1.12 ± 0.08), SiNPs+ Baf A1 (1.26 ± 0.19). Right, quantification of phospho-S6K: non-starved (set to 1), non-starved + Baf A1 (0.72 ± 0.10), starved (0.40 ± 0.07), SiNPs (0.93 ± 0.10), SiNPs + Baf A1 (0.90 ± 0.07). B, left, immunoblot analysis of control cells or cells treated with 100 μg/ml SiNPs of SiNPs for total levels of ULK1 and p70 S6K. Baf A1 (100 nm) was added to the medium (for 4 h) where indicated. Actin served as the loading control. Middle, quantification of total-ULK1: non-starved (set to 1), non-starved + Baf A1 (1.4 ± 0.2), starved (0.9 ± 0.1), NPs (1.6 ± 0.3), NPs + Baf A1 (1.4 ± 0.4). Right, quantification of total p70 S6K: non-starved (set to 1), non-starved + Baf A1 (1.2 ± 0.2), starved (1.0 ± 0.2), NPs (1.0 ± 0.1), NPs + Baf A1 (1.2 ± 0.2). Data are presented as the mean ± S.E. for n = 3 independent experiments; *, p < 0.05; **, p < 0.01; ***, p < 0.001.
FIGURE 7.
FIGURE 7.
SiNP accumulation did not affect endocytosis or recycling of Tf but impaired EGF degradation and resulted in the accumulation of non-degraded EGF in late endosomes. A, confocal microscopy images show Alexa647-transferrin (Tf-647) levels in control (ctrl) and SiNP-treated (+NPs) HeLa cells at three different time points. Nuclei were stained with DAPI (blue). Quantified is the Tf-647 fluorescence intensity in cells incubated with SiNPs (+NPs) compared with control cells (ctrl). Intensity values at 5 min were set to 100% to monitor the recycling process. At 15 min post-chase with unlabeled Tf the levels of Tf-647 were reduced to 52 ± 17% in control cells versus 47 ± 11% in SiNP-treated cells. At 60 min post-chase with unlabeled Tf levels of Tf-647 were reduced to 12 ± 4% in control (control) cells versus14 ± 9% in SiNP-treated cells. Data represent the mean ± S.E., n = 3 independent experiments. Scale bar, 10 μm. ns, not significant. B, unaltered surface levels of Tf receptors in control (ctrl) (set to 100%) and SiNP-treated HeLa cells (+NPs) (115 ± 8%, ns = non-significant). HeLa cells were incubated with Tf-647 at 4 °C to allow for Tf receptor engagement in the absence of internalization, washed extensively, and analyzed by immunofluorescence microscopy. Data represent the mean ± S.E., n = 4 independent experiments. C, left, confocal images of Alexa647-EGF (red) internalized into control (ctrl) or SiNP (green)-treated HeLa cells chased for the indicated time points post-internalization. DAPI (blue), nuclei. Right, quantitation of Alexa647-EGF fluorescence intensity of control (ctrl) or SiNP-treated HeLa cells (+NPs, either FITC-labeled (+FITC) or unlabeled (−FITC)). Intensity values at 30 min were set to 100%. Degradation of EGF was significantly impaired at 60 min (EGF remaining: control (8.4 ± 1.9%) versus NP+FITC (52.4 ± 9.6%); NP−FITC, 42.3 ± 4.5%) and 120 min of chase (EGF remaining: control (2.2 ± 0.7%) versus NP+FITC (26.3 ± 1.3%) and NP−FITC, 30.1 ± 4.8%] in SiNP-treated cells. Data are the mean ± S.E., n = 3 independent experiments; *, p < 0.05; **, p < 0.01; ***, p < 0.001. Scale bar, 10 μm. D, unaltered surface levels of EGF receptors in control (ctrl) (set to 100%) and SiNP-treated HeLa cells (+NPs) (93.3 ± 5.3%) kept at 4 °C. Data are the mean ± S.E., n = 4 independent experiments. E, immunoblot analysis of EGF signaling responses of control (ctrl) or SiNP-treated HeLa cells. Shown are immunoblots for: phosphorylated EGF receptor (pEGFR), total EGF receptor (EGFR), phosphorylated Erk1/2 kinase (pErk 1/2), and total Erk1/2 kinase (Erk). Hsp70 served as the loading control. F, non-degraded EGF accumulates in late endosomes. Confocal microscopy analysis of the localization of non-degraded Alexa647-EGF accumulated in SiNP-treated HeLa cells. Fraction of Alexa647-EGF in immunopositive compartments: LAMP1 (late endosomes/lysosomes), 47.79 ± 0.09%; CD63 (late endosomes/lysosomes), 55.38 ± 0.08%; EEA1 (early endosomes), 17.22 ± 0.03%; p62 (autophagosomes), 7.43 ± 3.42%; M6PR (trans-Golgi network/endosomes), 7.48 ± 1.49%; LC3 (autophagosomes), 7.16 ± 1.83%. Data are the mean ± S.E., n = 3 independent experiments. G, non-degraded EGF accumulates in late endosomes. Representative confocal images of SiNPs-treated HeLa cells 120 min after the addition of Alexa647-EGF. To assess the localization of non-degraded EGF, cells were counterstained for different organellar markers: LAMP1 (late endosomes/lysosomes), CD63 (late endosomes/lysosomes), EEA1 (early endosomes), p62 (autophagosomes), M6PR (trans-Golgi network/endosomes), or LC3 (autophagosomes). Scale bar, 10 μm.
FIGURE 8.
FIGURE 8.
Effects of SiNP accumulation in lysosomes on lysosomal acidification and cathepsin activity. A, representative confocal images showing colocalization of OGD with the late endosomal/lysosomal marker CD63 in control (ctrl) and SiNP-treated HeLa cells shown by confocal imaging. B, quantitative analysis of data shown in A. Pearson's correlation coefficients were determined for OGD and CD63 (ctrl, 0.41 ± 0.03; +NPs, 0.49 ± 0.05, respectively) and OGD and LAMP1 (control, 0.42 ± 0.06; +NPs, 0.40 ± 0.05, respectively), mean ± S.E.; n = 3 independent experiments. C, SiNP accumulation does not impair lysosomal acidification. Ratiometric measurement of intralysosomal pH of control (ctrl, pH 3.9 ± 0.1) or SiNP-treated HeLa cells (+NPs, pH 4.5 ± 0.1) Data are the mean ± S.E.; n = 5 independent experiments; **, p < 0.01. D and E, live cell confocal images show the localization of hydrolyzed fluorescent cathepsin B (D) or cathepsin L (E) products (red) in the control (upper panel) and SiNP (green)-treated HeLa cells (lower panel). Elevated activities of cathepsins B (259.8 ± 56.1%) and L (306.5 ± 84.5%) in SiNP-treated HeLa cells compared with controls (set to 100%). Data are the mean ± S.E., n = 3 independent experiments; *, p < 0.05. ns, not significant.
FIGURE 9.
FIGURE 9.
Lysosomal accumulation of SiNPs impaired autophagosome-lysosome fusion. A, representative confocal images depicting the distribution of LC3, p62 and cathepsin B (red channel)- in FITC-SiNP (green)-treated HeLa cells. Scale bars, 10 μm. B, quantitative analysis of data shown in A. Pearson's correlation analysis shows lack of colocalization between LC3 (0.111 ± 0.006) and p62 (−0.005 ± 0.031) with SiNPs. Fluorescent cathepsin products strongly colocalize with SiNPs (0.58 ± 0.04 for cathepsin B and 0.51 ± 0.05 for cathepsin L). Data are the mean ± S.E., n = 3 independent experiments. C, HeLa cells were transiently transfected with an RFP-GFP tandem fluorescent-tagged LC3. After 24 h, cells were or not treated with 100 μg/ml non-labeled siNPs for 24 h and incubated in complete DMEM medium and in serum-free starvation medium for 4 h in the presence or absence of bafilomycin A1 (100 nm). Left, live confocal images of the different treatments as indicated. Right, the number of yellow puncta (autophagosomes) and the number of RFP LC3-positive puncta (autolysosomes) in the merged images were counted, and the total number of puncta per cell was calculated as percentage. Data are presented as the mean ± S.E., n = 3 independent experiments; *, p < 0.05.
FIGURE 10.
FIGURE 10.
Schematic model illustrating the effect of SiNPs on the endolysosomal system. Under control conditions (−SiNPs, left), receptor-bound EGF is sorted into late endosomes (LE), which eventually fuse with lysosomes. LC3- and p62-containing autophagosomes also fuse with lysosomes for degradation. SiNP accumulation in lysosomes (+SiNPs, right) inhibits fusion of both late endosomes and autophagosomes with lysosomes, resulting in impaired degradation of EGF/EGFR and elevated levels of LC3- and p62-positive autophagosomes.

References

    1. Cheng Z., Al Zaki A., Hui J. Z., Muzykantov V. R., and Tsourkas A. (2012) Multifunctional nanoparticles: cost versus benefit of adding targeting and imaging capabilities. Science 338, 903–910 - PMC - PubMed
    1. Sengupta S., Eavarone D., Capila I., Zhao G., Watson N., Kiziltepe T., and Sasisekharan R. (2005) Temporal targeting of tumour cells and neovasculature with a nanoscale delivery system. Nature 436, 568–572 - PubMed
    1. Hirsch L. R., Stafford R. J., Bankson J. A., Sershen S. R., Rivera B., Price R. E., Hazle J. D., Halas N. J., and West J. L. (2003) Nanoshell-mediated near-infrared thermal therapy of tumors under magnetic resonance guidance. Proc. Natl. Acad. Sci. U.S.A. 100, 13549–13554 - PMC - PubMed
    1. Santra S., Zhang P., Wang K., Tapec R., and Tan W. (2001) Conjugation of biomolecules with luminophore-doped silica nanoparticles for photostable biomarkers. Anal. Chem. 73, 4988–4993 - PubMed
    1. Zhang F. F., Wan Q., Li C. X., Wang X. L., Zhu Z. Q., Xian Y. Z., Jin L. T., and Yamamoto K. (2004) Simultaneous assay of glucose, lactate, l-glutamate and hypoxanthine levels in a rat striatum using enzyme electrodes based on neutral red-doped silica nanoparticles. Anal. Bioanal. Chem. 380, 637–642 - PubMed

Publication types

Substances

LinkOut - more resources