. 2016 Jul 8;291(28):14483-98.
doi: 10.1074/jbc.M116.721415. Epub 2016 May 12.

How Phosphorylation and ATPase Activity Regulate Anion Flux though the Cystic Fibrosis Transmembrane Conductance Regulator (CFTR)

Affiliations

How Phosphorylation and ATPase Activity Regulate Anion Flux though the Cystic Fibrosis Transmembrane Conductance Regulator (CFTR)

Matthias Zwick et al. J Biol Chem. .

Erratum in

Abstract

The cystic fibrosis transmembrane conductance regulator (CFTR, ABCC7), mutations of which cause cystic fibrosis, belongs to the ATP-binding cassette (ABC) transporter family and works as a channel for small anions, such as chloride and bicarbonate. Anion channel activity is known to depend on phosphorylation by cAMP-dependent protein kinase A (PKA) and CFTR-ATPase activity. Whereas anion channel activity has been extensively investigated, phosphorylation and CFTR-ATPase activity are still poorly understood. Here, we show that the two processes can be measured in a label-free and non-invasive manner in real time in live cells, stably transfected with CFTR. This study reveals three key findings. (i) The major contribution (≥90%) to the total CFTR-related ATP hydrolysis rate is due to phosphorylation by PKA and the minor contribution (≤10%) to CFTR-ATPase activity. (ii) The mutant CFTR-E1371S that is still conductive, but defective in ATP hydrolysis, is not phosphorylated, suggesting that phosphorylation requires a functional nucleotide binding domain and occurs in the post-hydrolysis transition state. (iii) CFTR-ATPase activity is inversely related to CFTR anion flux. The present data are consistent with a model in which CFTR is in a closed conformation with two ATPs bound. The open conformation is induced by ATP hydrolysis and corresponds to the post-hydrolysis transition state that is stabilized by phosphorylation and binding of chloride channel potentiators.

Keywords: ABC transporter; biosensor; cyclic AMP (cAMP); cystic fibrosis transmembrane conductance regulator (CFTR); protein kinase A (PKA).


Figures

FIGURE 1.
FIGURE 1.
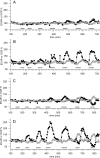
A–D, ECAR and OCR of CHO-K1 and CHO-CFTR cells upon titration with CPT-cAMP and forskolin measured with a Bionas Discovery® 2500. ECAR (■) and OCR (▵) of CHO-K1 (A) and CHO-CFTR cells (B) at increasing concentrations of CPT-cAMP (CCPT = 1, 5, 10, 50, 100, 200, and 320 μm) are shown. ECAR (■) and OCR (▵) of CHO-K1 (C) and CHO-CFTR cells (D) at increasing concentrations of forskolin (Cfsk, applied = 0.1, 1, 2, 5, 10, 50, and 100 μm) are shown. Measurements were performed at 37 °C. Rates were measured for 2 min, followed by 2 min of flushing with flow medium; a measurement point was thus generated every 4 min. Horizontal lines indicate the presence of phosphorylation agents in flow medium. Cells were stimulated with phosphorylation agents during 24 min at low concentrations and 32 min at higher concentrations. The concentrations given correspond to the concentrations applied; as the hydrophobic forskolin adsorbed to the tubing system, the concentrations reaching the measuring chambers were somewhat lower. Washout with pure flow medium after application of high forskolin concentrations induced an ECAR re-bounce due to forskolin dilution.
FIGURE 2.
FIGURE 2.
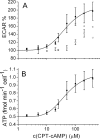
A and B. ECAR of CHO-K1 and CHO-CFTR cells as a function of CPT-cAMP concentration. ECAR of CHO-K1 (□) and CHO-CFTR (■) cells measured with a Molecular Dynamics Cytosensor at 37 °C for 30 s every 2 min is shown. A, either the average of the last four points of the measurements during perfusion with CPT-cAMP for ∼20 min (ECAR maximum) (■) or 40 min (*) was normalized to the basal value before stimulation and was plotted against CPT-cAMP concentration. Extended superfusion (40 min) at high forskolin concentrations was used to monitor a potential ECAR decrease, reflecting the transition from glycolysis to respiration (see Fig. 1). Error bars represent the standard deviation of 3–6 measurements. For clarity, errors bars are shown only for ECAR maxima but are in the same order of magnitude for ECAR after 40 min. The solid line represents the best fit of Equation 3 to the ECAR data with a dissociation constant for CPT-cAMP, Kd, app = 8.5 μm and an ECARmax = 209%. CHO-K1 cells start to respond only at concentrations higher than 50 μm resulting in a maximum ECAR of 130% at 400 μm CPT-cAMP. B, ECAR was transformed to the rate of ATP synthesis/hydrolysis taking into account the OCR data of Fig. 1B.
FIGURE 3.
FIGURE 3.
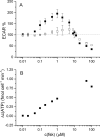
A and B. ECAR of CHO-K1 and CHO-CFTR cells as a function of forskolin concentration. ECAR of CHO-K1 (□) and CHO-CFTR (■) cells measured in a Molecular Dynamics Cytosensor at 37 °C for 30 s every 2 min. A, last four points of measurements (8 min) during perfusion with forskolin were averaged, normalized to the basal value before stimulation, and plotted against forskolin concentration. Error bars represent the standard deviation of 2–4 experiments. ECAR response of CHO-CFTR cells showed an increase at lower and a decrease at higher concentrations with a maximum of 195 ± 19% of basal ECAR at 1 μm forskolin. CHO-K1 cells only responded at concentrations Cfsk >10 μm with a minimal ECAR of 35% at Cfsk = 100 μm. The dotted line shows the basal ECAR to guide the eye. B, rate of ATP synthesis/hydrolysis was roughly estimated taking into account the OCR data of Fig. 1D.
FIGURE 4.
FIGURE 4.
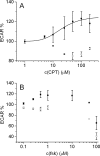
A and B. ECAR of BHK cells overexpressing CFTR variants as a function of CPT-cAMP and forskolin concentration. ECAR of BHK-CFTR (■) and BHK-E1371S (○) cells measured in a Molecular Dynamics Cytosensor at 37 °C is shown. Error bars represent the standard deviation of 2–4 experiments. A, for BHK-CFTR cells stimulation with CPT-cAMP resulted in a maximal ECAR of 123 ± 7% at CCPT = 100 μm; in BHK-E1371S cells the ECAR is slightly reduced to a minimum of 84 ± 4% at CCPT = 50 μm relative to basal values. The solid line represents a fit of Equation 3 to data with a dissociation constant for CPT-cAMP, Kd, app = 3.7 μm and an ECARmax = 125%. B, upon titration with forskolin, a maximal ECAR of 117 ± 4% is stably reached for concentrations 0.5 < Cfsk ≤ 10 μm in BHK-CFTR cells. BHK-E1371S cells show a reduction down to 91 ± 3% in this concentration range. At concentrations Cfsk ≥10 μm, a decrease in ECAR of both cell lines was observed.
FIGURE 5.
FIGURE 5.
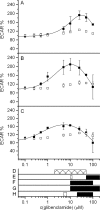
A–H. Effect of glibenclamide on ECAR and iodide efflux in comparison with published data on channel function. A–C, ECAR as a function of glibenclamide concentration in CHO-K1 (□) and CHO-CFTR (■) cells after stimulation with CPT-cAMP concentrations CCPT = 5 μm (A), CCPT = 25 μm (B), or CCPT = 50 μm (C). The solid lines are fits of Equation 4 to the data. D, concentration range where no enhancement (cross-hatched bars) of iodide efflux was observed after stimulation with CCPT = 25 μm. It has to be noted that an unspecific increase of iodide efflux in control cells and transfected cells was observed for concentrations Cglib ≥10 μm. E, glibenclamide concentrations causing no effect (cross-hatched) or inhibition (filled bars) of short-circuit current stimulated by 100 μm CPT-cAMP in CFTR-expressing FRT cells (89). F, inhibitory concentrations of glibenclamide detected in analysis of single-channel patch clamp experiments in stably transfected C127 cells in the presence of PKA (90). G and H, concentration range reported to cause channel block by glibenclamide in excised patches from Xenopus oocytes in the presence of 50 units/ml PKA (91). Data obtained from biological triplicates are shown with standard deviations.
FIGURE 6.
FIGURE 6.
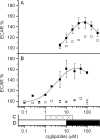
A and B. Effect of glipizide on ECAR and iodide efflux in comparison with published results on channel function. A and B, ECAR as a function of glipizide concentration in CHO-K1 (□) and CHO-CFTR (■) cells after stimulation with CCPT = 25 μm (A) or CCPT = 50 μm (B). The solid lines are fits of Equation 4 to the data. C, concentration range where no enhancements on iodide efflux after stimulation with CCPT = 25 μm were observed. D, concentration range reported to cause channel block by glipizide in excised patches from Xenopus oocytes in the presence of PKA (91). Data obtained from biological duplicates are shown with standard deviations.
FIGURE 7.
FIGURE 7.
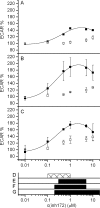
A–C. Effects of CFTRinh-172 on ECAR and iodide efflux in comparison with published results on channel function. A–C, ECAR as a function of CFTRinh-172 concentration in CHO K1 (□) and CHO-CFTR (■) cells after stimulation with CCPT = 5 μm (A), CCPT = 25 μm (B), and CCPT = 50 μm (C). The solid lines are fits of Equation 4 to the data. D, concentration range where no enhancement of channel function was observed in iodide efflux experiments after stimulation with CCPT = 25 μm. E, inhibition of channel function described in literature for iodide influx after stimulation with an CFTR activating mixture containing 5 μm forskolin, 100 μm Isobutylmethylxanthine, and 25 μm apigenin (89). F, concentration range reported to cause inhibition of CFTR-dependent short-circuit current after stimulation with 100 μm CPT-cAMP (89). G, concentration range described to block CFTR in excised patches from transfected mouse embryo fibroblasts (92). Data obtained from biological duplicates are shown with standard deviations.
FIGURE 8.
FIGURE 8.
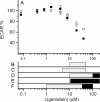
A–F. Effects of genistein on ECAR and iodide efflux in comparison with published results on channel function. A, ECAR as a function of genistein concentration in CHO K1 (□) and CHO-CFTR (■) cells after stimulation with CCPT = 50 μm. B, concentration range where potentiation (hatched) or inhibition (filled bars) of channel function was observed in iodide efflux experiments after stimulation with CCPT = 25 μm. C–F, effects on channel function described in literature for iodide influx in FRT cells after stimulation with 0.1 μm forskolin (C) (93), short-circuit current measurements in the presence of 5 μm (D), or 100 μm CPT-cAMP (E) (62) or patch clamp measurements in excised patches after stimulation with 0.05 μm forskolin (F) (94). Symbols have the same meaning as in B. Data obtained from biological duplicates are shown with standard deviations.
FIGURE 9.
FIGURE 9.
A and B. Effects of capsaicin on ECAR in comparison with published results on channel function. A, ECAR as a function of capsaicin concentration in CHO K1 (□) in the presence of 50 μm CPT-cAMP and CHO-CFTR cells in the presence of CCPT = 50 μm (■), CCPT = 25 μm (Δ), or CCPT = 5 μm (*). B, concentration range reported to cause potentiation by capsaicin whole cell patch clamp experiments in the presence of 10 μm forskolin (95). Data obtained from biological duplicates are shown with standard deviations. Titration curves are fitted with Equation 4.
FIGURE 10.
FIGURE 10.
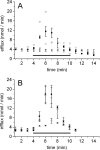
A and B. Effects of CPT-cAMP and forskolin on iodide efflux of CHO-CFTR cells. CHO-CFTR cells were loaded with sodium iodide, and the recorded efflux rates were plotted against time. Horizontal bars indicate stimulation with 50 μm (*), 100 μm (○), 200 μm (■), and 400 μm (▿) CPT-cAMP (A) or with 0.5 μm (*), 5 μm (○) and 10 μm (■) forskolin (B).
FIGURE 11.
FIGURE 11.
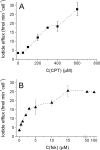
A and B. Maximum iodide efflux per CHO-CFTR cell as a function of the concentration of phosphorylation agents. A, stimulation with CPT-cAMP (■). B, stimulation with forskolin (▴). Error bars represent the standard deviation of three experiments. Dotted lines were added to guide the eye.
FIGURE 12.
FIGURE 12.
Total CFTR-related ATP hydrolysis rate versus maximum iodide efflux. The total CFTR-related ATP synthesis/hydrolysis rate was derived from ECAR and OCR measurements at superfusion with phosphorylation agents for 6 min to approximate the time frame of iodide efflux measurements more closely. Iodide efflux increased with the total CFTR-related ATP hydrolysis rate up to a certain value in the presence of both CPT-cAMP (■) and forskolin (○). At high concentrations of both phosphorylation agents, the iodide efflux increased in an ATP-independent manner. The amount of ATP required for a given iodide efflux was significantly higher upon phosphorylation with forskolin than upon phosphorylation with CPT-cAMP. Because it can be assumed that PKA and CFTR require the same amount of ATP under both conditions, the surplus in ATP hydrolysis in the presence of forskolin can be attributed to the synthesis of cAMP from ATP catalyzed by adenylate cyclase. Dotted lines were added to guide the eye.
SCHEME 1.
SCHEME 1.
Scheme proposed for the catalytic cycle of CFTR. CFTR with two molecules of ATP bound (CFTR(ATP/ATP)) corresponds to the outward closed conformation (81). In this conformation a drug, D (e.g. chloride channel potentiator or inhibitor), can enter the cavity from the cytosolic leaflet of the membrane. Upon hydrolysis and release of inorganic phosphate, Pi, the post-hydrolysis transition state of CFTR is reached (CFTR(D)(ATP/ADP)). The post-hydrolysis transition state corresponds to the outward open conformation that allows for anion flux through CFTR. In cells the post-hydrolysis transition state is stabilized by the R-domain that adopts a net negative charge upon phosphorylation as indicated by the red circle. The high net negative charge in the vicinity of the NBDs may prevent nucleotide exchange by electrostatic repulsion and may delay anion channel closing. CFTR with an empty NBD2 (CFTR(ATP/−) is still open but short lived. The rate constant, k1, includes drug, D, binding from the lipid membrane to the TMDs of CFTR and release of inorganic phosphate upon ATP hydrolysis. The rate constant, k2, includes drug transport or flopping and release, which may be rate-limiting (36, 45) as well as ADP release. The rate constant, k3, corresponds to ATP binding and concomitant squeeze-out of the drug, D, that has not left the transporter cavity before. The apo-conformation was not considered, because the cellular ATP concentration is typically CATP = 1–10 mm (96, 97), and the concentration of half-maximum activation of CFTR by ATP was determined as K0.5 ≈50 μm for CFTR (27).

References

    1. Riordan J. R. (2008) CFTR function and prospects for therapy. Annu. Rev. Biochem. 77, 701–726 - PubMed
    1. Qin L., Zheng J., Grant C. E., Jia Z., Cole S. P., and Deeley R. G. (2008) Residues responsible for the asymmetric function of the nucleotide binding domains of multidrug resistance protein 1. Biochemistry 47, 13952–13965 - PubMed
    1. Gadsby D. C., Vergani P., and Csanády L. (2006) The ABC protein turned chloride channel whose failure causes cystic fibrosis. Nature 440, 477–483 - PMC - PubMed
    1. Bozoky Z., Krzeminski M., Chong P. A., and Forman-Kay J. D. (2013) Structural changes of CFTR R region upon phosphorylation: a plastic platform for intramolecular and intermolecular interactions. FEBS J. 280, 4407–4416 - PMC - PubMed
    1. Aleksandrov A. A., and Riordan J. R. (1998) Regulation of CFTR ion channel gating by MgATP. FEBS Lett. 431, 97–101 - PubMed

Publication types

Substances

LinkOut - more resources