. 2016 Jul 15;291(29):15156-68.
doi: 10.1074/jbc.M116.732503. Epub 2016 May 23.

A Camelid-derived Antibody Fragment Targeting the Active Site of a Serine Protease Balances between Inhibitor and Substrate Behavior

Affiliations

A Camelid-derived Antibody Fragment Targeting the Active Site of a Serine Protease Balances between Inhibitor and Substrate Behavior

Tobias Kromann-Hansen et al. J Biol Chem. .

Abstract

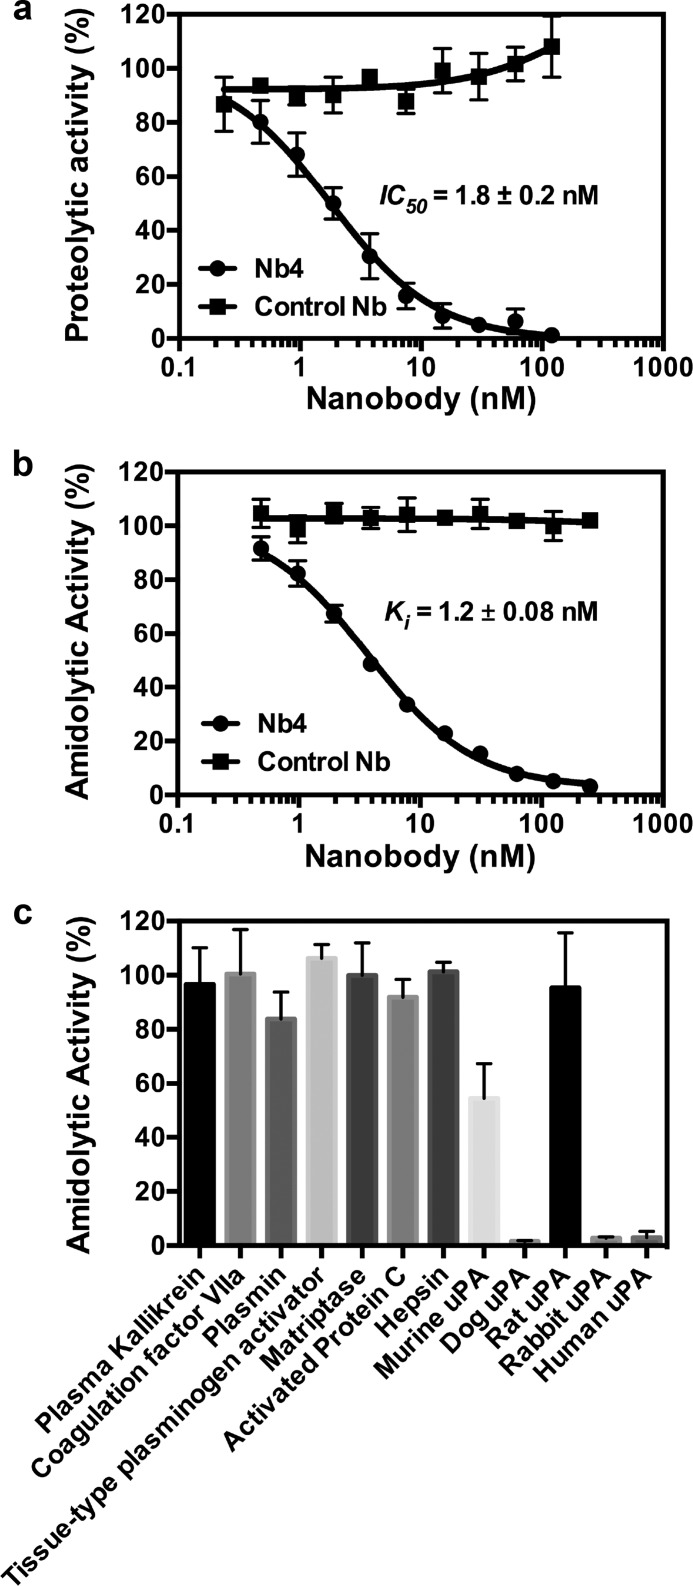
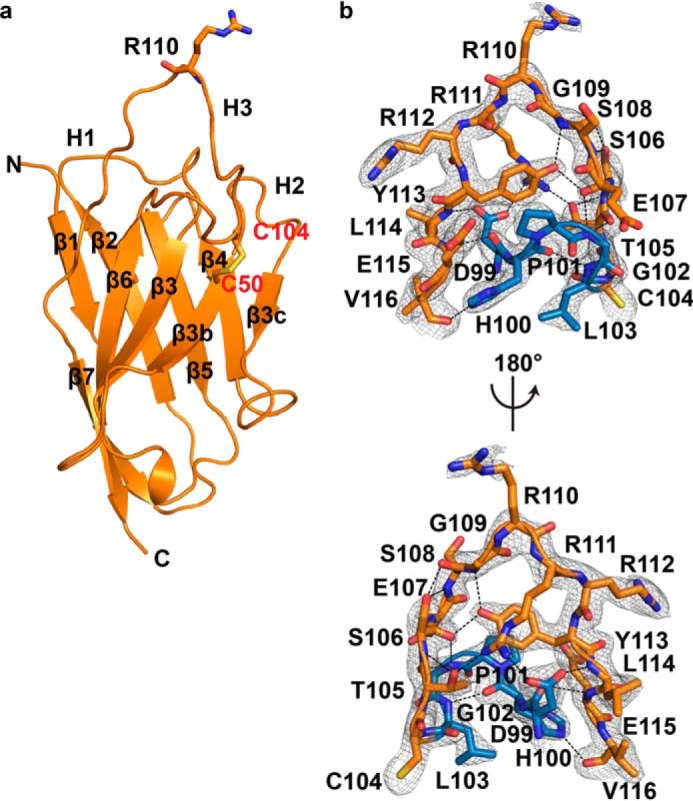
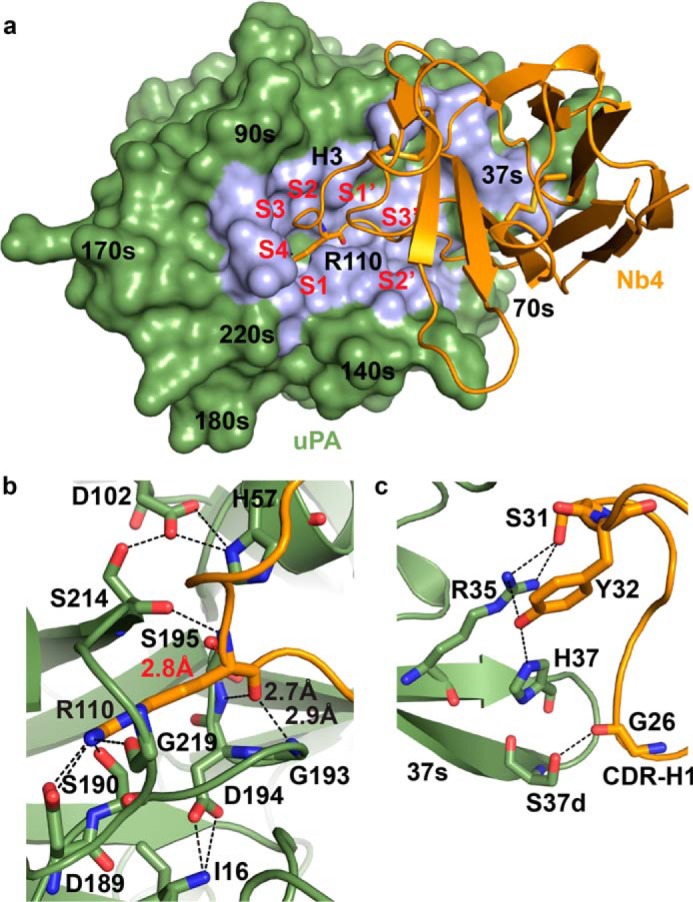
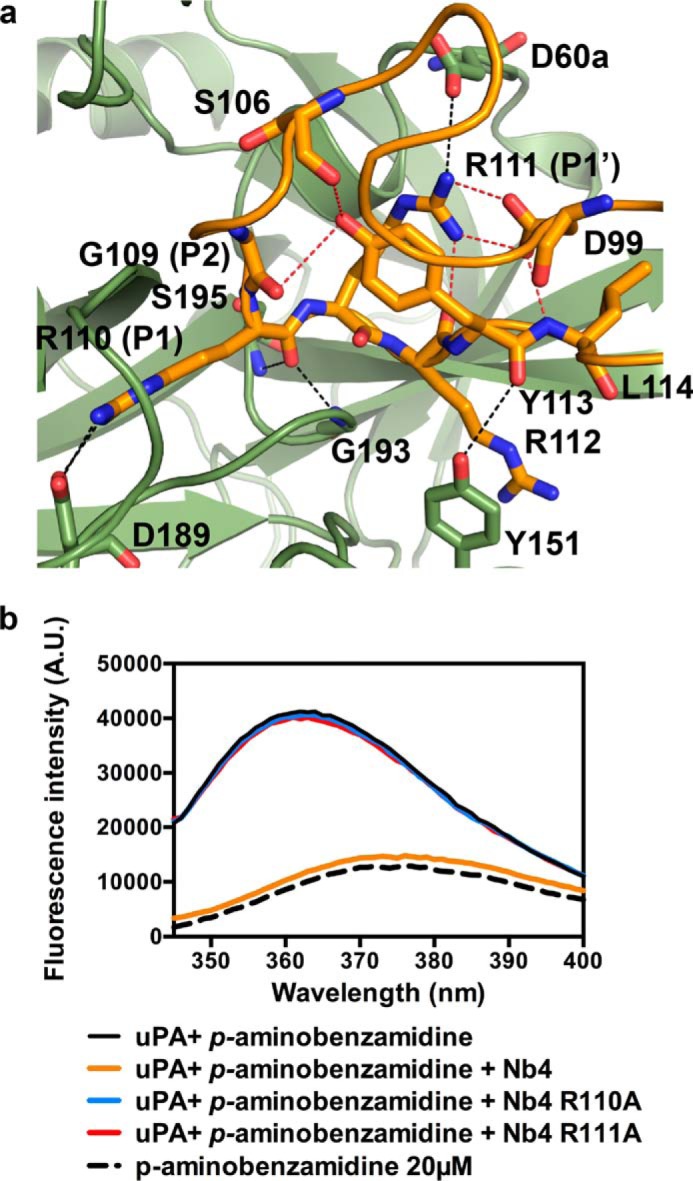
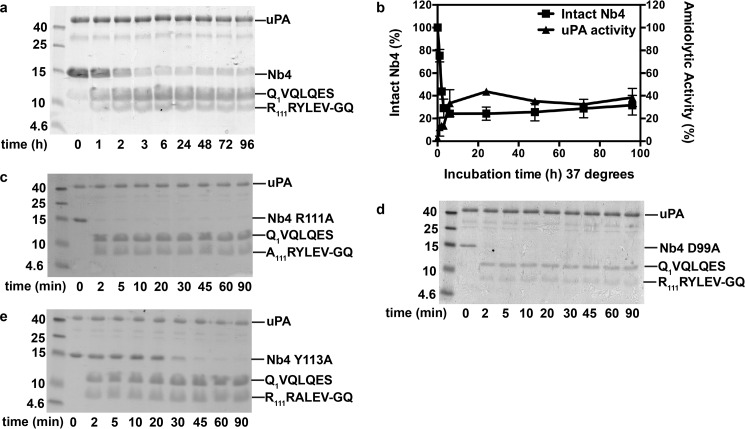
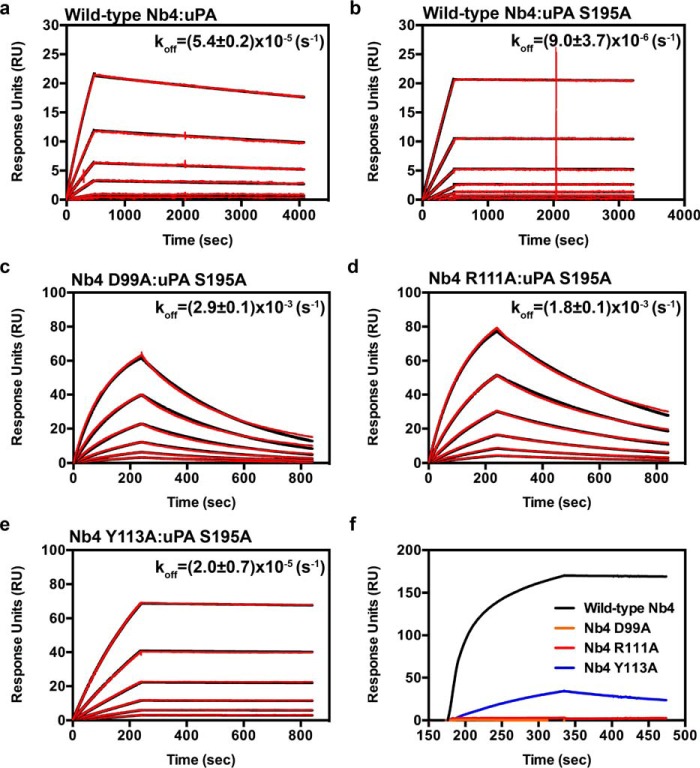
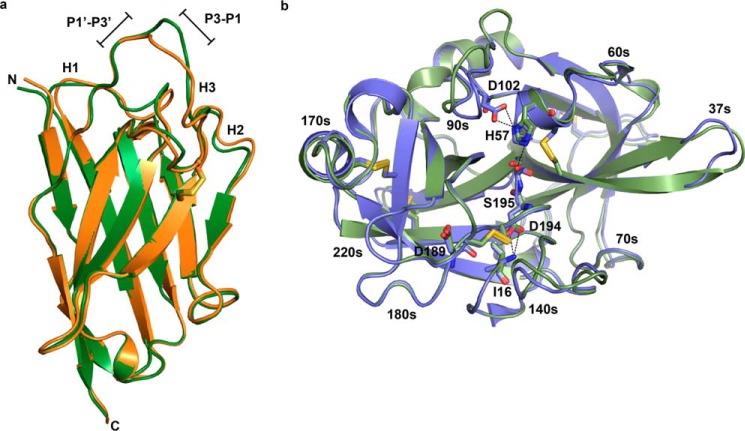
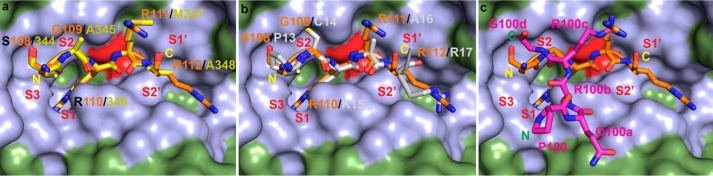
A peptide segment that binds the active site of a serine protease in a substrate-like manner may behave like an inhibitor or a substrate. However, there is sparse information on which factors determine the behavior a particular peptide segment will exhibit. Here, we describe the first x-ray crystal structure of a nanobody in complex with a serine protease. The nanobody displays a new type of interaction between an antibody and a serine protease as it inserts its complementary determining region-H3 loop into the active site of the protease in a substrate-like manner. The unique binding mechanism causes the nanobody to behave as a strong inhibitor as well as a poor substrate. Intriguingly, its substrate behavior is incomplete, as 30-40% of the nanobody remained intact and inhibitory after prolonged incubation with the protease. Biochemical analysis reveals that an intra-loop interaction network within the complementary determining region-H3 of the nanobody balances its inhibitor versus substrate behavior. Collectively, our results unveil molecular factors, which may be a general mechanism to determine the substrate versus inhibitor behavior of other protease inhibitors.

Keywords: biophysics; biotechnology; serine protease; single-domain antibody (sdAb, nanobody); x-ray crystallography.


Figures

FIGURE 1.
FIGURE 1.
Characterization of an anti-uPA inhibitory nanobody. a, Nb4 or a control nanobody at the indicated concentration was incubated with uPA (0.25 nm) before adding plasminogen (100 nm) and the chromogenic plasmin substrate S-2251 (0.5 mm). The IC50 value was calculated by non-linear regression. b, Nb4 or a control nanobody at the indicated concentration was incubated with uPA (2 nm) before addition of the chromogenic substrate CS-61(44) (47 μm). The inhibitory constant (Ki) was determined by non-linear regression. c, Nb4 (4 μm) were incubated with uPA-related trypsin-like serine proteases or uPA from other species. Chromogenic substrates were added to measure the effect of Nb4 on the amidolytic activity of the proteases. Error bars show the standard deviation from three experiments.
FIGURE 2.
FIGURE 2.
Crystal structure of Nb4. a, typical β-strand arrangement of the immunoglobulin domain of Nb4 is indicated along with the three CDR loops (H1, H2, and H3). The exposed Arg-110 at the tip of the CDR-H3 loop is show as sticks. The extra Cys-50–Cys-104 disulfide bond is indicated in red. b, CDR-H3 (DHPGLCTSESGRRRYLEV) is shown as sticks. The N-terminal part (99DHPGL103) is colored blue, and the C-terminal part (105TSESGRRRYLEV116) is colored orange. Black dashed lines show the intra-loop hydrogen bond network. The 2mFo − DFc electron density map (grey mesh) is contoured at 1σ over mean.
FIGURE 3.
FIGURE 3.
Crystal structure of the uPA-Nb4 complex. a, interaction of Nb4 (orange) with uPA (green) is primarily mediated by the CDR-H3, which interacts in a substrate-like manner with the substrate-binding pockets in the active site region of uPA (S4-S3′). The Nb4-uPA interaction surface is colored light blue. b, enlarged view of the P1-S1 interactions. The P1 Arg-110 of Nb4 (orange) inserts into the S1 pocket of uPA (green) to form interactions with Asp-189 at the bottom of the pocket. The carbonyl oxygen atom of Arg-110 is aligned in a substrate-like manner in the oxyanion hole, and the distance from the oxygen atom of the catalytic Ser-195 in uPA to the P1 carbonyl group in Nb4 is 2.8 Å (indicated in red). c, exosite interactions between the CDR-H1 of Nb4 (orange) and the 37s loop of uPA (green). Polar interactions are indicated as black dashed lines.
FIGURE 4.
FIGURE 4.
Intra-loop interaction network in the CDR-H3 of Nb4. a, shown is the CDR-H3 of Nb4 (orange) and the catalytic site of uPA (green). Red dashed lines indicate the intra-loop interaction network involving Asp-99, Arg-111, and Tyr-113. Black dashed lines indicate the interactions between the residues involved in the intra-loop hydrogen bond network and uPA. b, emission spectra of p-aminobenzamidine (20 μm, black dashed curve) in solution or when bound to uPA (0.4 μm, black solid curve) and in the presence of 500 nm wild-type Nb4 (orange), Nb4 R110A (blue), or Nb4 R111A (red). The excitation wavelength used was 335 nm. The curves are representative of three individual experiments.
FIGURE 5.
FIGURE 5.
Intra-loop hydrogen interaction network is decisive for the inhibitor versus substrate behavior of Nb4. a, proteolytic cleavage of Nb4 (3 μg) by uPA (3 μg) visualized by non-reduced SDS-PAGE analysis at different time points. The N-terminal sequence of the cleavage products is indicated to the right. b, on the left y axis is shown the quantification by densitometry of intact Nb4 at the indicated time points after incubation with uPA. On the right y axis is shown the remaining amidolytic activity of uPA hydrolysis of CS-61(44) (47 μm) after incubation with Nb4 for the indicated time points. Error bars show the standard deviation from three experiments. c, proteolytic cleavage of Nb4 R111A (3 μg) by uPA. d, proteolytic cleavage of Nb4 D99A (3 μg) by uPA. e, proteolytic cleavage of Nb4 Y113A (3 μg) by uPA. The N-terminal sequence of the cleavage products is indicated to the right.
FIGURE 6.
FIGURE 6.
Surface plasmon resonance sensorgrams. Determination of kinetics of binding of wild-type Nb4 to active uPA (a) and wild-type Nb4 (b), Nb4 D99A (c), Nb4 R111A (d), and Nb4 Y113A (e) to catalytically inactive uPA S195A. The experimental data (red curves) were fitted to a 1:1 binding model (black curves) by the BIAcore evaluation software. Sensorgrams are representative of three experiments, and the dissociation rate (koff) is indicated above the curves. f, SPR sensorgram for the binding of wild-type Nb4 (black), Nb4 D99A (orange), Nb4 R111A (red), and Nb4 Y113A (blue) to active uPA.
FIGURE 7.
FIGURE 7.
Conformational changes associated with complex formation between uPA and Nb4. a, crystal structure of Nb4 in its free form (green) was superimposed (root mean square of all atoms is 1.377Å2) to Nb4 in its uPA-bound form (orange). The small conformational change in the P3-P1 segment of the CDR-H3 is highlighted. b, uPA (green) from the crystal structure of uPA in complex with Nb4 was superimposed (root mean square of all atoms 1.282 Å2) to uPA (blue) in its free form (PDB code 4DVA). The catalytic triad (His-57, Asp-102, and Ser-195), Asp-189, Asp-194, and Ile-16, is shown as sticks.
FIGURE 8.
FIGURE 8.
CDR-H3 of Nb4 adopts a substrate-like binding mode. a, crystal structure of uPA in complex with PAI-1 (PDB code 3PB1) was superimposed to uPA-Nb4. Shown is the reactive loop of the serpin PAI-1 (yellow) and the CDR-H3 of Nb4 (orange). b, crystal structure of trypsin in complex with the standard mechanism inhibitor BPTI (PDB code 4Y0Y) was superimposed to uPA-Nb4. Shown is the reactive loop of BPTI (white) and the CDR-H3 of Nb4 (orange). c, comparison between the CDR-H3's of the anti-matriptase antibody E2 (magenta) (PDB code 3BN9) and Nb4 (orange). The crystal structure of E2 in complex with matriptase was superimposed to uPA-Nb4. In all panels the catalytic Ser-195 colored red, and the residues in uPA (green) that interact with Nb4 are highlighted in light blue. The N and C termini of the peptide segments are indicated in yellow for Nb4, PAI-1, and BPTI and in green for E2.
FIGURE 9.
FIGURE 9.
Sequence alignment of the 37s loop of uPA to uPA-related trypsin-like serine proteases and uPA from other species. The Nb4 interacting residues are highlighted in cyan, and their conserved position in the other proteases are highlighted in yellow. The sequences were obtained from the UniProt database.
FIGURE 10.
FIGURE 10.
Comparison of Nb4 to mupain-1 and peptide 10. a, orientation of the CDR-H3 loop of Nb4 (orange) in the active site of uPA (green). b, orientation of the peptidic inhibitor mupain-1 (green) in the active site of murinized human uPA (green) (PDB code 4X1Q). c, orientation of the peptidic inhibitor peptide 10 (pkalin-3) (yellow) in the active site of human plasma kallikrein (green) (PDB code 4ZJ6). In all panels, the catalytic Ser-195 is colored red. The N- to C-terminal orientation of the inhibitors is indicated in yellow. d, distances from the catalytic Ser-195 to the carbonyl group of the P1 Arg residue in uPA-Nb4 (orange), uPAH99Y-mupain-1 (green), and kallikrein-pkalin-3 (yellow). Gly-193 is also shown to highlight differences in alignment of the P1 carbonyl oxygen atom of the inhibitors in the oxyanion hole (amide groups of Ser-195 and Gly-193).

References

    1. Puente X, O., and López-Otín C. (2008) in The Cancer Degradome (Edwards D., Høyer-Hansen G., Blasi F., and Sloane B. F., eds) pp. 3–15, Springer, New York
    1. Turk B. (2006) Targeting proteases: successes, failures and future prospects. Nat. Rev. Drug Discov. 5, 785–799 - PubMed
    1. Cudic M., and Fields G. B. (2009) Extracellular proteases as targets for drug development. Curr. Protein Pept. Sci. 10, 297–307 - PMC - PubMed
    1. Drag M., and Salvesen G. S. (2010) Emerging principles in protease-based drug discovery. Nat. Rev. Drug Discov. 9, 690–701 - PMC - PubMed
    1. Schechter I., and Berger A. (1967) On the size of the active site in proteases. I. Papain. Biochem. Biophys. Res. Commun. 27, 157–162 - PubMed

Publication types

MeSH terms

Substances