The Relation Between Promoter Chromatin Status, Xyr1 and Cellulase Ex-pression in Trichoderma reesei
- PMID: 27226770
- PMCID: PMC4864836
- DOI: 10.2174/1389202917666151116211812
The Relation Between Promoter Chromatin Status, Xyr1 and Cellulase Ex-pression in Trichoderma reesei
Abstract
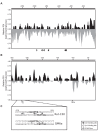
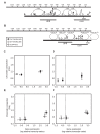
The ascomycete Trichoderma reesei is used for the production of plant cell wall-degrading enzymes in industrial scale. The interplay of the transactivator Xyr1 and the repressor Cre1 mainly regulates the expression of these enzymes. During induc-ing conditions, such as in the presence of sophorose, the transcription of the two major cellulase-encoding genes, cbh1 and cbh2, is activated as well as the expression of xyr1. In the presence of D-glucose carbon catabolite repression mediated by Cre1 takes place and the expression of Xyr1 and the plant cell wall-degrading enzymes is down-regulated. In this study we compare the chromatin status of xyr1, cbh1, and cbh2 promoters in the wild-type strain and the Cre1-deficient strain Rut-C30. Chromatin rearrangement occurs in the xyr1 promoter during induction on sophorose. Chromatin opening and protein-DNA interactions in the xyr1 promoter were detected especially in a region located 0.9 kb upstream the translation start co-don, which bears several putative Cre1-binding sites and a CCAAT-box. Moreover, the xyr1 promoter is overall more acces-sible in a cre1-truncated background, no matter which carbon source is present. This makes the xyr1 regulatory sequence a good target for promoter engineering aiming at the enhancement of cellulase production.
Keywords: Cellulases; Chromatin; Promoter; Rut-C30; Trichoderma reesei; Xyr1..
Figures


Similar articles
-
Truncation of the transcriptional repressor protein Cre1 in Trichoderma reesei Rut-C30 turns it into an activator.Fungal Biol Biotechnol. 2018 Aug 20;5:15. doi: 10.1186/s40694-018-0059-0. eCollection 2018. Fungal Biol Biotechnol. 2018. PMID: 30151221 Free PMC article.
-
A truncated form of the Carbon catabolite repressor 1 increases cellulase production in Trichoderma reesei.Biotechnol Biofuels. 2014 Sep 11;7(1):129. doi: 10.1186/s13068-014-0129-3. eCollection 2014. Biotechnol Biofuels. 2014. PMID: 25342970 Free PMC article.
-
The impact of chromatin remodelling on cellulase expression in Trichoderma reesei.BMC Genomics. 2015 Aug 7;16(1):588. doi: 10.1186/s12864-015-1807-7. BMC Genomics. 2015. PMID: 26248555 Free PMC article.
-
Promoter regulation and genetic engineering strategies for enhanced cellulase expression in Trichoderma reesei.Microbiol Res. 2022 Jun;259:127011. doi: 10.1016/j.micres.2022.127011. Epub 2022 Mar 21. Microbiol Res. 2022. PMID: 35339938 Review.
-
The Promoter Toolbox for Recombinant Gene Expression in Trichoderma reesei.Front Bioeng Biotechnol. 2018 Oct 11;6:135. doi: 10.3389/fbioe.2018.00135. eCollection 2018. Front Bioeng Biotechnol. 2018. PMID: 30364340 Free PMC article. Review.
Cited by
-
Normal transcription of cellulolytic enzyme genes relies on the balance between the methylation of H3K36 and H3K4 in Penicillium oxalicum.Biotechnol Biofuels. 2019 Aug 20;12:198. doi: 10.1186/s13068-019-1539-z. eCollection 2019. Biotechnol Biofuels. 2019. PMID: 31452679 Free PMC article.
-
Discovery of ER-localized sugar transporters for cellulase production with lac1 being essential.Biotechnol Biofuels Bioprod. 2022 Nov 29;15(1):132. doi: 10.1186/s13068-022-02230-x. Biotechnol Biofuels Bioprod. 2022. PMID: 36443855 Free PMC article.
-
Genetic engineering of Trichoderma reesei cellulases and their production.Microb Biotechnol. 2017 Nov;10(6):1485-1499. doi: 10.1111/1751-7915.12726. Epub 2017 May 29. Microb Biotechnol. 2017. PMID: 28557371 Free PMC article. Review.
-
Identification of the Main Regulator Responsible for Synthesis of the Typical Yellow Pigment Produced by Trichoderma reesei.Appl Environ Microbiol. 2016 Sep 30;82(20):6247-6257. doi: 10.1128/AEM.01408-16. Print 2016 Oct 15. Appl Environ Microbiol. 2016. PMID: 27520818 Free PMC article.
-
Truncation of the transcriptional repressor protein Cre1 in Trichoderma reesei Rut-C30 turns it into an activator.Fungal Biol Biotechnol. 2018 Aug 20;5:15. doi: 10.1186/s40694-018-0059-0. eCollection 2018. Fungal Biol Biotechnol. 2018. PMID: 30151221 Free PMC article.
References
-
- Kuhls K., Lieckfeldt E., Samuels G.J., Kovacs W., Meyer W., Petrini O., Gams W., Börner T., Kubicek C.P. Molecular evidence that the asexual industrial fungus Trichoderma reesei is a clonal derivative of the ascomycete Hypocrea jecorina. Proc. Natl. Acad. Sci. USA. 1996;93(15):7755–7760. doi: 10.1073/pnas.93.15.7755. - DOI - PMC - PubMed
-
- Viikari L., Vehmaanperä J., Koivula A. Lignocellulosic ethanol: From science to industry. Biomass Bioenergy. 2012;46(0):13–24. doi: 10.1016/j.biombioe.2012.05.008. - DOI
-
- Furukawa T., Shida Y., Kitagami N., Mori K., Kato M., Kobayashi T., Okada H., Ogasawara W., Morikawa Y. Identification of specific binding sites for XYR1, a transcriptional activator of cellulolytic and xylanolytic genes in Trichoderma reesei. Fungal Genet. Biol. 2009;46(8):564–574. doi: 10.1016/j.fgb.2009.04.001. - DOI - PubMed
LinkOut - more resources
Full Text Sources
Other Literature Sources
