

Quantification of Focal Outflow Enhancement Using Differential Canalograms
- PMID: 27227352
- PMCID: PMC5113980
- DOI: 10.1167/iovs.16-19541
Quantification of Focal Outflow Enhancement Using Differential Canalograms
Abstract
Purpose: To quantify regional changes of conventional outflow caused by ab interno trabeculectomy (AIT).
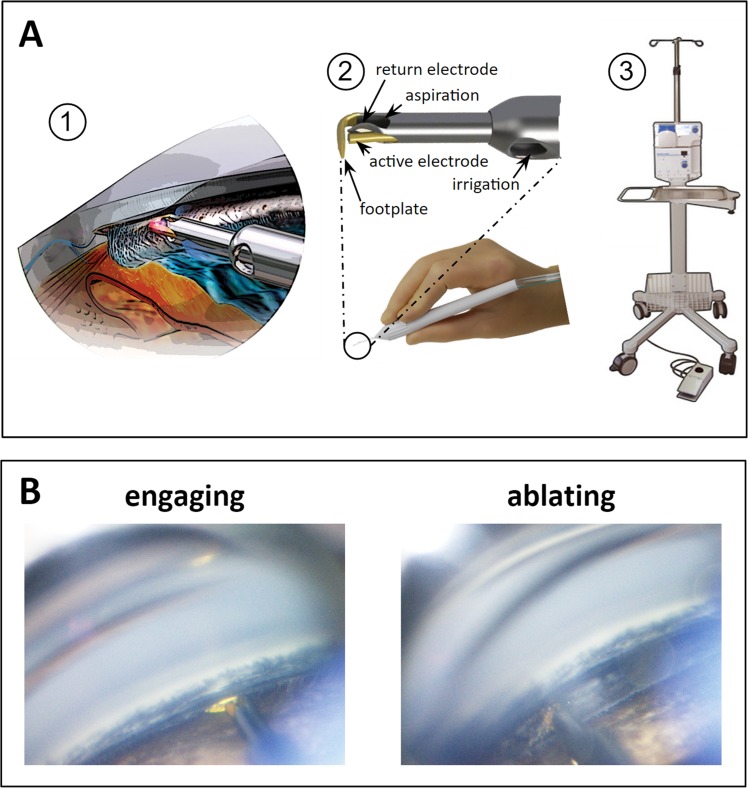
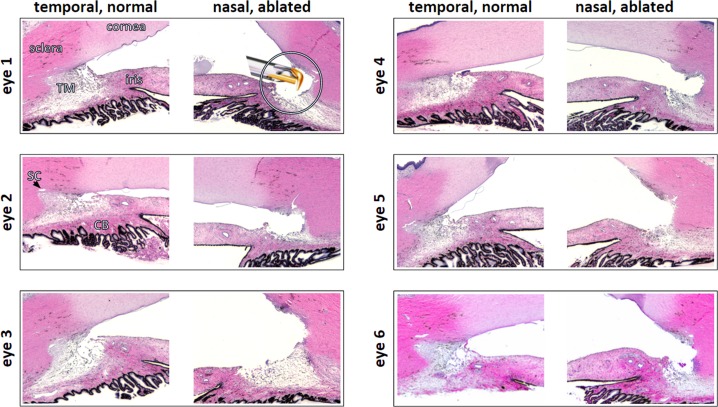
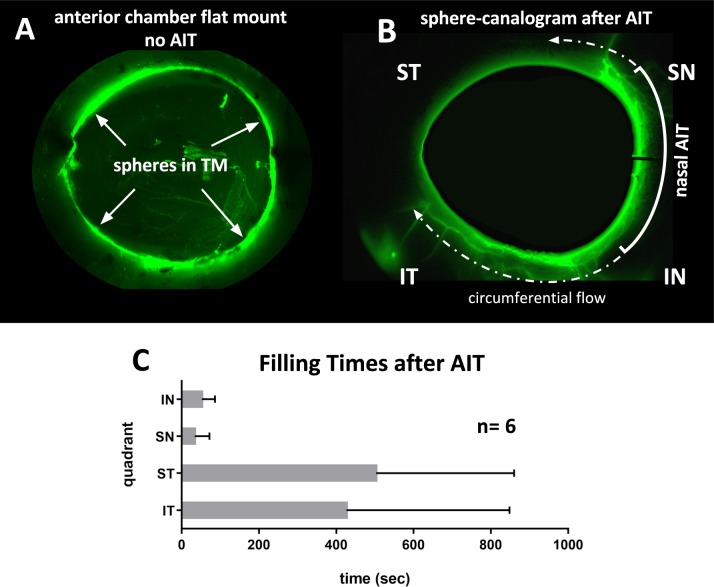
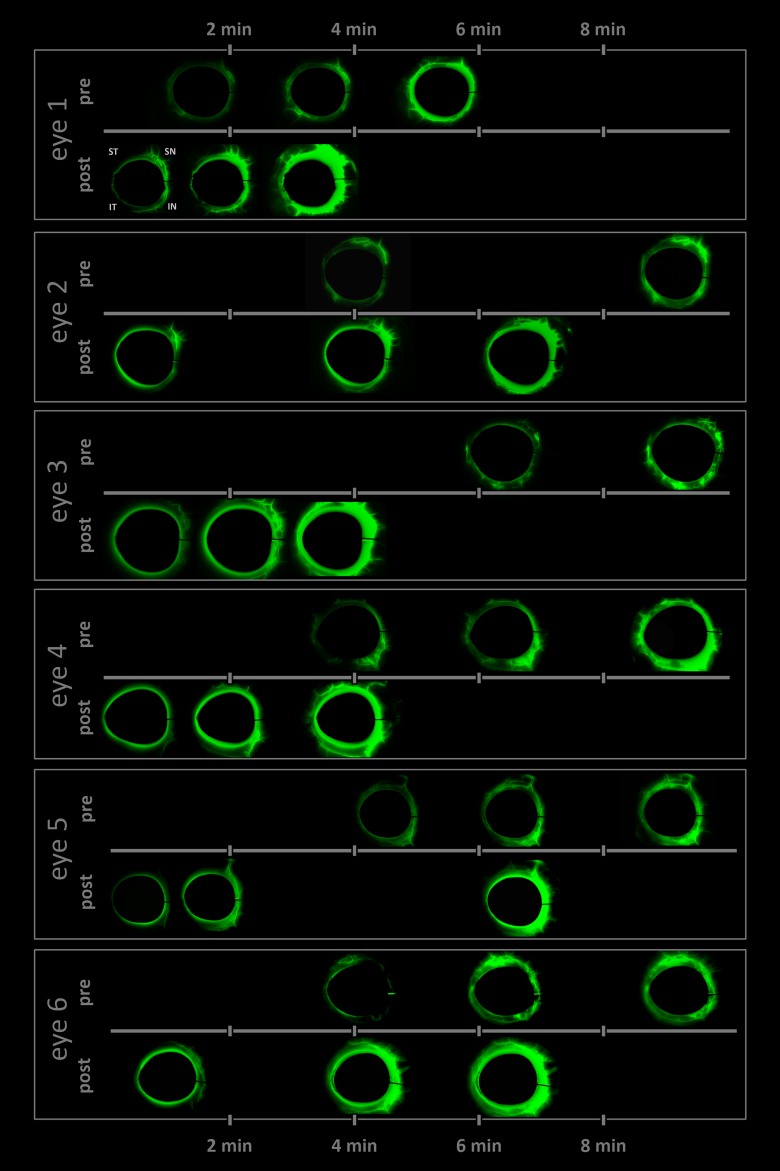
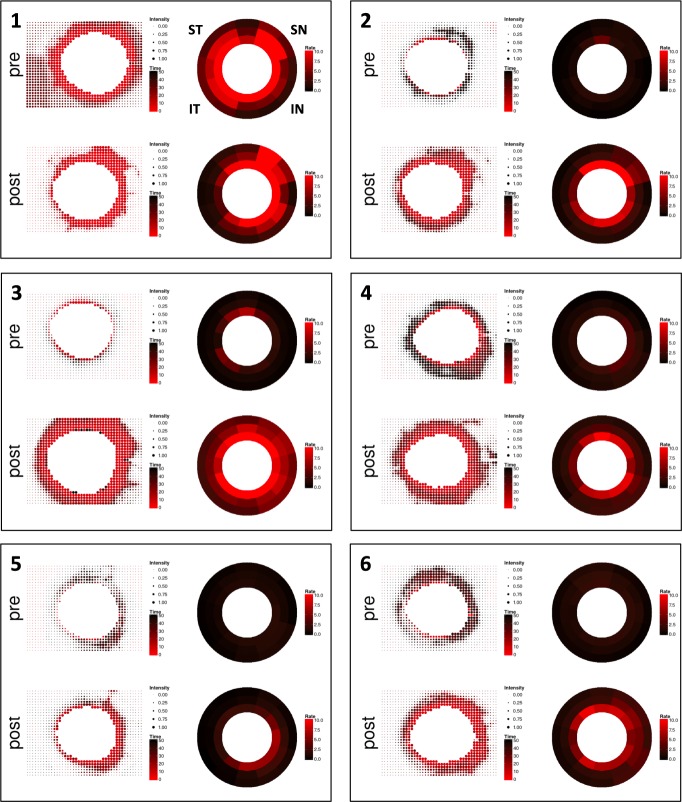
Methods: Gonioscopic, plasma-mediated AIT was established in enucleated pig eyes. We developed a program to automatically quantify outflow changes (R, package eye-canalogram, github.com) using a fluorescent tracer reperfusion technique. Trabecular meshwork (TM) ablation was demonstrated with fluorescent spheres in six eyes before formal outflow quantification with two-dye reperfusion canalograms in six additional eyes. Eyes were perfused with a central, intracameral needle at 15 mm Hg. Canalograms and histology were correlated for each eye.
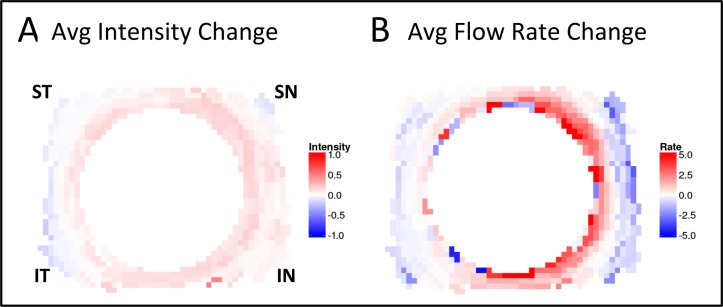
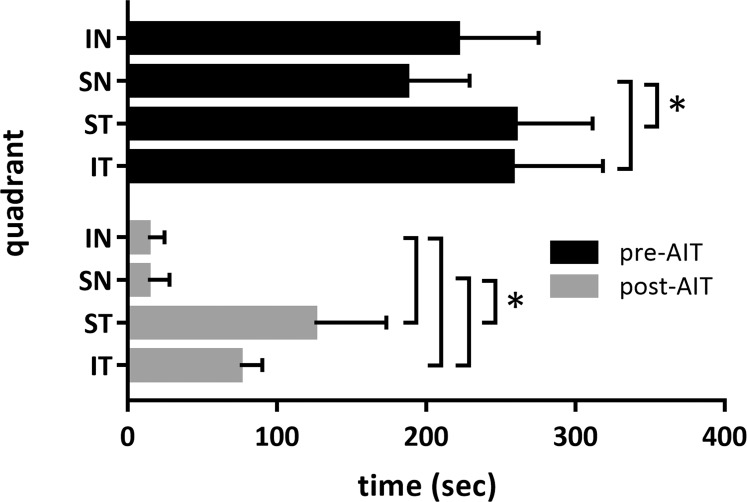
Results: The pig eye provided a model with high similarity to AIT in human patients. Histology indicated ablation of TM and unroofing of most Schlemm's canal segments. Spheres highlighted additional circumferential and radial outflow beyond the immediate area of ablation. Differential canalograms showed that AIT caused an increase of outflow of 17 ± 5-fold inferonasally, 14 ± 3-fold superonasally, and also an increase in the opposite quadrants with a 2 ± 1-fold increase superotemporally, and 3 ± 3 inferotemporally. Perilimbal specific flow image analysis showed an accelerated nasal filling with an additional perilimbal flow direction into adjacent quadrants.
Conclusions: A quantitative, differential canalography technique was developed that allows us to quantify supraphysiological outflow enhancement by AIT.
Figures
Similar articles
-
Outflow enhancement by three different ab interno trabeculectomy procedures in a porcine anterior segment model.Graefes Arch Clin Exp Ophthalmol. 2018 Jul;256(7):1305-1312. doi: 10.1007/s00417-018-3990-0. Epub 2018 May 2. Graefes Arch Clin Exp Ophthalmol. 2018. PMID: 29721662 Free PMC article.
-
Variations in active outflow along the trabecular outflow pathway.Exp Eye Res. 2016 May;146:354-360. doi: 10.1016/j.exer.2016.01.008. Epub 2016 Jan 13. Exp Eye Res. 2016. PMID: 26775054 Free PMC article.
-
Differential Canalograms Detect Outflow Changes from Trabecular Micro-Bypass Stents and Ab Interno Trabeculectomy.Sci Rep. 2016 Nov 4;6:34705. doi: 10.1038/srep34705. Sci Rep. 2016. PMID: 27811973 Free PMC article.
-
Ab interno Schlemm's Canal Surgery.Dev Ophthalmol. 2017;59:127-146. doi: 10.1159/000458492. Epub 2017 Apr 25. Dev Ophthalmol. 2017. PMID: 28442693 Review.
-
Unconventional aqueous humor outflow: A review.Exp Eye Res. 2017 May;158:94-111. doi: 10.1016/j.exer.2016.01.017. Epub 2016 Feb 2. Exp Eye Res. 2017. PMID: 26850315 Free PMC article. Review.
Cited by
-
Structure-Function Changes of the Porcine Distal Outflow Tract in Response to Nitric Oxide.Invest Ophthalmol Vis Sci. 2018 Oct 1;59(12):4886-4895. doi: 10.1167/iovs.18-24943. Invest Ophthalmol Vis Sci. 2018. PMID: 30347083 Free PMC article.
-
Outflow facility and extent of angle closure in a porcine model.Graefes Arch Clin Exp Ophthalmol. 2019 Jun;257(6):1239-1245. doi: 10.1007/s00417-019-04279-1. Epub 2019 Apr 3. Graefes Arch Clin Exp Ophthalmol. 2019. PMID: 30944988 Free PMC article.
-
Shear Stress in Schlemm's Canal as a Sensor of Intraocular Pressure.Sci Rep. 2020 Apr 2;10(1):5804. doi: 10.1038/s41598-020-62730-4. Sci Rep. 2020. PMID: 32242066 Free PMC article.
-
Differences in Outflow Facility Between Angiographically Identified High- Versus Low-Flow Regions of the Conventional Outflow Pathways in Porcine Eyes.Invest Ophthalmol Vis Sci. 2023 Mar 1;64(3):29. doi: 10.1167/iovs.64.3.29. Invest Ophthalmol Vis Sci. 2023. PMID: 36939719 Free PMC article.
-
Greater Outflow Facility Increase After Targeted Trabecular Bypass in Angiographically Determined Low-low Regions.Ophthalmol Glaucoma. 2023 Nov-Dec;6(6):570-579. doi: 10.1016/j.ogla.2023.06.008. Epub 2023 Jun 20. Ophthalmol Glaucoma. 2023. PMID: 37348815 Free PMC article.
References
-
- Brubaker RF. Goldmann's equation and clinical measures of aqueous dynamics. Exp Eye Res. 2004; 78: 633–637. - PubMed
-
- Yuan F,, Schieber AT,, Camras LJ,, Harasymowycz PJ,, Herndon LW,, Allingham RR. Mathematical modeling of outflow facility increase with trabecular meshwork bypass and Schlemm canal dilation. J Glaucoma. 2016; 25: 355–364. - PubMed
-
- de Kater AW,, Melamed S,, Epstein DL. Patterns of aqueous humor outflow in glaucomatous and nonglaucomatous human eyes. A tracer study using cationized ferritin. Arch Ophthalmol. 1989; 107: 572–576. - PubMed
Publication types
MeSH terms
Grants and funding
LinkOut - more resources
Full Text Sources
Other Literature Sources
