. 2016 May 26;11(5):e0156239.
doi: 10.1371/journal.pone.0156239. eCollection 2016.

The Loss of Lam2 and Npr2-Npr3 Diminishes the Vacuolar Localization of Gtr1-Gtr2 and Disinhibits TORC1 Activity in Fission Yeast

Affiliations

The Loss of Lam2 and Npr2-Npr3 Diminishes the Vacuolar Localization of Gtr1-Gtr2 and Disinhibits TORC1 Activity in Fission Yeast

Ning Ma et al. PLoS One. .

Abstract

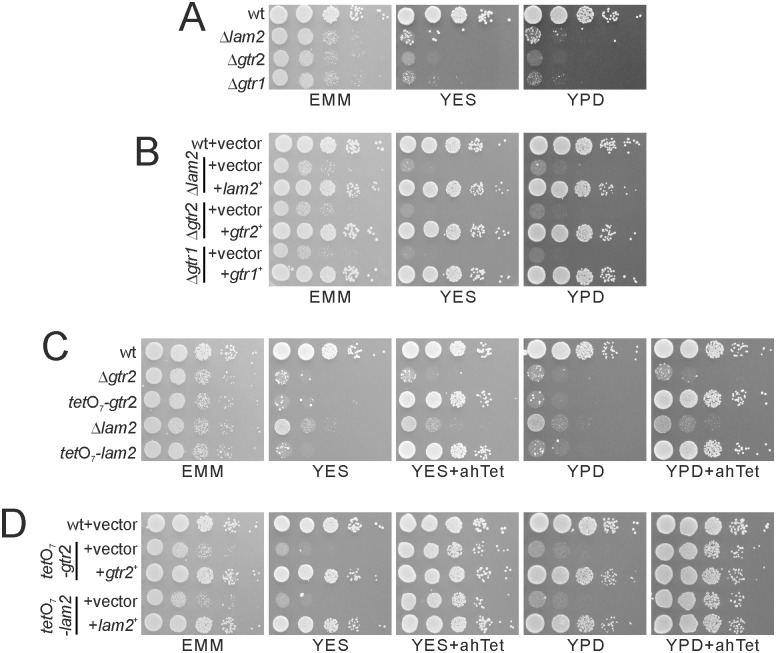
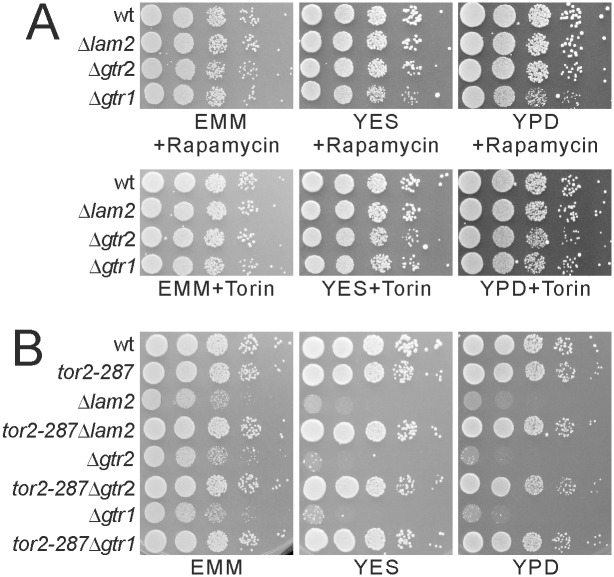
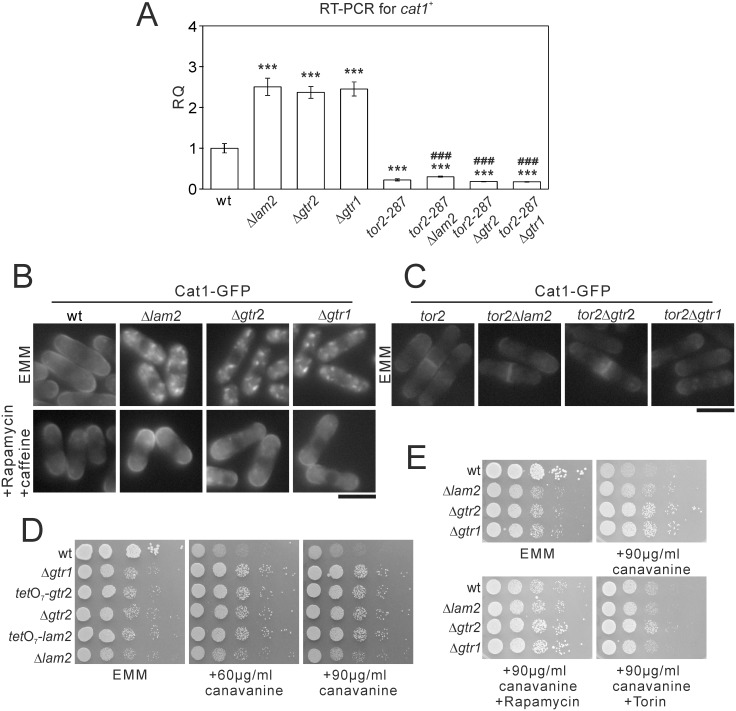
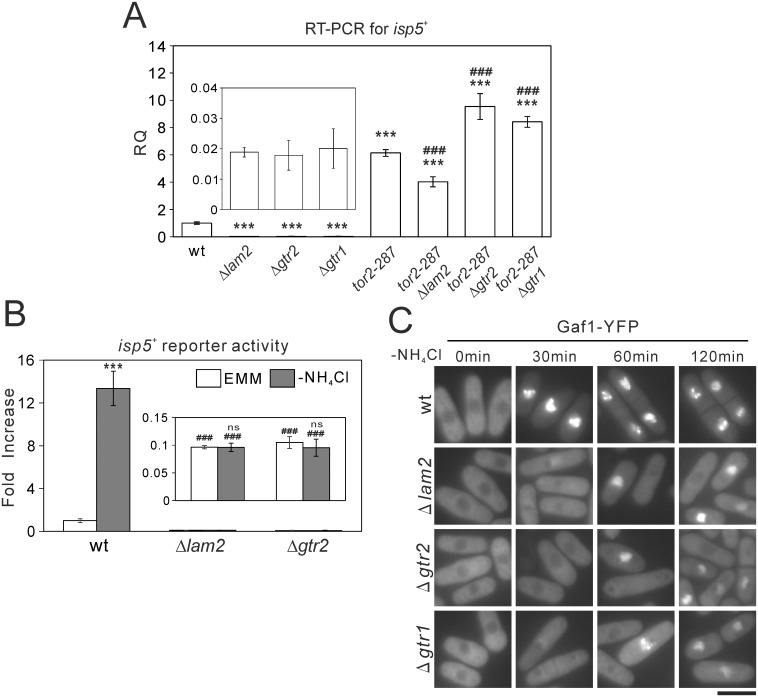
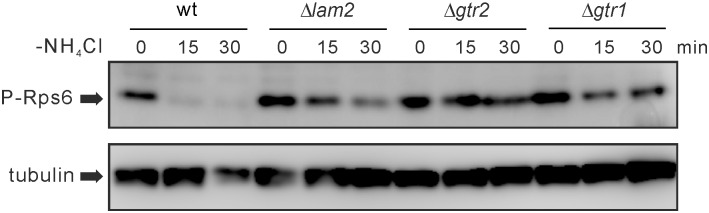
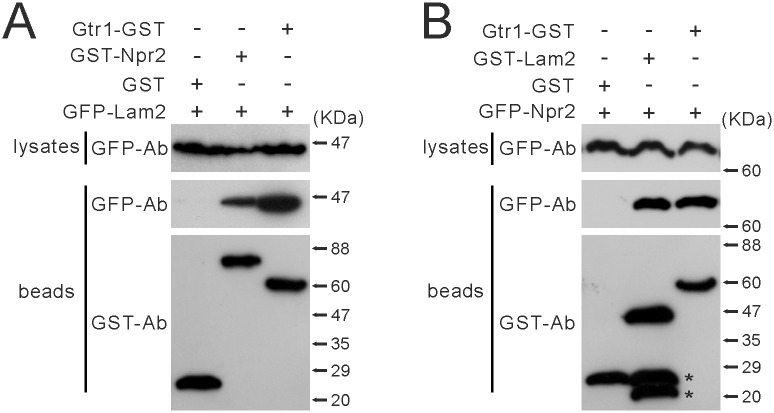
In mammalian cells, mTORC1 activity is regulated by Rag GTPases. It is thought that the Ragulator complex and the GATOR (GAP activity towards Rags) complex regulate RagA/B as its GDP/GTP exchange factor (GEF) and GTPase-activating protein (GAP), respectively. However, the functions of components in these complexes remain elusive. Using fission yeast as a model organism, here we found that the loss of Lam2 (SPBC1778.05c), a homolog of a Ragulator component LAMTOR2, as well as the loss of Gtr1 or Gtr2 phenocopies the loss of Npr2 or Npr3, homologs of GATOR components Nprl2 or Nprl3, respectively. These phenotypes were rescued by TORC1 inhibition using pharmacological or genetic means, and the loss of Lam2, Gtr1, Gtr2, Npr2 or Npr3 disinhibited TORC1 activity under nitrogen depletion, as measured by Rps6 phosphorylation. Consistently, overexpression of GDP-locked Gtr1S20L or GTP-locked Gtr2Q60L, which suppress TORC1 activity in budding yeast, rescued the growth defect of Δgtr1 cells or Δgtr2 cells, respectively, and the loss of Lam2, Npr2 or Npr3 similarly diminished the vacuolar localization and the protein levels of Gtr1 and Gtr2. Furthermore, Lam2 physically interacted with Npr2 and Gtr1. These findings suggest that Lam2 and Npr2-Npr3 function together as a tether for GDP-bound Gtr1 to the vacuolar membrane, thereby suppressing TORC1 activity for multiple cellular functions.


Conflict of interest statement

Competing Interests: The authors have declared that no competing interests exist.

Figures

Fig 1
Fig 1. The deficits in Lam2, Gtr1 and Gtr2 cause growth defects.
(A) Δlam2 cells, Δgtr1 cells and Δgtr2 cells showed growth defects. Prototrophic wild-type cells (wt, KP5080), Δlam2 cells (KP6578), Δgtr1 cells (KP6573) and Δgtr2 cells (KP6571) were cultured to mid-log phase, and adjusted to 0.3 in OD660. The cells were serially diluted by 10 fold and spotted onto the indicated plates, and were then incubated at 27°C on EMM plates for 4 days and on YES or YPD plates for 3 days. (B) Growth defects of Δlam2 cells, Δgtr2 cells and Δgtr1 cells were rescued by overexpression of the respective genes. The indicated leucine auxotrophic Δlam2 cells (KP6607), Δgtr2 cells (KP6608) and Δgtr1 cells (KP6688) transformed with the control vector (pKB1037) or the plasmid containing the lam2+ (pKB8727), gtr2+ (pKB8746) or gtr1+ (pKB9042) gene were dropped and incubated as described in Fig 1A. (C) tetO7-lam2 cells and tetO7-gtr2 cells phenocopied Δlam2 cells and Δgtr2 cells. The Δgtr2 cells (KP6571), tetO7-gtr2 cells (KP6645), Δlam2 cells (KP6578) and tetO7-lam2 cells (KP6650) were spotted onto the indicated plates with or without 2.5 μg/ml ahTet, and then incubated as described in Fig 1A. (D) Growth defects of tetO7-lam2 cells and tetO7-gtr2 cells were rescued by overexpression of the respective genes. The tetO7-gtr2 cells (KP6641) transformed with the control vector (pKB1037) or the plasmid containing the gtr2+ gene (pKB8746), or the tetO7-lam2 cells (KP6648) transformed with the control vector (pKB1037) or the plasmid containing the lam2+ gene (pKB8727) were spotted and incubated as described in Fig 1A.
Fig 2
Fig 2. Δlam2 cells, Δgtr1 cells and Δgtr2 cells show growth defects in a TORC1-dependent manner.
(A) Growth defects of Δlam2 cells, Δgtr1 cells and Δgtr2 cells were rescued by rapamycin or Torin1. Prototrophic wild-type cells (wt, KP5080), Δlam2 cells (KP6578), Δgtr1 cells (KP6573) and Δgtr2 cells (KP6571) were spotted onto EMM, YES or YPD plates containing 0.2 μg/ml rapamycin or 2 μM Torin1 and incubated as described in Fig 1A. (B) Growth defects of Δlam2 cells, Δgtr1 cells and Δgtr2 cells were rescued by tor2-287 mutation. Prototrophic wild-type cells (wt, KP5080), tor2-287 cells (KP6214), Δlam2 cells (KP6578), tor2-287Δlam2 cells (KP6587), Δgtr2 cells (KP6571), tor2-287Δgtr2 cells (KP6583), Δgtr1 cells (KP6573) and tor2-287Δgtr1 cells (KP6672) were spotted and incubated as described in Fig 1A.
Fig 3
Fig 3. The deficits in Lam2, Gtr1 and Gtr2 increase the expression of cat1+ and Cat1 internalization in a TORC1-dependent manner.
(A) mRNA levels of cat1+ were increased in Δlam2 cells, Δgtr2 cells and Δgtr1 cells in a TORC1-depedent manner. The cells described in Fig 2B were grown to mid-log phase in EMM medium. Total RNA was extracted from the harvested cells and subjected to quantitative RT-PCR for cat1+ mRNA. The values were obtained by the comparative CT method in comparison to those of act1+, and then were normalized to those in wild-type cells (RQ: relative quantity). N = 3 for each group. ***P<0.001 for Turkey’s test following one-way ANOVA for the comparisons with the value of wild-type cells. ###P<0.001 for Turkey’s test following one-way ANOVA compared with respective single knockout cells. (B) Cat1 internalization in Δlam2 cells, Δgtr2 cells and Δgtr1 cells was abolished upon pharmacological inhibition of TORC1. Wild-type cells (wt, KP5859), Δlam2 cells (KP6605), Δgtr2 cells (KP6611) and Δgtr1 cells (KP6677), expressing Cat1-GFP under its native promoter were grown to mid-log phase in EMM medium. The cells were divided into two portions, one of which was treated with 0.2 μg/ml rapamycin and 10 mM caffeine for 60 min, and the other of which was left untreated. Representative fluorescent images of Cat1-GFP are shown. Scale bar, 10 μm. (C) Cat1 internalization was abolished by simultaneous tor2-287 mutation. The tor2-287 cells (KP5955), tor2-287Δlam2 cells (KP6618), tor2-287Δgtr2 cells (KP6676) and tor2-287Δgtr1 cells (KP6679) expressing Cat1-GFP under its native promoter were grown to mid-log phase in EMM medium. Representative fluorescent images of Cat1-GFP are shown. Scale bar, 10 μm. (D) The deficits in Lam2, Gtr1 and Gtr2 caused canavanine resistance. The wild-type cells (wt, KP5080), Δgtr1 cells (KP6573), tetO7-gtr2 cells (KP6645), Δgtr2 cells (KP6571), tetO7-lam2 cells (KP6650) and Δlam2 cells (KP6578) were spotted onto EMM wihout or with canavanine at 60 or 90 μg/ml. The plates were incubated at 27°C for 4 days without canavanine or for 5 days with canavanine. (E) Δlam2 cells, Δgtr1 cells and Δgtr2 cells showed canavanine resistance in a TORC1-dependent manner. The indicated cells as described in Fig 1A were spotted onto 90 μg/ml canavanine without or with rapamycin or Torin. The plates were incubated at 27°C for 4 days without canavanine or for 5 days with canavanine.
Fig 4
Fig 4. Δlam2 cells, Δgtr1 cells and Δgtr2 cells lack the basal transcription of isp5+ and its transcriptional activation associated with nuclear Gaf1 localization induced by nitrogen depletion.
(A) mRNA levels of isp5+ were decreased in Δlam2 cells, Δgtr1 cells and Δgtr2 cells in a TORC1-dependent manner. Total RNA from the indicated cells as described in Fig 2B were subjected to quantitative RT-PCR for isp5+ similarly to Fig 3A. N = 3 for each group. Magnified parts of the graphs are shown in insets. ***P<0.001 for Turkey’s test following one-way ANOVA for the comparisons with the value of wild-type cells. ###P<0.001 for Turkey’s test following one-way ANOVA compared with respective single knockout cells. (B) Nitrogen depletion-induced isp5+ transcriptional activation was abolished in Δlam2 cells and Δgtr2 cells. Wild-type cells (wt, HM123), Δlam2 cells (KP6607) and Δgtr2 cells (KP6608) harboring the Renilla luciferase reporter plasmid for isp5+ promoter (pKB8527) were grown to mid-log phase in EMM medium. The medium was replaced by EMM or nitrogen-depleted EMM (-NH4Cl), and the cells were subjected to Renilla luciferase reporter assay. Peak values were normalized to that in wild-type cells in the control condition (EMM). N = 3 for each group. Magnified parts of the graphs are shown in insets. ***P<0.001, ns not significant for unpaired t-test for the planned comparisons with the same genotype in the control condition. ###P<0.001 for Turkey’s test following one-way ANOVA compared with wild-type cells in the respective conditions (EMM or -NH4Cl). (C) Nuclear localization of Gaf1 upon nitrogen depletion was impaired in Δlam2 cells, Δgtr2 cells and Δgtr1 cells. Wild-type cells (wt, KP6488), Δlam2 cells (KP6606), Δgtr2 cells (KP6610) and Δgtr1 cells (KP6612) expressing Gaf1-YFP under the native Gaf1 promoter were grown to mid-log phase in EMM medium. Fluorescent images of Gaf1-YFP were acquired before (0 min) or after nitrogen depletion (-NH4Cl) for the indicated time. Scale bar, 10 μm.
Fig 5
Fig 5. Nitrogen depletion-induced dephosphorylation of Rps6 is inhibited in Δlam2 cells, Δgtr1 cells and Δgtr2 cells.
Prototrophic wild-type cells (wt, KP5080), Δlam2 cells (KP6578), Δgtr2 cells (KP6571) and Δgtr1 cells (KP6573) were grown to mid-log phase in EMM medium. The cells were harvested before (0 min) or after nitrogen depletion (-NH4Cl) for 15 or 30 min, and the proteins were extracted from these cells. The cell lysates were subjected to immunoblot analysis for Rps6 phosphorylation (P-Rps6) as a readout for TORC1 activity. α-Tubulin was detected as an internal control.
Fig 6
Fig 6. The double knockout cells of lam2, gtr2 and npr2 lack synthetic effects in growth defect, canavanine resistance, or nuclear localization of Gaf1 induced by nitrogen depletion.
(A, B) Δgtr2Δgtr1 cells, Δgtr2Δlam2 cells, Δgtr2Δnpr2 cells, Δnpr2Δnpr3 cells, Δnpr2Δlam2 cells lacked synthetic effects in growth defect. The indicated prototrophic wild-type cells (wt, KP5080), Δgtr2 cells (KP6571), Δgtr1 cells (KP6573), Δgtr2Δgtr1 cells (KP6684), Δlam2 cells (KP6578), Δgtr2Δlam2 cells (KP6590), Δnpr2 cells (KP6506), Δgtr2Δnpr2 cells (KP6588), Δnpr3 cells (KP6552), Δnpr2Δnpr3 cells (KP6683) and Δnpr2Δlam2 cells (KP6682) were spotted onto the indicated plates, and then incubated at 27°C on EMM plates for 4 days, on EMM plates containing canavanine for 5 days, and on EMM plates containg rapamycin or Torin for 4 days. (C) Δgtr2Δgtr1 cells, Δgtr2Δlam2 cells and Δgtr2Δnpr2 cells lacked synthetic effects in nuclear localization of Gaf1 induced by nitrogen depletion. Wild-type cells (wt, KP6488), Δgtr2Δgtr1 cells (KP6687), Δgtr2Δlam2 cells (KP6685) and Δgtr2Δnpr2 cells (KP6686) expressing Gaf1-YFP under the native Gaf1 promoter were grown to mid-log phase in EMM medium. Fluorescent images of Gaf1-YFP were then acquired before (0 min) or after nitrogen depletion (-NH4Cl) for the indicated time. Scale bar, 10 μm.
Fig 7
Fig 7. GDP-bound Gtr1 and GTP-bound Gtr2 promote the cell growth in a manner dependent on Lam2, Npr2 and Npr3.
(A) The leucine auxotrophic Δgtr1 cells (KP6688), Δlam2 cells (KP6607), Δnpr3 cells (KP6551) and Δnpr2 cells (KP6586) transformed with the control vector (+ vector, pKB2437) or the plasmid expressing Gtr1 (pKB8676), Gtr1Q61L (pKB8910) or Gtr1S20L (pKB8911) as well as wild-type cells (wt, HM123) transformed with the control vector (pKB2437) were streaked onto YES plates without or with rapamycin. The plates were incubated at 27°C for 4 days. (B) The leucine auxotrophic Δgtr2 cells (KP6608), Δlam2 cells (KP6607), Δnpr3 cells (KP6551) and Δnpr2 cells (KP6586) transformed with the control vector (+ vector, pKB2437) or the plasmid expressing Gtr2 (pKB8634), Gtr2Q60L (pKB8905) or Gtr2S17L (pKB8904) as well as wild-type cells (wt, HM123) transformed with the control vector (pKB2437) were streaked onto YES plates without or with rapamycin. The plates were incubated at 27°C for 4 days.
Fig 8
Fig 8. Lam2, Npr3 and Npr2 are necessary for maintaining the vacuolar localization and the protein levels of Gtr1 and Gtr2.
(A, B) Intracellular localization of Gtr1-GFP (A) or Gtr2-GFP (B) in wild-type (wt) cells, Δlam2 cells, Δnpr3 cells or Δnpr2 cells are shown. The leucine auxotrophic wild-type (wt, HM123), Δlam2 cells (KP6607), Δnpr3 cells (KP6551) and Δnpr2 cells (KP6586) transformed with the plasmids expressing Gtr1-GFP (pKB8702) (A) or Gtr2-GFP (pKB9133) (B) under nmt1 promoter were grown to early log phase in EMM medium at 27°C, and then were shifted to YES medium overnight. The fluorescent and DIC images were then acquired after the cells were treated with distilled water for 30 min. Scale bar, 10 μm. (C) The protein levels of Gtr1-GFP and Gtr2-GFP in wild-type (wt) cells, Δlam2 cells, Δnpr3 cells and Δnpr2 cells. The leucine auxotrophic wild-type (wt, HM123), Δlam2 cells (KP6607), npr3::ura4+ cells (KP6551), npr2::ura4+ cells (KP6586) and npr2::KanMX4 cells (KP6585) transformed the plasmids expressing, GFP (pKB2728), Gtr1-GFP (pKB8702) or Gtr2-GFP (pKB9133) under nmt1 promoter were grown to early log phase in EMM medium without thiamine at 27°C for 20 h. Proteins were extracted and subjected to SDS-PAGE and immunoblot analyses with anti-GFP antibodies. A representative image of immunoblot analysis is shown in the upper panel. Signal intensities of the corresponding bands were quantified and normalized to the values of wild-type cells. The resultant normalized intensities were averaged across three independent blots, and are shown in the lower panel. ***P<0.001 for Turkey’s test following one-way ANOVA for the comparisons with the value of wild-type cells.
Fig 9
Fig 9. Lam2 physically interacts with Npr2 and Gtr1.
(A) GST-Npr2 and Gtr1-GST were co-precipitated with GFP-Lam2. GFP-Lam2-integrated cells (KP6192) expressing Gtr1-GST (pKB8676), GST-Npr2 (pKB8567) or GST (pKB2437) under the nmt1 promoter were grown in EMM medium without thiamine for 20 hr. Gtr1-GST, GST-Npr2 and GST were precipitated from the cell lysates by glutathione beads. The precipitated proteins were subjected to immunoblot analyses using anti-GFP and anti-GST antibodies (Ab). (B) GST-Lam2 and Gtr1-GST were co-precipitated with GFP-Npr2. GFP-Npr2-integrated cells (KP6283) expressing Gtr1-GST (pKB8676), GST-Lam2 (pKB8795) or GST (pKB2437) were grown in EMM medium without thiamine for 20 hr. Gtr1-GST, GST-Lam2 and GST were precipitated from the cell lysates by glutathione beads, and the precipitated proteins were subjected to immunoblot analyses using anti-GFP and anti-GST antibodies (Ab). The asterisks indicate unexpected bands may represent degradation products.

Similar articles

Cited by

References

    1. Laplante M, Sabatini DM. mTOR signaling at a glance. Journal of cell science. 2009;122(Pt 20):3589–94. 10.1242/jcs.051011 . - DOI - PMC - PubMed
    1. Laplante M, Sabatini DM. mTOR signaling in growth control and disease. Cell. 2012;149(2):274–93. 10.1016/j.cell.2012.03.017 . - DOI - PMC - PubMed
    1. Hayashi T, Hatanaka M, Nagao K, Nakaseko Y, Kanoh J, Kokubu A, et al. Rapamycin sensitivity of the Schizosaccharomyces pombe tor2 mutant and organization of two highly phosphorylated TOR complexes by specific and common subunits. Genes to cells: devoted to molecular & cellular mechanisms. 2007;12(12):1357–70. 10.1111/j.1365-2443.2007.01141.x . - DOI - PubMed
    1. Ikai N, Nakazawa N, Hayashi T, Yanagida M. The reverse, but coordinated, roles of Tor2 (TORC1) and Tor1 (TORC2) kinases for growth, cell cycle and separase-mediated mitosis in Schizosaccharomyces pombe. Open biology. 2011;1(3):110007 10.1098/rsob.110007 . - DOI - PMC - PubMed
    1. Smith EM, Finn SG, Tee AR, Browne GJ, Proud CG. The tuberous sclerosis protein TSC2 is not required for the regulation of the mammalian target of rapamycin by amino acids and certain cellular stresses. The Journal of biological chemistry. 2005;280(19):18717–27. 10.1074/jbc.M414499200 . - DOI - PubMed

MeSH terms

Substances