. 2016 May 26;7(5):e2237.
doi: 10.1038/cddis.2016.111.

'Mitochondrial energy imbalance and lipid peroxidation cause cell death in Friedreich's ataxia'

Affiliations

'Mitochondrial energy imbalance and lipid peroxidation cause cell death in Friedreich's ataxia'

R Abeti et al. Cell Death Dis. .

Abstract

Friedreich's ataxia (FRDA) is an inherited neurodegenerative disease. The mutation consists of a GAA repeat expansion within the FXN gene, which downregulates frataxin, leading to abnormal mitochondrial iron accumulation, which may in turn cause changes in mitochondrial function. Although, many studies of FRDA patients and mouse models have been conducted in the past two decades, the role of frataxin in mitochondrial pathophysiology remains elusive. Are the mitochondrial abnormalities only a side effect of the increased accumulation of reactive iron, generating oxidative stress? Or does the progressive lack of iron-sulphur clusters (ISCs), induced by reduced frataxin, cause an inhibition of the electron transport chain complexes (CI, II and III) leading to reactive oxygen species escaping from oxidative phosphorylation reactions? To answer these crucial questions, we have characterised the mitochondrial pathophysiology of a group of disease-relevant and readily accessible neurons, cerebellar granule cells, from a validated FRDA mouse model. By using live cell imaging and biochemical techniques we were able to demonstrate that mitochondria are deregulated in neurons from the YG8R FRDA mouse model, causing a decrease in mitochondrial membrane potential (▵Ψm) due to an inhibition of Complex I, which is partially compensated by an overactivation of Complex II. This complex activity imbalance leads to ROS generation in both mitochondrial matrix and cytosol, which results in glutathione depletion and increased lipid peroxidation. Preventing this increase in lipid peroxidation, in neurons, protects against in cell death. This work describes the pathophysiological properties of the mitochondria in neurons from a FRDA mouse model and shows that lipid peroxidation could be an important target for novel therapeutic strategies in FRDA, which still lacks a cure.


Figures
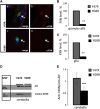
Figure 1
Figure 1
Decrease of FXN in granule cells and glia from YG8R mice. (A) The panel on the left shows immunofluorescence on co-cultures of granule cells and glia in the two genotypes: Y47R (control), YG8R (190 and 90 GAA repeats; FRDA model). In a and c are shown the merge of DAPI (blue), α-MAP-2 (green) and α-FXN (red), while b and d show α-hFXN (red). (B, C) The histograms represent the mean intensity of the α-hFXN antibody measured cell-by-cell. On top the histogram shows the mean of hFXN level in granule cells and on the bottom in glial cells. The fluorescence was averaged between cells and number of animals used (three independent experiments were conducted per case). In both cell types granule cells and glia, the level of FXN is significantly decreased in YG8R cells (**P<0.01; one–way ANOVA test with Bonferroni correction), compared with Y47R. (D) The figure shows the western blot on α-hFXN and α-AIF conducted on cerebella extracts of 8.5-months-old mice. (E) The histogram shows the quantification of the western blot (three independent experiments and n=3 mice; ***P=0.0004; t-test)
Figure 2
Figure 2
Study of Δψm in YG8R granule cells and glia. (a and b) The histograms represent the mean of the peak intensity value of TMRM (25 nM), taken cell-by-cell, and averaged between cells and number of animals used (no. of cells=150 per case). Although cerebellar granule neurons show a difference between Y47R (control) and YG8R (**P<0.005; one–way ANOVA test with Bonferroni correction), on the left side of the histogram (a), astrocytes do not seem to be affected by the presence of the mutated gene in YG8R (b). This is because of the fact that granule and glial cells have a different energy metabolism. (c and d) The graph shows the differential response to oligomycin (an inhibitor of Complex V of the ETC) from granule Y47R and granule YG8R; where YG8R cells show a decrease of potential during oligomycin, meaning that these cells cannot maintain their Δψm (no. of cells=100 per case). (e) The curve shows the response to oligomycin in granule YG8R cells treated with Complex I substrates (5 mM pyruvate and 5 mM malate for 12 h). (f) The curve shows the mean of responses from glial cells to oligomycin, from YG8R (f). In glial cells, YG8R show a normal response on regards to Δψm maintenance (no. of cells=140 per case)
Figure 3
Figure 3
Investigation of NADH autofluorescence in cerebellar granule cells in culture and acute cerebellar slices. (a and b) The application of mitochondrial uncoupler 1 μM FCCP maximises the rate of respiration and oxidises the mitochondrial NADH pool in cells, resulting in a decrease of detected fluorescence (minimum=0% for NADH; 3A; 3B). The subsequent application of the Complex IV inhibitor, 1 mM NaCN, suppresses respiration preventing NADH oxidation and allowing the NADH pool to be regenerated (maximum=100% for NADH; 3A; 3B) The first trace shows the response to 1 μM FCCP and 1 mM NaCN in a mean of granule cells Y47R, the second shows YG8R. (c). The histogram represents the NADH pool calculated from the traces above in both genotypes (**P=0.0057; Mann–Whitney test). (d) Shows the NADH redox level in granule cells. (e and f) Show respectively the NADH pool and the redox state in % in granule cells from acute slices, where no significant differences were found when comparing YG8R to Y47R
Figure 4
Figure 4
Investigation of FAD autofluorescence in cerebellar granule cells and acute cerebellar slices. (a) The application of mitochondrial uncoupler 1 μM FCCP maximises the rate of respiration and oxidises the mitochondrial FADH2 pool in cells, resulting in an increase of detected fluorescence (maximum=100% for FAD; 4A). The subsequent application of the Complex IV inhibitor, 1 mM NaCN, suppresses respiration decreasing the level of FAD (minimum=−0% for FAD; 4A). The first trace shows the response to 1 μM FCCP and 1 mM NaCN in a mean of primary cultures of cerebellar granule cells form Y47R looking at FAD autofluorescence. (b and c) The histograms represent the FAD pool calculated from the trace above in both genotypes in granule cells and the level of FAD redox state. No significant differences were detected between genotypes from primary cultures. (d and e) Show respectively the FAD pool and the redox state in granule cells from acute slices which were both significantly different, between Y47R and YG8R (*P<0.05 and **P<0.005)
Figure 5
Figure 5
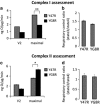
Oxygen consumption in mitochondria from cerebellum. (a) The histogram represent the rate of oxygen consumption originated from both Y47R and YG8R, showing the basal and the maximal oxygen consumption of isolated mitochondria from Y47R and YG8R cerebella, after administration of CI substrates (5 mM glutamate and 5 mM malate). The maximal level is significantly decreased in YG8R mitochondria (**P<0.005). (b) The histogram represents the respiratory control calculated by state 3 divided to state 4, no significant differences were witnessed. (c) The graph shows basal and the maximal oxygen consumption of isolated mitochondria from Y47R and YG8R cerebella, after administration of the CII substrate (5 mM succinate) and 10 μM rotenone (CI inhibitor) to exclude CI activity. The maximal level shows a significant increase in YG8R compared with the control (*P<0.05). (d) The histogram represents the respiratory control calculated by state 3 divided to state 4, showing no significant differences between the two genotypes
Figure 6
Figure 6
Mitochondrial complex activities in cerebellum of YG8R mice. (a) The histogram shows the activity of CI measured from cerebellar homogenates, which results decreased in YG8R mice (*P=0.02). (b) Shows the activity of both CII–III which is not significantly different between the two genotypes. (c) The histogram shows the activity in CIV in Y47R and YG8R cerebellar homogenates. YG8R shows a significant decrease of activity (**P=0.008)
Figure 7
Figure 7
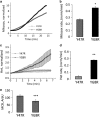
ROS increases and GSH decrease in cerebellar granule cells of FRDA-like cultures. (a and b) Mitochondrial ROS were measured with Mitosox in cerebellar granule cells. The curves on the left show the increase over time of Mitosox fluorescence (a), which was quantified cell-by-cell as a rate of mROS generation (b). YG8R showed a significant increase in rate of mROS generation (*P<0.05). (c and d) Similarly to the mROS also the cytosolic ROS were higher in the FRDA-like granule cells. Cytosolic were measured with dihydroethidium (Het). The level of ROS production is visible with the Het kinetic over time (c) and the rate showed a significant increase of ROS (d; **P<0.005). (e) By using monochlorobimane (MCB) we have measured the level of GSH in cerebellar granule neurons, which showed a significant difference between YG8R and control (***P=0.0001)
Figure 8
Figure 8
Lipid peroxidation is increased in YG8R and anti-lipid peroxidation protects YG8R from cell death. (a) The graphs show respectively the kinetic ratio from Y47R and YG8R, using C11-BODIPY and (b) shows the rate of lipid peroxidation in granule cells from Y47R and YG8R. The FRDA-like genotype results in a significant increase of lipid peroxidation compared to control (**P<0.005). (c) The histogram shows the percentage of cell death in YG8R cerebellar granule cells, with and without 24 h treatment with 100 μM D4-PUFAs. This compound resulted to be protective showing a significant decrease in cell death (**P<0.005). (d) Summary of the results

References

    1. Harding AE. Friedreich's ataxia: a clinical and genetic study of 90 families with an analysis of early diagnostic criteria and intrafamilial clustering of clinical features. Brain 1981; 104: 589–620. - PubMed
    1. Parkinson MH, Boesch S, Nachbauer W, Mariotti C, Giunti P. Clinical features of Friedreich's ataxia: classical and atypical phenotypes. J Neurochem 2013; 126: 103–117. - PubMed
    1. Campuzano V, Montermini L, Molto MD, Pianese L, Cossee M, Cavalcanti F et al. Friedreich's ataxia: autosomal recessive disease caused by an intronic GAA triplet repeat expansion. Science 1996; 271: 1423–1427. - PubMed
    1. Pandolfo M, Pastore A. The pathogenesis of Friedreich ataxia and the structure and function of frataxin. J Neurol 2009; 256: 9–17. - PubMed
    1. Gomes CM, Santos R. Neurodegeneration in Friedreich's ataxia: from defective frataxin to oxidative stress. Oxid Med Cell Longev 2013; 2013: 487534. - PMC - PubMed

MeSH terms

LinkOut - more resources