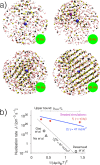
. 2016 Jun 22;116(12):7078-116.
doi: 10.1021/acs.chemrev.5b00744. Epub 2016 May 26.

Crystal Nucleation in Liquids: Open Questions and Future Challenges in Molecular Dynamics Simulations

Affiliations

Crystal Nucleation in Liquids: Open Questions and Future Challenges in Molecular Dynamics Simulations

Gabriele C Sosso et al. Chem Rev. .

Abstract

The nucleation of crystals in liquids is one of nature's most ubiquitous phenomena, playing an important role in areas such as climate change and the production of drugs. As the early stages of nucleation involve exceedingly small time and length scales, atomistic computer simulations can provide unique insights into the microscopic aspects of crystallization. In this review, we take stock of the numerous molecular dynamics simulations that, in the past few decades, have unraveled crucial aspects of crystal nucleation in liquids. We put into context the theoretical framework of classical nucleation theory and the state-of-the-art computational methods by reviewing simulations of such processes as ice nucleation and the crystallization of molecules in solutions. We shall see that molecular dynamics simulations have provided key insights into diverse nucleation scenarios, ranging from colloidal particles to natural gas hydrates, and that, as a result, the general applicability of classical nucleation theory has been repeatedly called into question. We have attempted to identify the most pressing open questions in the field. We believe that, by improving (i) existing interatomic potentials and (ii) currently available enhanced sampling methods, the community can move toward accurate investigations of realistic systems of practical interest, thus bringing simulations a step closer to experiments.


Conflict of interest statement

The authors declare no competing financial interest.

Figures

Figure 1
Figure 1
Sketch of the free energy difference, formula image, as a function of the crystalline nucleus size n. A free energy barrier for nucleation, formula image, must be overcome to proceed from the (metastable) supercooled liquid state to the thermodynamically stable crystalline phase through homogeneous nucleation (purple). Heterogeneous nucleation (green) can be characterized by a lower free energy barrier, formula image, and a smaller critical nucleus size, nhet*, whereas in the case of spinodal decomposition (orange), the supercooled liquid is unstable with respect to the crystalline phase, and the transformation to the crystal proceeds in a barrierless fashion. The three snapshots depict a crystalline cluster nucleating within the supercooled liquid phase (homogeneous nucleation) or as a result of the presence of a foreign impurity (heterogeneous nucleation), as well as the simultaneous occurrence of multiple crystalline clusters in the unstable liquid. This scenario is often labeled as spinodal decomposition, although the existence of a genuine spinodal decomposition from the supercooled liquid to the crystalline phase has been debated (see text).
Figure 2
Figure 2
Illustration of how certain quantities from CNT vary as a function of supercooling, ΔT, for supercooled liquids. The free energy difference between the liquid and the solid phase formula image, the interfacial free energy formula image, and the kinetic prefactor formula image are reported as functions of ΔT in a generic case of diffusion-limited nucleation, characterized by a maximum in the steady-state nucleation rate formula image. formula image is zero at the melting temperature formula image, and formula image is vanishingly small at the glass transition temperature formula image.
Figure 3
Figure 3
Schematic comparison of one-step versus two-step nucleation for a generic supersaturated solution. (a) Sketch of the free energy difference ΔGn,nρ as a function of the number of solute molecules in the largest “connected” cluster (they can be ordered in a crystalline fashion or not) (nρ) and of the number of crystalline molecules within the largest connected cluster (n). The one-step mechanism predicted by CNT (purple) is characterized by a single free energy barrier for nucleation, ΔGn,nρ,one-step*. In contrast, the two-step nucleation requires a free energy barrier, ΔGnρ,two-step*, to be overcome through a local density fluctuation of the solution, leading to a dense, but not crystalline-like, precursor. The latter can be unstable (green) or stable (orange) with respect to the liquid phase, being characterized by a higher (green) or lower (orange) free energy basin. Once this dense precursor has been obtained, the second step consists of climbing a second free energy barrier, ΔGn,two-step*, corresponding to the ordering of the solute molecules within the precursor from a disordered state to the crystalline phase. (b) One-step (purple) and two-step (green and orange) nucleation mechanisms visualized in the density (nρ)–ordering (n) plane. The one-step mechanism proceeds along the diagonal, as both nρ and n increase at the same time in such a way that a single free energy barrier has to be overcome. In this scenario, the supersaturated solution transforms continuously into the crystalline phase. On the other hand, within a two-step nucleation scenario, the system has to experience a favorable density fluctuation along nρ first, forming a disordered precursor that, in a second step, orders itself in a crystalline fashion, moving along the (n) coordinate and ultimately leading to the crystal.
Figure 4
Figure 4
Overview of some of the experimental methods that have been applied to characterize nucleation. Ranges of the spatial and temporal resolutions typical of each approach are reported on the x and y axes, respectively.
Figure 5
Figure 5
Nucleation rate formula image as a function of the simulation time needed within an MD simulation to observe a single nucleation event. The blue shaded region highlights the approximate simulation times currently affordable by classical MD simulations; clearly, only very fast nucleation processes can be simulated with brute-force MD. For homogeneous ice nucleation, formula image and formula image can typically be observed for ΔT = 30 K and ΔT = 80 K, respectively. In the derivations of classical and ab initio simulation times, 105 and 102 molecules, respectively, were considered, together with the number density of a generic supercooled liquid, formula image = 0.01 molecules·Å–3.
Figure 6
Figure 6
Crystallization of PMMA with Φ = 0.45 observed by confocal microscopy. Red (large) and blue (small) spheres show crystal- and liquid-like particles, respectively. The size of the observed volume is 58 μm by 55 μm by 20 μm, containing about 4000 particles. After shear melting of the sample, snapshots were taken after (A) 20, (B) 43, (C) 66, and (D) 89 min. The time series shows how an aspherical nucleus forms and grows over time. Reprinted with permission from ref (83). Copyright 2001 American Association for the Advancement of Science.
Figure 7
Figure 7
Cross section of postcritical crystalline clusters of 5000 LJ particles for ΔT = (a) 10% and (b) 22%. fcc-, hcp-, and bcc-like particles are depicted in gray, yellow, and red, respectively. At ΔT = 22% substantial hcp domains form within the crystallite, whereas at ΔT = 10%, hcp particles can be found almost exclusively on the surface of the fcc core. Reprinted with permission from ref (247). Copyright 2007 American Physical Society.
Figure 8
Figure 8
Nucleation rates computed with the FFS method for a rigid hexagonal surface of LJ atoms in contact with a LJ liquid. Potentials 1 and 2 describe the interaction between substrate and liquid and differ only slightly by the value of σ they use. Error bars are standard deviations from five FFS runs. These results show that the maximum in the nucleation rate occurs at nonzero values of the lattice mismatch δ. Reprinted with permission from ref (271). Copyright 2014 AIP Publishing LLC.
Figure 9
Figure 9
Crystal nucleation of supercooled Fe by means of large-scale MD simulations. (a) Snapshots of trajectories at different temperatures. Crystalline (bcc) atoms are depicted in purple. Yellow circles highlight small crystalline grains doomed to be incorporated into the larger ones later on because of grain coarsening. (b) Nucleation rate as a function of temperature. Reprinted with permission from ref (290). Copyright 2015 Nature Publishing Group.
Figure 10
Figure 10
Fast crystallization of supercooled GeTe by means of MD simulations with neural-network-derived potentials. The number of crystalline nuclei larger than 29 atoms at different temperatures in the supercooled liquid phase is reported as a function of time (notice the exceedingly small time scale at strong supercooling). Two snapshots at the highest and lowest temperatures showing only the crystalline atoms are also reported. At high temperature, a single nucleus is present, whereas several nuclei (each one depicted in a different color) appear at low temperature. The number of nuclei first increases and then decreases due to coalescence. Reprinted with permission from ref (313). Copyright 2013 American Chemical Society.
Figure 11
Figure 11
Compilation of homogeneous nucleation rates for water, obtained by experiments and simulations. The x axis shows the supercooling with respect to the melting point of different water models or 273.15 K for experiment. The y axis shows the logarithm of the nucleation rate in m–3 s–1. Rates obtained with computational approaches are shown as solid symbols; experimental rates are shown as crossed symbols. For each computational study, the computational approach and the water force field used are specified. The nucleation study of Sanz et al. is not included in this graph, because their study was conducted at a small supercooling (20 K), which resulted in a very low estimated nucleation rate far outside this plot (it would correspond to −83 on the y axis). Taborek performed measurements with different setups, namely, using sorbitan tristearate (STS) and sorbitan trioleate (STO) as surfactants. Data for the graph were taken from refs (, , , and −335).
Figure 12
Figure 12
(a) Formation of a topological defect with 5-fold symmetry during homogeneous ice nucleation. The snapshots (i–iv) show the time evolution of the defect structure, indicated by black dashed lines. Ic and Ih water molecules are shown in blue and red, respectively. Reprinted with permission from ref (322) (Copyright 2011 Royal Society of Chemistry), in which Li et al. performed FFS simulations of models containing about 4000 mW water molecules. (b) Nucleation of an ice cluster forming homogeneously from I0-rich precritical nuclei. Water molecules belonging to Ic, Ih, a clathrate-like phase, and I0 are depicted in yellow, green, orange, and magenta, respectively. (i,ii) A critical nucleus forms in an I0-rich region. (iii) The crystalline cluster evolves in a postcritical nucleus, formed by an Ic-rich core surrounded by an I0-rich shell. (iv) The same postcritical nucleus as depicted in iii, but only particles with 12 or more connections (among ice-like particles) are shown. The color map refers to the order parameter Q12 specified in ref (325), from which this image was reprinted with permission (Copyright 2014 Nature Publishing Group). The unbiased MD simulations on which the analysis is based feature 10000 mW molecules.
Figure 13
Figure 13
(Left) A typical double-diamond cage (DDC, blue) and a hexagonal cage (HC, red), the building blocks of Ic and Ih, respectively. (Right) Temporal evolution of an ice nucleus from (i,ii) the early stages of nucleations up to (v,vi) postcritical dimensions, as observed in the FFS simulations of Haji-Akbari and Debenedetti. About 4000 water molecules, modeled with the TIP4P/Ice potential, were considered in the NPT ensemble at ΔT ≈ 40 K. One can clearly notice the abundance of DDCs throughout the whole temporal evolution. In contrast, HC-rich nuclei have only a marginal probability to cross the nucleation barrier (see text). Reprinted with permission from ref (327). Copyright 2015 National Academy of Sciences.
Figure 14
Figure 14
Potential immersion-mode ice nucleus concentrations, Nice, a measure of the efficiency of a given substance to boost heterogeneous ice nucleation, as a function of temperature for a range of atmospheric aerosol species. Note the wide range of nucleating capability for materials as diverse as soot and bacterial fragments over a very broad range of temperatures. Reprinted with permission from ref (356). Copyright 2012 Royal Society of Chemistry.
Figure 15
Figure 15
The amphoteric nature of kaolinite is important to its ice-nucleating ability. (Left) Ice-like contact layers at the kaolinite surface, with the (a,c) basal and (b,d) prism faces of ice adsorbed on kaolinite, as viewed from the (a,b) side and (c,d) top. (Right) Adsorption energy of ice on kaolinite when bound through either its basal face (red data) or its prism face (blue data) for varying numbers of layers of ice. (Open and solid symbols indicate data obtained with a classical force field and with DFT, respectively.) When only the contact layer is present, the basal face structure is more stable than the prism face structure, but as soon as more layers are present, the prism face structure becomes more stable. This can be understood by the ability of the prism face to donate hydrogen bonds to the surface, and to the water molecules above, through the “dangling” hydrogen bonds seen in b and d. Reprinted with permission from ref (371). Copyright 2013 Royal Society of Chemistry.
Figure 16
Figure 16
Interplay between surface morphology and water–surface interaction on the heterogeneous ice nucleation rate. (a) Heat maps representing the values of ice nucleation rates on top of four different fcc surfaces [(111), (100), (110), (211)], plotted as a function of the adsorption energy, Eads, and the lattice parameter, afcc. The lattice mismatch δ with respect to ice on (111) is indicated below the corresponding graph in panel a. The values of the nucleation rate, formula image, are reported as log10(J/J0), where J0 refers to the homogeneous nucleation rate at the same temperature. (b) Sketches of the different regions (white areas) in (Eads,afcc) space in which a significant enhancement of the nucleation rate is observed. Each region is labeled according to the face of Ih nucleating and growing on top of the surface [basal, prismatic, or (11/200), together with an indication of what it is that enhances the nucleation, where “temp”, “buck”, and “highE” refer to the in-plane template of the first overlayer, the ice-like buckling of the contact layer, and the nucleation for high adsorption energies on compact surfaces, respectively. Reprinted with permission from ref (380). Copyright 2015 American Chemical Society.
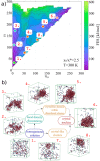
Figure 17
Figure 17
(a) Free-energy surface (FES) associated with the early stages of nucleation of urea in aqueous solution, as obtained by Salvalaglio et al. from a well-tempered metadynamics simulation of 300 urea molecules and 3173 water molecules, within an isothermal–isobaric ensemble at p = 1 bar and T = 300 K (simulation S2 in ref (406) with a correction term to the free-energy included to represent the case of a constant supersaturation of 2.5). The contour plot of the FES is reported as a function of the number of molecules belonging to the largest connected cluster (n, along the ordinate) and the number of molecules in a crystal-like configuration within the largest cluster (no, along the abscissa). Note that nno by definition and that CNT would prescribe that the evolution of the largest cluster in the simulation box is such that n = no (i.e., only the diagonal of the contour plot is populated). The presence of an off-diagonal basin provides evidence of a two-step nucleation of urea crystals from aqueous solutions. This is further supported by the representative states sampled during the nucleation process, shown in panel b. Urea molecules are represented as blue spheres, and red connections are drawn between urea molecules falling within a cutoff distance of 0.6 nm of each other. Reprinted with permission from ref (406). Copyright 2015 National Academy of Sciences.
Figure 18
Figure 18
(a) Snapshots from an MD simulation of crystal nucleation of NaCl from aqueous solution. The simulations, carried out by Chakraborty and Patey, involved 56000 water molecules and 4000 ion pairs (concentration of 3.97 m) in the NPT ensemble. All Na+ (black) and Cl (yellow) ions within 2 nm of a reference Na+ ion (larger and blue) are shown, together with water molecules (oxygen and hydrogen atoms in red and white, respectively) within 0.4 nm from each ion. From the relatively homogeneous solution (3 ns), an amorphous cluster of ions emerges (5 ns). This fluctuation in the concentration of the ions leads to a subsequent ordering of the disordered cluster (10 ns) in a crystalline fashion (30 ns), consistently with a two-step nucleation mechanism. Reprinted with permission from ref (423). Copyright 2013 American Chemical Society. (b) Comparison of NaCl nucleation rates, formula image, as a function of the driving force for nucleation, reported as 1/(Δμ/kBT)2. Red points and blue and gray (continuous) lines were estimated by three different approaches in the simulations of Zimmermann et al. Experimental data obtained employing an electrodynamic levitator trap (Na et al.), an efflorescence chamber (Gao et al.), and microcapillaries (Desarnaud et al.) are also reported, together with a tentative fit (γfitexp, dotted line). Note the substantial (up to about 30 orders of magnitude) discrepancy between experiments and simulations. Reprinted with permission from ref (402). Copyright 2015 American Chemical Society.
Figure 19
Figure 19
Crystal structures of the sI, sII and sH gas hydrates, along with the corresponding cage structures. Only the water molecule positions are shown, as spheres connected by lines. Reprinted with permission from ref (441). Copyright 2007 John Wiley & Sons.
Figure 20
Figure 20
Early stages of hydrate nucleation observed by Walsh et al.: (A–C) A pair of methane molecules is adsorbed on either side of a single pentagonal face of water molecules. Partial cages form around this pair, near the eventual central violet methane molecule, only to dissociate over several nanoseconds. (D,E) A small cage forms around the violet methane, and other methane molecules adsorb at 11 of the 12 pentagonal faces of the cage, creating the bowl-like pattern shown. (F,G) The initial central cage opens on the end opposite to the formation of a network of face-sharing cages, and rapid hydrate growth follows. (H) A snapshot of the system after hydrate growth shows the fates of those methane molecules that made up the initial bowl-like structure (other cages not shown). Reprinted with permission from ref (448). Copyright 2009 American Association for the Advancement of Science.
Figure 21
Figure 21
Sketch of the nucleation mechanism of methane hydrates proposed in ref (451). Clusters of guest molecules aggregate in blobs, which transform into amorphous clathrates as soon as the water molecules arrange themselves in the cages characteristic of crystalline clathrate, which eventually form upon the reordering of the guest molecules—and thus of the cages—in a crystalline fashion. Note that the difference between the blob and the amorphous clathrate is that the water molecules have yet to be locked into clathrate hydrate cages in the former. Reprinted with permission from ref (451). Copyright 2010 American Chemical Society.

References

    1. Bartels-Rausch T. Chemistry: Ten Things We Need to Know about Ice and Snow. Nature 2013, 494, 27–29. 10.1038/494027a. - DOI - PubMed
    1. Murray B. J.; Wilson T. W.; Dobbie S.; Cui Z.; Al-Jumur S. M. R. K.; Möhler O.; Schnaiter M.; Wagner R.; Benz S.; Niemand M.; et al. Heterogeneous Nucleation of Ice Particles on Glassy Aerosols under Cirrus Conditions. Nat. Geosci. 2010, 3, 233–237. 10.1038/ngeo817. - DOI
    1. Mazur P. Cryobiology: The Freezing of Biological Systems. Science 1970, 168, 939–949. 10.1126/science.168.3934.939. - DOI - PubMed
    1. Lintunen A.; Hölttä T.; Kulmala M. Anatomical Regulation of Ice Nucleation and Cavitation Helps Trees to Survive Freezing and Drought Stress. Sci. Rep. 2013, 3, 2031.10.1038/srep02031. - DOI - PMC - PubMed
    1. Erdemir D.; Lee A. Y.; Myerson A. S. Polymorph Selection: The Role of Nucleation, Crystal Growth and Molecular Modeling. Curr. Opin. Drug. Discovery Dev. 2007, 10, 746–755. - PubMed

Publication types