Review
. 2017 Mar 20;26(9):462-485.
doi: 10.1089/ars.2016.6750. Epub 2016 Jul 13.

Heterogeneity in Cancer Metabolism: New Concepts in an Old Field

Affiliations
Review

Heterogeneity in Cancer Metabolism: New Concepts in an Old Field

Géraldine Gentric et al. Antioxid Redox Signal. .

Abstract

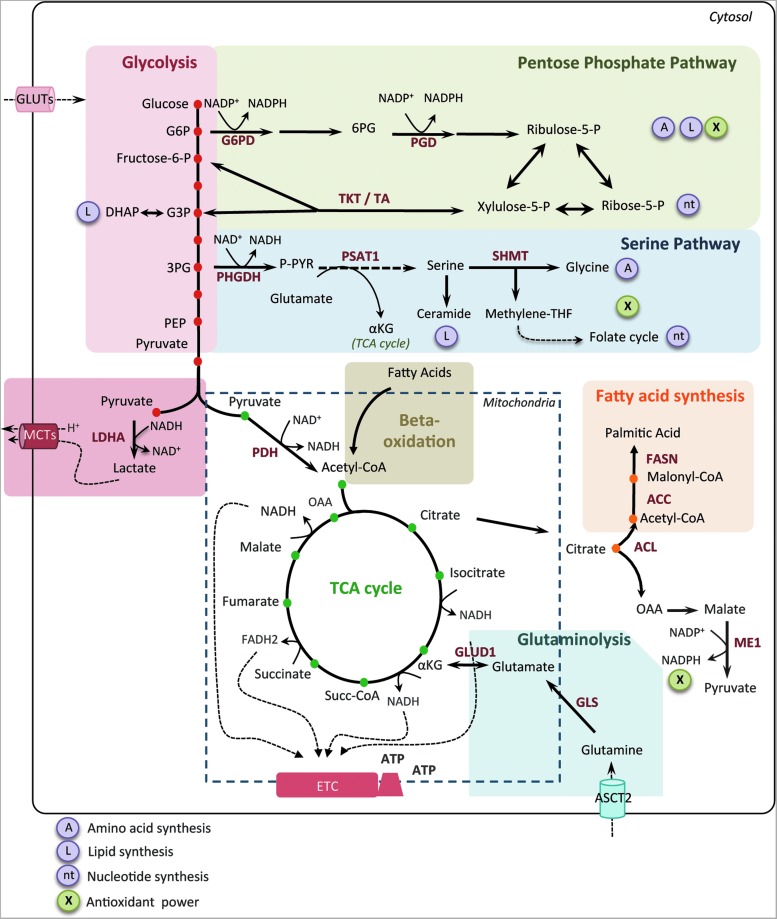
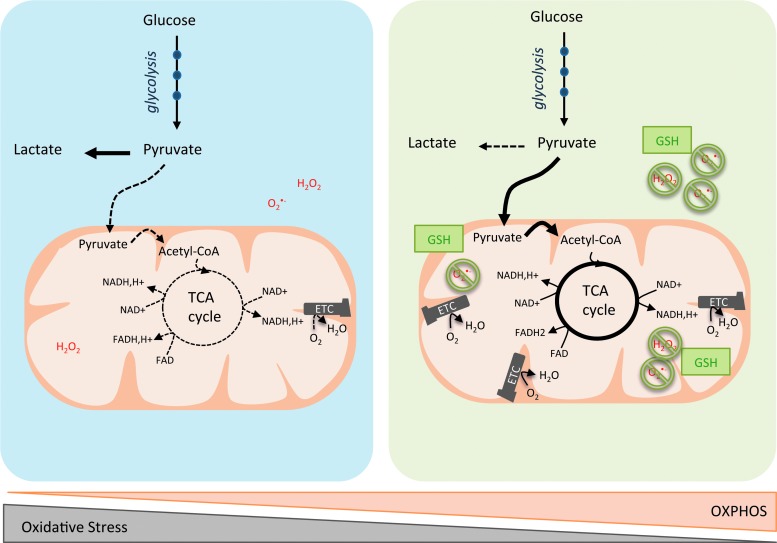
Significance: In the last years, metabolic reprogramming, fluctuations in bioenergetic fuels, and modulation of oxidative stress became new key hallmarks of tumor development. In cancer, elevated glucose uptake and high glycolytic rate, as a source of adenosine triphosphate, constitute a growth advantage for tumors. This represents the universally known Warburg effect, which gave rise to one major clinical application for detecting cancer cells using glucose analogs: the positron emission tomography scan imaging. Recent Advances: Glucose utilization and carbon sources in tumors are much more heterogeneous than initially thought. Indeed, new studies emerged and revealed a dual capacity of tumor cells for glycolytic and oxidative phosphorylation (OXPHOS) metabolism. OXPHOS metabolism, which relies predominantly on mitochondrial respiration, exhibits fine-tuned regulation of respiratory chain complexes and enhanced antioxidant response or detoxification capacity.

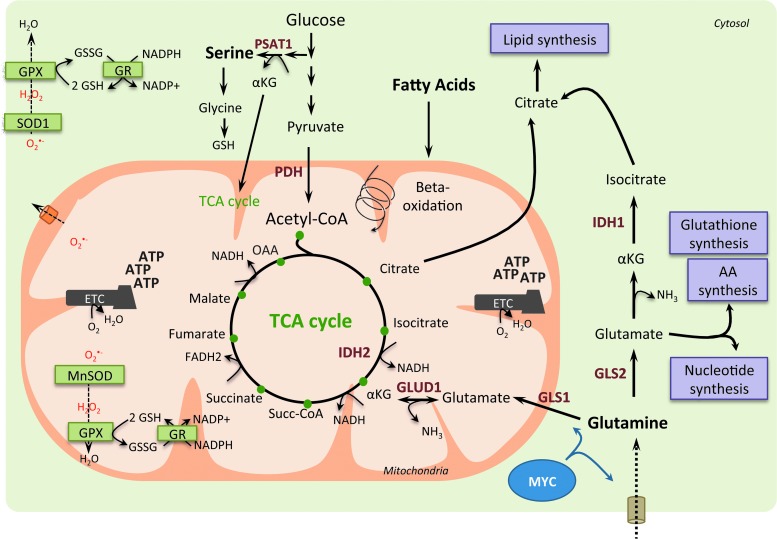
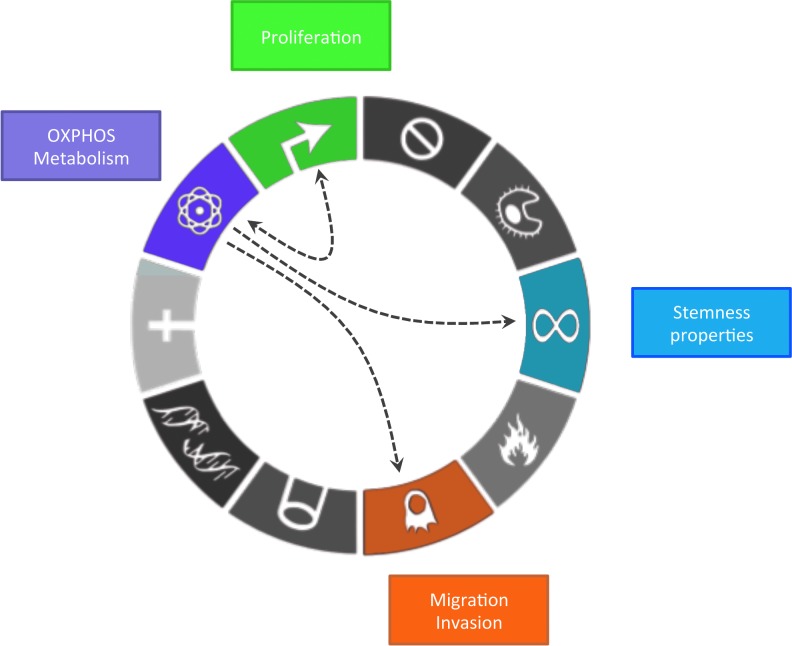
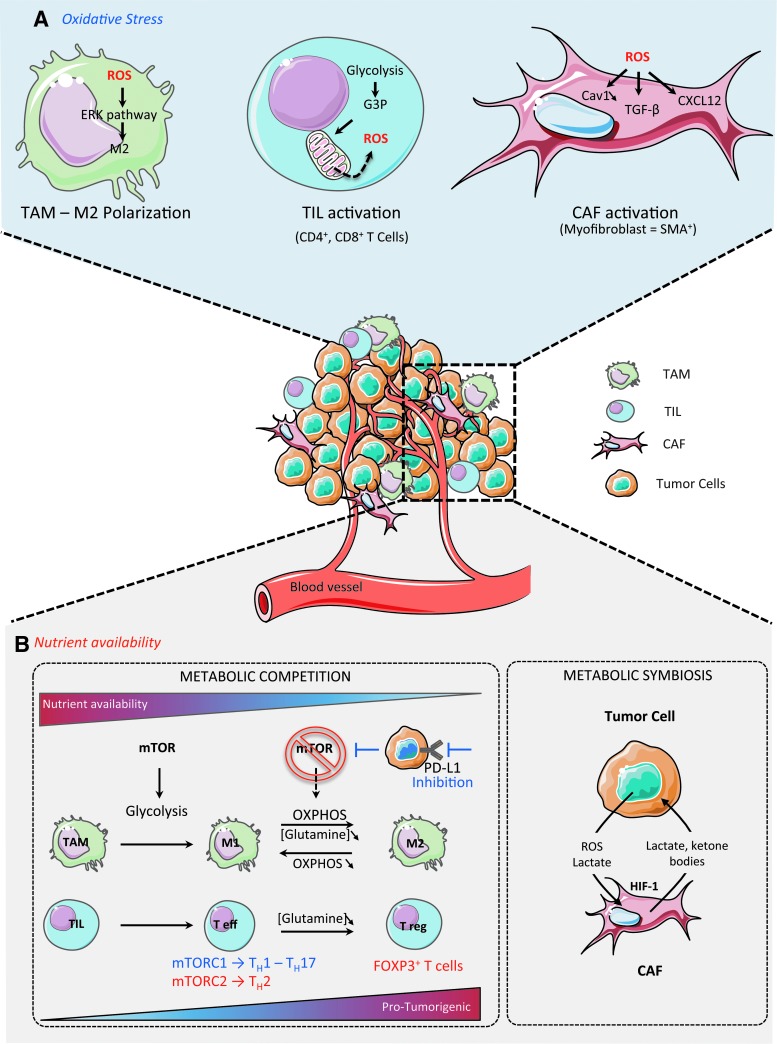
Critical issues: OXPHOS-dependent cancer cells use alternative oxidizable substrates, such as glutamine and fatty acids. The diversity of carbon substrates fueling neoplastic cells is indicative of metabolic heterogeneity, even within tumors sharing the same clinical diagnosis. Metabolic switch supports cancer cell stemness and their bioenergy-consuming functions, such as proliferation, survival, migration, and invasion. Moreover, reactive oxygen species-induced mitochondrial metabolism and nutrient availability are important for interaction with tumor microenvironment components. Carcinoma-associated fibroblasts and immune cells participate in the metabolic interplay with neoplastic cells. They collectively adapt in a dynamic manner to the metabolic needs of cancer cells, thus participating in tumorigenesis and resistance to treatments.

Future directions: Characterizing the reciprocal metabolic interplay between stromal, immune, and neoplastic cells will provide a better understanding of treatment resistance. Antioxid. Redox Signal. 26, 462-485.

Keywords: ROS; cancer; immunology; metabolism; mitochondria; oxidative stress.


Figures

<b>FIG. 1.</b>
FIG. 1.
Core metabolic pathways and enzymes in cancer cells. Here are schematically represented the main metabolic pathways altered in cancers, including the glycolysis, the PPP, the serine pathway, the fatty acid synthesis, and the TCA cycle. In cancer cells, the canonical energy metabolism pathways are often truncated (glycolysis, TCA cycle) or redirected (glutaminolysis or serine and lipid biosynthesis). Briefly, glucose enters into cancer cells through glucose transporters and is phosphorylated to G6P by an irreversible reaction catalyzed by the hexokinase. G6P either proceeds through glycolysis to produce pyruvate or through the PPP to generate ribose-5-phosphate and NADPH. The PPP is connected at the first step of glycolysis starting with G6P dehydrogenase (G6PD) and has both an oxidative and nonoxidative arm. G6P oxidation produces the reducing equivalents, in the form of NADPH, important cellular antioxidant, and cofactor for fatty acid biosynthesis. Moreover, the PPP provides cancer cells with pentose sugars for the biosynthesis of nucleic acids. The first enzymes involved in the nonoxidative arm of the PPP are TKT and TA. Ribose-5-phosphate and xylulose-5-phosphate, generated by the oxidative PPP, can be further metabolized into F6P and G3P to reenter into glycolysis for ATP production, depending on the cell requirement. Thus, the PPP plays a key role in cancer cells to supply their anabolic demands and to counteract oxidative stress. The serine pathway is branched to glycolysis via 3-phosphoglycerate (3PG), which is converted by PHGDH into phosphohydroxypyruvate (P-PYR). This pathway produces serine and glycine, essential precursors for synthesis of proteins and nucleic acids through the folate cycle. Following glycolysis, pyruvate is either converted into lactate by LDHA and released through monocarboxylate transporters, MCT4 and MCT1, further causing extra cellular acidification, or converted into acetyl-CoA, through the PDH complex. Acetyl-CoA enters into TCA cycle and produces ATP, NADH, and FADH2 molecules. Reduced cofactors are then oxidized by the ETC complexes for ATP production. Glutamine and other amino acids can also replenish the TCA cycle. Indeed, the first step of glutaminolysis is the conversion of glutamine into glutamate by the GLS. Glutamate is subsequently converted into alpha-ketoglutarate (αKG) that fuels back the TCA cycle. Fatty acid degradation can also supply the TCA cycle through beta-oxidation, which produces acetyl-CoA. Reciprocally, citrate, a TCA cycle intermediate, can be used as a precursor for fatty acid synthesis and for NADPH production through the ACL. Citrate is subsequently converted to acetyl-CoA and OAA into the cytoplasm. Acetyl-CoA is used for fatty acid synthesis through its conversion to malonyl-CoA by ACC and to palmitic acid by the FASN. OAA is converted to malate, which is then decarboxylated into pyruvate, by the ME1 and produces NADPH. Mitochondria are represented by dotted line. ACC, acetyl-CoA carboxylase; ACL, ATP citrate lyase; αKG, alpha-ketoglutarate; ASCT2, amino acid transporter; ATP, adenosine triphosphate; DHAP, dihydroxyacetone phosphate; ETC, electron transport chain; FAD, flavin adenine dinucleotide; FASN, fatty acid synthase; F6P, fructose-6-phosphate; GADP, glyceraldehyde-3-phosphate; G3P, glyceraldehyde-3-phosphate; GLS, glutaminase; G6P, glucose-6-phosphate; GLUT, glucose transporter; LDHA, lactate dehydrogenase A; MCT, monocarboxylate transporter; ME1, malic enzyme; NAD, nicotinamide adenine dinucleotide; NADPH, nicotinamide adenine dinucleotide phosphate; OAA, oxaloacetate; PDH, pyruvate dehydrogenase; PEP, phospho-enol-pyruvate; 6PG, 6-phospho-gluconolactone; 3PG, 3-phopho-glycerate; PGD, phosphogluconate dehydrogenase; PHGDH, phosphoglycerate dehydrogenase; PPP, pentose phosphate pathway; P-PYR, phosphohydroxypyruvate; PSAT1, phosphoserine aminotransferase; SHMT1, serine hydroxymethyl transferase; Succ-CoA, succinyl-CoA; TCA, tricarboxylic acid; TA, transaldolase; TKT, transketolase. To see this illustration in color, the reader is referred to the web version of this article at www.liebertpub.com/ars
<b>FIG. 2.</b>
FIG. 2.
OXPHOS/glycolytic metabolism and oxidative stress heterogeneity in cancer cells. Blue left panel is a schematic representation of cancer cells relying predominantly on aerobic glycolysis. Pyruvate is preferentially oxidized into lactate (dark line). Consequently, acetyl-CoA is less incorporated into the TCA cycle (dashed line), which leads to decreased production of reducing equivalents. Some cancer cells exhibit a reciprocal phenotype, with enhancement of the OXPHOS metabolism (green right panel). Here, pyruvate is oxidized into acetyl-CoA and subsequently metabolized into the TCA cycle (dark lines), but less converted into lactate (dashed line). Mitochondrial respiration produces ATP and oxidizes electrons from reduced cofactors and reduces O2 into H2O through the ETC complexes. The various single-electron intermediates can escape and react with O2 forming ROS. OXPHOS cancer cells show elevated antioxidant programs, which help them to detoxify ROS produced by the ETC and regenerate reduced GSH. GSH, glutathione; H2O2, hydrogen peroxide; H2O, water; OXPHOS, oxidative phosphorylation; O2, oxygen; O2(−, superoxide anion radical; ROS, reactive oxygen species. To see this illustration in color, the reader is referred to the web version of this article at www.liebertpub.com/ars
<b>FIG. 3.</b>
FIG. 3.
Glutamine, serine, and fatty acids as anaplerotic sources for TCA cycle intermediates in cancer cells. In cancer cells, glutamine can fuel the TCA cycle through αKG produced by glutaminolysis. Indeed, glutamine is converted to glutamate by the mitochondrial glutaminase (GLS1) or by the cytosolique isoform (GLS2), and glutamate can be converted to αKG in the mitochondria by the glutamine dehydrogenase 1 (GLUD1). MYC oncogene drives glutamine metabolism by promoting glutamine entry into mitochondria and its conversion into glutamate. Moreover, in cancer cells, fatty acids can be degraded through beta-oxidation, which generates acetyl-CoA subsequently fueling the TCA cycle. Indeed, glutaminolysis and fatty acid beta-oxidation provide intermediates to fuel the TCA cycle, resulting in the generation of reducing equivalents, such as NADH and FADH2. This provides electrons to the ETC and leads to ATP production. TCA cycle intermediates can also be directed into biosynthetic pathways (purple boxes) enabling production of macromolecules, such as lipids, amino acids, and nucleotides. Finally, OXPHOS metabolism through ETC not only produces high levels of ROS but generates also high levels of intermediates with antioxidant capacities, such as reduced GSH and NADPH. NADPH is used as a cofactor for antioxidant enzymes, such as glutathione reductase (GR), which reduces the oxidized glutathione (GSSG) into its reduced form (GSH). Thus, high production of reducing equivalents favors ROS scavenging and prevents deleterious accumulation of ROS in the mitochondrial matrix and cytoplasm. GLUD1, glutamate dehydrogenase 1; GPX, glutathione peroxidase; IDH, isocitrate dehydrogenase; MnSOD, manganese superoxide dismutase; nicotinamide adenine dinucleotide; NH3, ammonia; SOD, superoxide dismutase. To see this illustration in color, the reader is referred to the web version of this article at www.liebertpub.com/ars
<b>FIG. 4.</b>
FIG. 4.
Schematic representation of the different levels of regulation of ETC complexes. The mtDNA encodes 13 ETC proteins, 22 tRNAs, as well as 12S and 16S rRNAs, whereas the nuclear DNA encodes approximately 1000 proteins belonging to ETC complexes. There are three levels of regulation: transcriptional, translational, and post-translational. (A) Transcriptional regulation: In the nucleus, PGC-1α and various transcription factors, such as NRF, ERR, and PPAR, bind to the regulatory regions of mitochondrial (mt) target genes and stimulate their expression. Inside mitochondria, TFAM, a mitochondrial DNA transcription factor, cooperates with the mtPOLR to induce the expression of mtDNA-encoded proteins. (B) Translational regulation: Mitochondrial-addressed proteins, which are transcribed in the nucleus, are exported into the cytoplasm, where their translation takes place via the cytoplasmic ribosomal (40S and 60S) machinery. While nuclear DNA encodes most of the mitochondrial proteins, few of them are encoded by mtDNA and synthesized by the mitochondrial translation system. mRNAs transcribed into the mitochondrial matrix are translated by the mitochondrial ribosomal 12S and 16S complexes. (C) Post-translational regulation: Upon translation, many mitochondrial proteins are synthesized as precursor proteins, with cleavable N-terminal presequences. The TOM complex allows the translocation of tagged proteins from the outer membrane barrier to the IMS. The tag signal and adjacent parts of the protein are recognized by the TOM complex, which works together with the TIM complex to translocate proteins into the mitochondria. Once imported, the N-terminal signal of the precursor protein is processed through MPP and mature isoforms are assembled into the IMS. Mitochondrial proteins, encoded by the mitochondrial or nuclear genomes, are finally assembled to form ETC complexes. ERR, estrogen-related receptor; HSP, heat shock protein; IMS, inner membrane space; MPPs, mitochondrial processing peptidases; mtDNA, mitochondrial DNA; mt, mitochondrial; NRF, nuclear respiratory factor; mtPOLR, mitochondrial RNA polymerase; PPAR, peroxisome proliferator-activated receptor; PGC-1α, peroxisome proliferator-activated receptor-γ coactivator-1α; TF, transcription factor; TIM, transporter inner membrane; TOM, translocase of the outer membrane; tRNA, transfer RNA; rRNA, ribosomal RNA. To see this illustration in color, the reader is referred to the web version of this article at www.liebertpub.com/ars
<b>FIG. 5.</b>
FIG. 5.
OXPHOS metabolism on cancer cell functions integrated into the 10 hallmarks of cancer from Hanahan and Weinberg, 2011. OXPHOS metabolism (purple box) supports high proliferative capabilities of cancer cells (green box). Reciprocally, cell cycle regulators are able to promote OXPHOS metabolism. Moreover, OXPHOS metabolism favors migration and invasion of cancer cells (orange box). Finally, OXPHOS metabolism plays an important role as it increases cancer cell stemness (blue box). To see this illustration in color, the reader is referred to the web version of this article at www.liebertpub.com/ars
<b>FIG. 6.</b>
FIG. 6.
Reciprocal impact of cancer cell metabolism on TME. (A) Oxidative Stress and TME. TAM: ROS signaling promotes M2 polarization through the ERK signaling pathway; TIL: TIL activation (differentiation in CD4+, CD8+ T cells) and expansion increase rates of glycolysis and generate excessive amount of glycerol-3-phosphate. G3P is oxidized by the mitochondrial G3P dehydrogenase 2, which in turn increases ROS production; CAF: ROS promote CAF activation and conversion of fibroblasts into myofibroblasts through TGF-β and CXCL12 (SDF-1)-dependent pathways. (B) Nutrient availability and TME. Both immune and stromal cells participate in a complex metabolic interplay with neoplastic cells. They can collectively adapt in a dynamic manner to the metabolic needs of cancer cells and thus participate in tumorigenesis. Metabolic competition between immune and tumor cells: Tumor cell metabolism modulates nutrient availability in TME, impacting macrophage polarization and immune response. High nutrient availability in the TME favors glycolysis through mTOR signaling and promotes M1 polarization and Teff differentiation. mTORC1 is involved in naïve CD4+ T-cell differentiation into T helper 1 (TH1) and T helper 17 (TH17) cells, supporting an antitumor effect. In contrast, mTORC2 promotes the differentiation of naïve CD4+ T cells into the protumorigenic T helper 2 (TH2) cells. Moreover, M2 macrophages exhibit an OXPHOS metabolism. Interestingly, blocking OXPHOS metabolism induces M1 polarization, while forcing OXPHOS metabolism in M1 macrophages potentiates M2 polarization. Glutamine deprivation promotes the differentiation of naïve CD4+ T cells into FOXP3+ Treg cells and thus induces a shift in the immune response balance, which becomes immunosuppressive. Glutamine deprivation also impacts M2 phenotype by promoting a protumorigenic response. Moreover, glucose availability is also another layer of TIL regulation. As progressing tumors have higher glucose consumption than the regressing ones, TILs from progressing tumors are glucose restricted and exhibit impaired effector functions. Blocking PD-L1 in tumor cells reduces their glycolysis rates by inhibiting mTOR activity, which consequently increases extracellular glucose availability for TILs. Thus, by modulating tumor cell metabolism, one can control nutrient availability for T cells, thus promoting either their antitumor or immunosuppressive functions. Metabolic symbiosis between CAFs and tumor cells: Increased ROS production by cancer cells, in particular the highly diffusible H2O2, stimulates HIF-1 signaling in CAFs. As a consequence, CAFs switch their metabolism toward aerobic glycolysis, through an HIF-1- and oxidative stress-dependent mechanism. This highly glycolytic rate in CAFs provides nutrient and energetic fuels, such as lactate and ketone bodies, to cancer cells. This symbiotic relationship between CAFs and tumor cells is reversible, thus representing a metabolic optimization in cancer treatments. CAF, carcinoma-associated fibroblast; Cav 1, caveolin 1; HIF-1, hypoxia-inducible factor-1; mTOR, mammalian target of rapamycin; SMA, smooth muscle cells; TAM, tumor-associated macrophage; Teff, effector T cell; TIL, tumor-infiltrated lymphocyte; TGF-β, transforming growth factor-β; Treg, regulatory T cell. To see this illustration in color, the reader is referred to the web version of this article at www.liebertpub.com/ars

References

    1. Alexeyev M, Shokolenko I, Wilson G, and LeDoux S. The maintenance of mitochondrial DNA integrity—critical analysis and update. Cold Spring Harbor Perspect Biol 5: a012641, 2013 - PMC - PubMed
    1. Amelio I, Cutruzzola F, Antonov A, Agostini M, and Melino G. Serine and glycine metabolism in cancer. Trends Biochem Sci 39: 191–198, 2014 - PMC - PubMed
    1. Anderson S, Bankier AT, Barrell BG, de Bruijn MH, Coulson AR, Drouin J, Eperon IC, Nierlich DP, Roe BA, Sanger F, Schreier PH, Smith AJ, Staden R, and Young IG. Sequence and organization of the human mitochondrial genome. Nature 290: 457–465, 1981 - PubMed
    1. Antoch G, Saoudi N, Kuehl H, Dahmen G, Mueller SP, Beyer T, Bockisch A, Debatin JF, and Freudenberg LS. Accuracy of whole-body dual-modality fluorine-18–2-fluoro-2-deoxy-D-glucose positron emission tomography and computed tomography (FDG-PET/CT) for tumor staging in solid tumors: comparison with CT and PET. J Clin Oncol 22: 4357–4368, 2004 - PubMed
    1. Augsten M, Sjoberg E, Frings O, Vorrink SU, Frijhoff J, Olsson E, Borg A, and Ostman A. Cancer-associated fibroblasts expressing CXCL14 rely upon NOS1-derived nitric oxide signaling for their tumor-supporting properties. Cancer Res 74: 2999–3010, 2014 - PubMed

Publication types

Substances