Comparative Study
. 2016 Aug;17(4):271-87.
doi: 10.1007/s10162-016-0552-1. Epub 2016 May 26.

Comparing Distortion Product Otoacoustic Emissions to Intracochlear Distortion Products Inferred from a Noninvasive Assay

Affiliations
Comparative Study

Comparing Distortion Product Otoacoustic Emissions to Intracochlear Distortion Products Inferred from a Noninvasive Assay

Glen K Martin et al. J Assoc Res Otolaryngol. 2016 Aug.

Abstract

The behavior of intracochlear distortion products (iDPs) was inferred by interacting a probe tone (f3) with the iDP of interest to produce a "secondary" distortion product otoacoustic emission termed DPOAE(2ry). Measures of the DPOAE(2ry) were then used to deduce the properties of the iDP. This approach was used in alert rabbits and anesthetized gerbils to compare ear-canal 2f1-f2 and 2f2-f1 DPOAE f2/f1 ratio functions, level/phase (L/P) maps, and interference-response areas (IRAs) to their simultaneously collected DPOAE(2ry) counterparts. These same measures were also collected in a human volunteer to demonstrate similarities with their laboratory animal counterparts and their potential applicability to humans. Results showed that DPOAEs and inferred iDPs evidenced distinct behaviors and properties. That is, DPOAE ratio functions elicited by low-level primaries peaked around an f2/f1 = 1.21 or 1.25, depending on species, while the corresponding inferred iDP ratio functions peaked at f2/f1 ratios of ~1. Additionally, L/P maps showed rapid phase variation with DPOAE frequency (fdp) for the narrow-ratio 2f1-f2 and all 2f2-f1 DPOAEs, while the corresponding DPOAE(2ry) measures evidenced relatively constant phases. Common features of narrow-ratio DPOAE IRAs, such as large enhancements for interference tones (ITs) presented above f2, were not present in DPOAE(2ry) IRAs. Finally, based on prior experiments in gerbils, the behavior of the iDP directly measured in intracochlear pressure was compared to the iDP inferred from the DPOAE(2ry) and found to be similar. Together, these findings are consistent with the notion that under certain conditions, ear-canal DPOAEs provide poor representations of iDPs and thus support a "beamforming" hypothesis. According to this concept, distributed emission components directed toward the ear canal from the f2 and basal to f2 regions can be of differing phases and thus cancel, while these same components directed toward fdp add in phase.

Keywords: DPOAEs; gerbil; human; intracochlear pressure; rabbit.


Figures

FIG. 1
FIG. 1
Diagram showing the relationship of the various stimuli (not to scale) employed in the noninvasive method and procedures designed to determine the ear-canal pressure of an external tone (EQPiDP) that yielded a DPOAE2ry equivalent to that generated by the iDP. A The primary tones (f1 and f2, black and gray waveforms, respectively) generate DP components that simultaneously propagate in the forward direction to create an iDP (blue waveform) on the BM and in the reverse direction to the ear canal to appear as the DPOAE of interest (blue text at far left). A third tone f3 (green waveform) interacts with the iDP to generate both a secondary forward propagating iDP (iDP2ry, red waveform) and reverse propagating components measurable in the ear canal as DPOAE2ry (red text at far left). The behavior of the DPOAE2ry is then used to infer the properties of the iDP. The telescope man at the bottom of A represents the intracochlear-pressure sensor used to directly measure the behavior of the iDP. B The relationships of the various stimuli and DPs plotted at their frequencies on a logarithmic-frequency axis for both a standard 1.25 and narrow 1.05 f2/f1 ratio condition that comprised some of the comparisons made in this study for both the 2f1-f2 and 2f2-f1 DPOAEs. Note that for f2/f1 ratio functions, only the primary tones are adjusted in frequency on these plots. C, D The suppression correction and “lookup” procedures, respectively, used to determine the final value of EQPiDP, which can be compared to the measured iDP pressure in A. See text for complete details of this and other illustrations.
FIG. 2
FIG. 2
Plots of f2/f1 ratio functions for a rabbit (A), gerbil (B), and a human (C) obtained for DPOAE frequencies and primary-tone levels indicated in the upper right portion of each plot. All magnitude plots (A–C) show the DPOAE (blue line), DPOAE2ry (red line), DPOAE2ry corrected for suppression (gray line), and the EQPiDP (thin black line). For all species, the DPOAE peaked at f2/f1 ratios of ~1.2–1.25 and systematically decreased in level as the narrowest ratio condition was approached. In contrast, DPOAE2ry, its level corrected for suppression, and the EQPiDP continued to increase or did not show significant decreases at narrow f2/f1 ratios, thus implying significant differences between ear-canal DPOAEs and inferred iDPs. The plot in D shows the phase behavior for the ear-canal DPOAE (blue lines) as compared to that of the phase estimated for the iDP (thin black lines). While the phase of the ear-canal DPOAE for all three species varied rapidly with the f2/f1 ratio, the phase of the inferred iDP was more constant, especially for the animal subjects. Note that the phase values for the gerbil and human have been shifted down by two and four cycles, respectively, to facilitate comparisons between species on the same plot.
FIG. 3
FIG. 3
Simultaneously collected level and phase maps (L/P maps) of DPOAE and DPOAE2ry as a function of DP frequency and f2/f1 ratio for a rabbit (A–D), gerbil (E–H), and human (I–L) obtained at the primary-tone levels indicated at the upper right corner of each plot. Plots in M and N depict horizontal slices for 2f1-f2 at f2/f1 ratio = 1.05 through the human DPOAE and DPOAE2ry L/P maps demarcated by blue and red horizontal lines in I–L. The previous data in Figure 2 can be visualized as vertical slices through such L/P maps. In general, the maps show that the same properties revealed by the f2/f1 ratio functions depicted in Figure 2 are repeatable across large-frequency expanses. In addition, the maps and slices show that while DPOAE phase can vary rapidly with DP frequency, at constant narrow f2/f1 ratios, the corresponding DPOAE2ry phase was more constant along this trajectory as well.
FIG. 4
FIG. 4
Simultaneously collected interference-response areas (IRAs) showing level and phase variations for a fixed 2f1-f2 at f2/f1 = 1.05 DPOAE and corresponding DPOAE2ry in response to an IT presented at all the levels and frequencies indicated on the axes for a rabbit (A–D), gerbil (E–H), and human (I–L). The control level in dB SPL of the ear-canal DPOAE or DPOAE2ry without the IT is indicated within the white square in the upper right-hand corner of each level plot. In general, DPOAEs at these narrow f2/f1 ratios showed level enhancements accompanied by phase changes in response to ITs above f2, while their DPOAE2ry counterparts showed no such changes. Overall, these findings support the notion that there can be substantial differences between the behavior of the DPOAE as compared to that of a simultaneously measured DPOAE2ry.
FIG. 5
FIG. 5
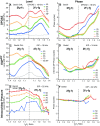
Simultaneously collected high-frequency gerbil ear-canal DPOAEs and EQPiDP f2/f1 ratio functions at a range of primary levels in A–D are compared with similar functions collected directly from intracochlear-pressure sensors near the BM in a different gerbil (E, F). While the ear-canal DPOAE functions generally peaked at optimal f2/f1 ratios around 1.25 in A, and were accompanied by rapid phase changes depicted in B, the EQPiDP level functions in C peaked at narrow ratios for lower-level primaries and plateaued in response to higher-level primary tones for the 2f2-f1 while being accompanied by relatively more constant phases in D. The highest 75-dB SPL level EQPiDP (red line) could not be determined for 2f1-f2 at f2/f1 ratios <1.05 and for 2f2-f1, since the corresponding DPOAE2ry measures were suppressed to the NF for this higher primary-tone level condition. The direct intracochlear-pressure measurements in E and F look more similar to the inferred iDP functions in C and D than to the ear-canal DPOAE functions in A and B.

Similar articles

Cited by

References

    1. Allen JB, Fahey PF. A second cochlear-frequency map that correlates distortion product and neural tuning measurements. J Acoust Soc Am. 1993;94:809–816. doi: 10.1121/1.408182. - DOI - PubMed
    1. Avan P, Buki B, Petit C. Auditory distortions: origins and functions. Physiol Rev. 2013;93:1563–1619. doi: 10.1152/physrev.00029.2012. - DOI - PubMed
    1. Cooper NP, Rhode WS. Mechanical responses to two-tone distortion products in the apical and basal turns of the mammalian cochlea. J Neurophysiol. 1997;78:261–270. - PubMed
    1. de Boer E, Nuttall AL, Hu N, Zou Y, Zheng J. The Allen-Fahey experiment extended. J Acoust Soc Am. 2005;117:1260–1266. doi: 10.1121/1.1856229. - DOI - PubMed
    1. Dong W, Olson ES. Two-tone distortion in intracochlear pressure. J Acoust Soc Am. 2005;117:2999–3015. doi: 10.1121/1.1880812. - DOI - PMC - PubMed

Publication types

LinkOut - more resources