. 2016 Jul 29;353(6298):aaf7907.
doi: 10.1126/science.aaf7907. Epub 2016 May 26.

Whole-organism lineage tracing by combinatorial and cumulative genome editing

Affiliations

Whole-organism lineage tracing by combinatorial and cumulative genome editing

Aaron McKenna et al. Science. .

Abstract

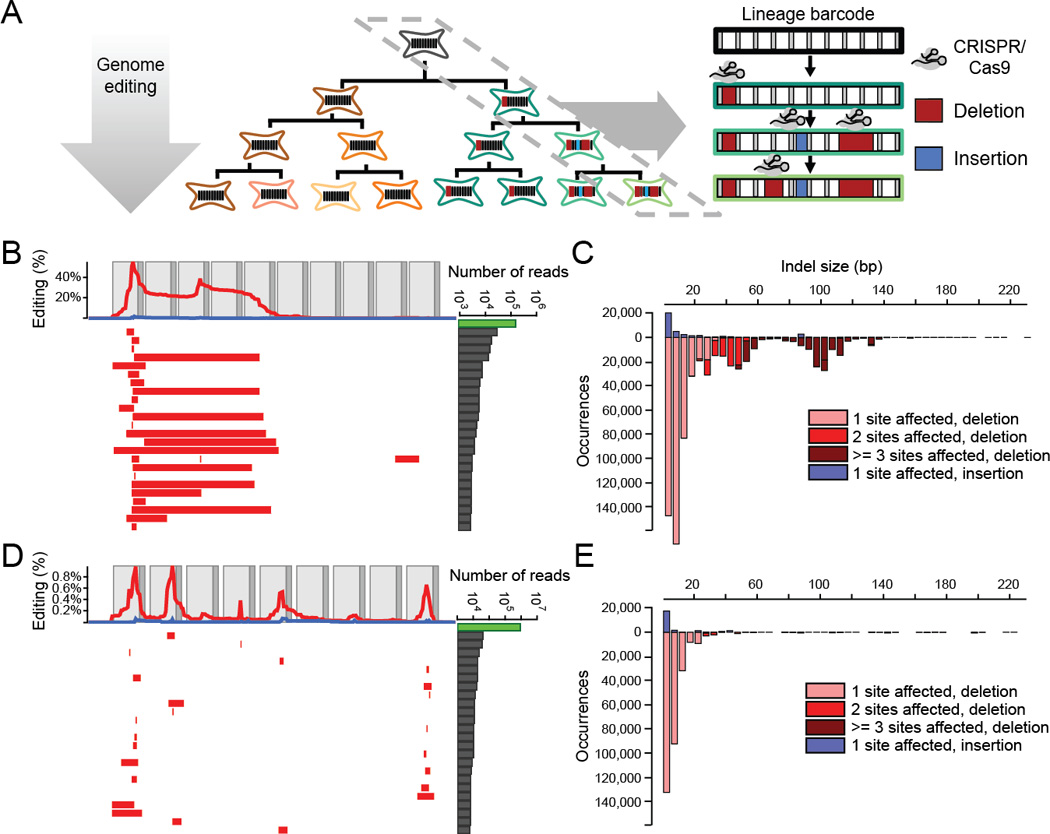
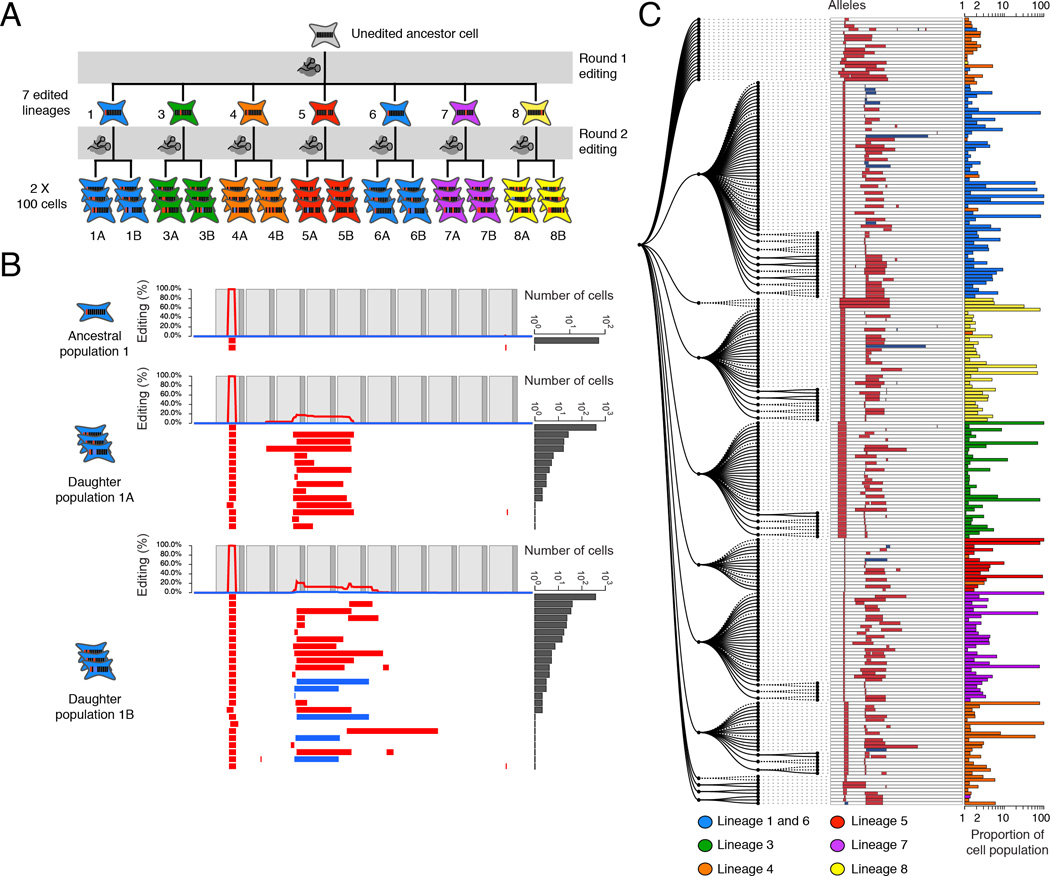
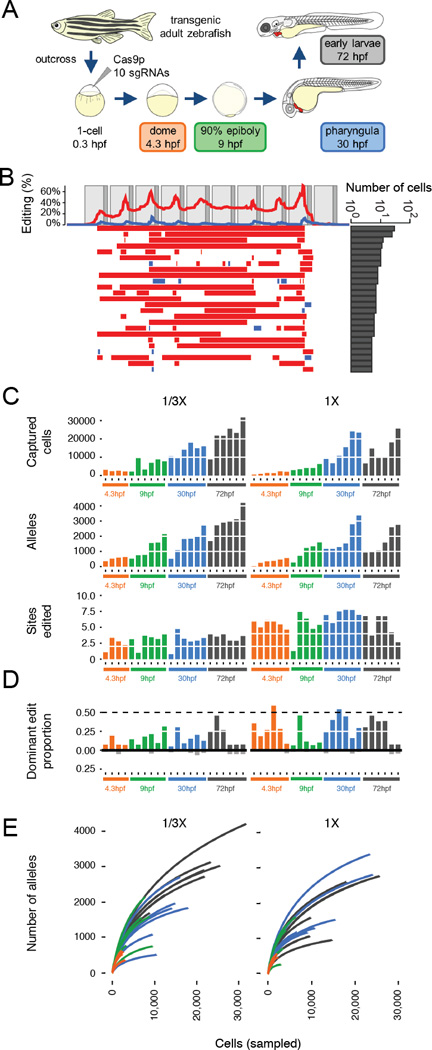
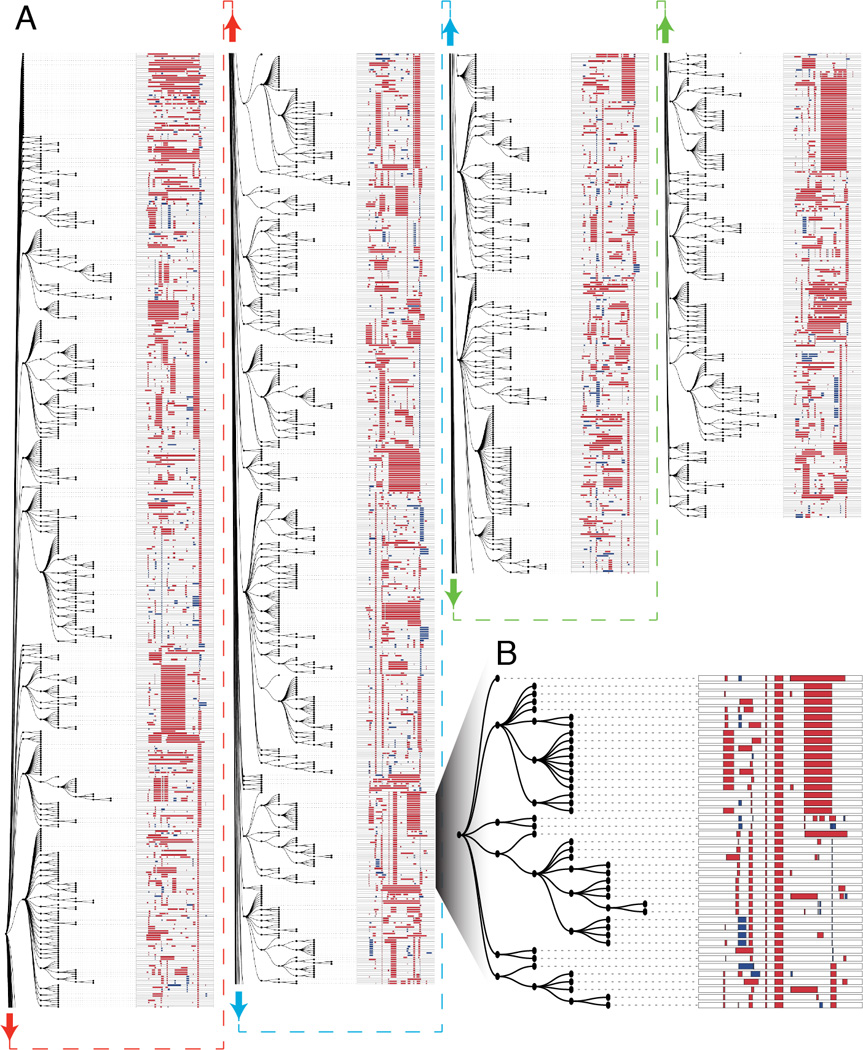
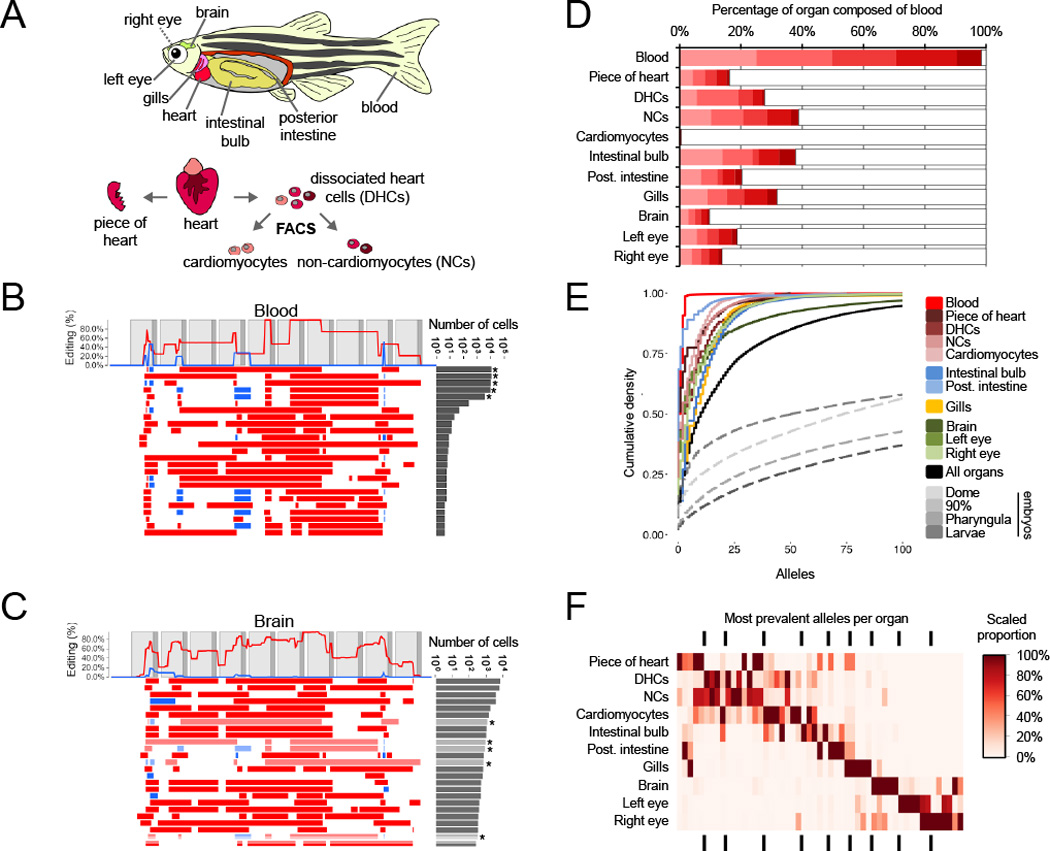
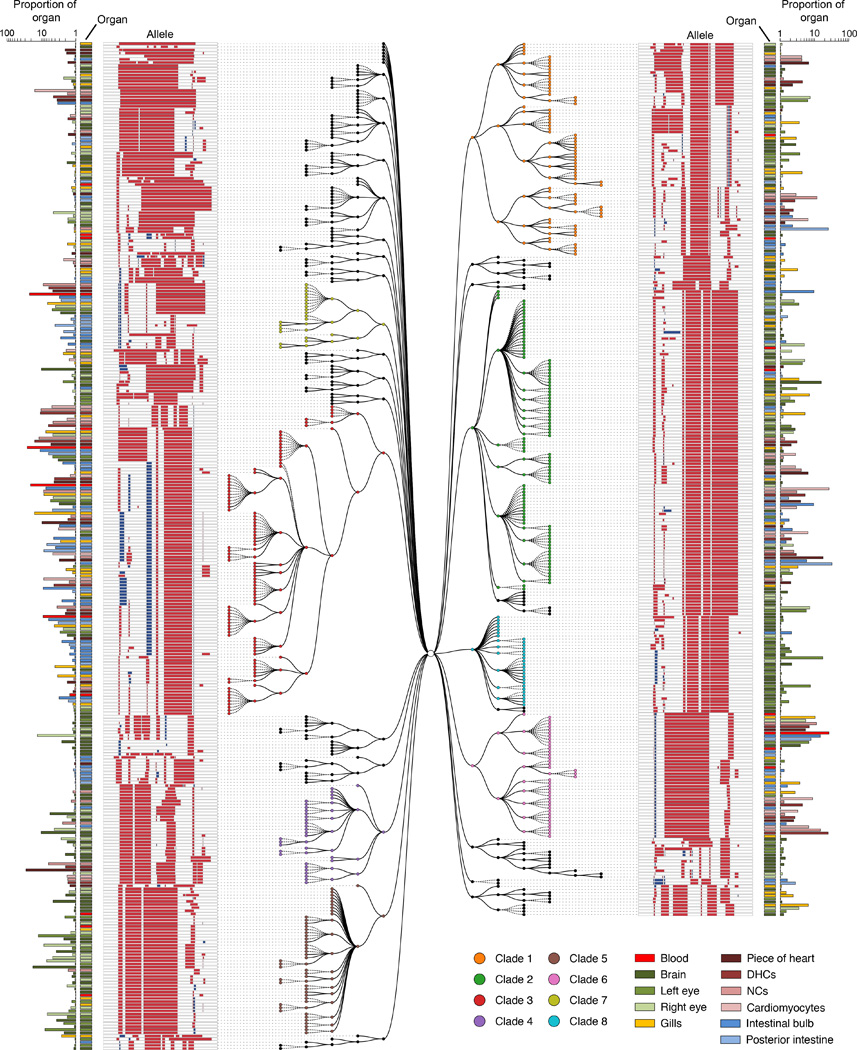
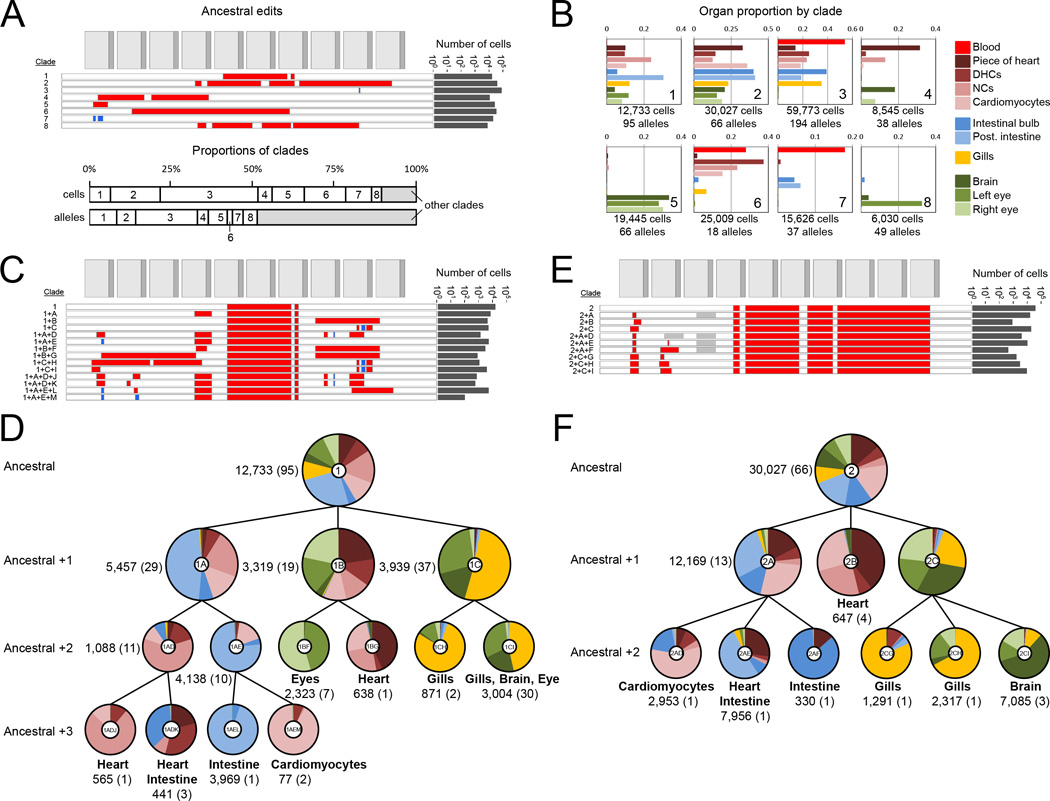
Multicellular systems develop from single cells through distinct lineages. However, current lineage-tracing approaches scale poorly to whole, complex organisms. Here, we use genome editing to progressively introduce and accumulate diverse mutations in a DNA barcode over multiple rounds of cell division. The barcode, an array of clustered regularly interspaced short palindromic repeats (CRISPR)/Cas9 target sites, marks cells and enables the elucidation of lineage relationships via the patterns of mutations shared between cells. In cell culture and zebrafish, we show that rates and patterns of editing are tunable and that thousands of lineage-informative barcode alleles can be generated. By sampling hundreds of thousands of cells from individual zebrafish, we find that most cells in adult organs derive from relatively few embryonic progenitors. In future analyses, genome editing of synthetic target arrays for lineage tracing (GESTALT) can be used to generate large-scale maps of cell lineage in multicellular systems for normal development and disease.


Figures

Figure 1
Figure 1. Genome editing of synthetic target arrays for lineage tracing (GESTALT)
(A) An unmodified array of CRISPR/Cas9 target sites (i.e., a barcode) is engineered into a genome (gray cell). Editing reagents are introduced during expansion of cell culture or in vivo development of an organism, resulting in a unique pattern of insertions and deletions (right), and are stably accumulated in specific lineages (green cell lineage). The lineage relationships of alleles that differ in sequence can often be inferred on the basis of these accumulated edits. (B) The 25 most frequent alleles from the edited v1 barcode are shown. Each row corresponds to a unique sequence, with red bars indicating deleted regions and blue bars indicating insertion positions. Blue bars begin at the insertion site, with their width proportional to the size of the insertion, which will rarely obscure immediately adjacent deletions. The number of reads observed for each allele is plotted at the right (log10 scale; the green bar corresponds to the unedited allele). The frequency at which each base is deleted (red) or flanks an insertion (blue) is plotted at the top. Light gray boxes indicate the location of CRISPR protospacers while dark gray boxes indicate PAM sites. For the v1 array, inter-target deletions involving sites 1, 3 and 5, or focal (single target) edits of sites 1 and 3 were observed predominantly. (C) A histogram of the size distribution of insertion (top) and deletion (bottom) edits to the v1 array is shown. The colors indicate the number of target sites impacted. Although most edits are short and impact a single target, a substantial proportion of edits are inter-target deletions. (D) We tested three array designs in addition to v1, each comprising nine to ten weaker off-target sites for the same sgRNA (v2-v4) (22). Editing of the v2 array is shown with layout as described in panel (B). Editing of the v3 and v4 array are shown in fig. S3A and B. The weaker sites within these alternative designs exhibit lower rates of editing than the v1 array, but also a much lower proportion of inter-target deletions. (E) A histogram of the size distribution of insertion (top) and deletion (bottom) edits to the v2 array is shown. In contrast with the v1 array, almost all edits impact only a single target.
Figure 2
Figure 2. Reconstruction of a synthetic lineage based on genome editing and targeted sequencing of edited barcodes
(A) A monoclonal population of cells was subjected to editing of the v1 array. Single cells were expanded, sampled (#1 to #12), re-transfected to induce a second round of barcode editing, and then expanded and sampled from 100-cell subpopulations (#1a, 1b to #12a, 12b). For clarity, the five clones where the original population was unedited are not shown. (B) Alleles observed in the synthetic lineage experiment are shown, with layout as described in the Fig. 1B legend. Cell population #1 represents sampling of cells that had been subjected to only the first round of editing; virtually all cells contain a shared edit to the first target. Populations #1a and #1b are derived from #1 but subjected to a second round of editing prior to sampling. These retain the edit to the first target, but subpopulations bear additional edits to other targets. (C) Maximum parsimony reconstruction using PHYLIP Mix (see Materials and Methods and fig. S4B) from alleles seen two or more times in the seven cell lineages represented in panel (A). Lineage membership and abundance of each allele are shown on the right. Progenitor cell lineage #4 (orange) appears to be derived from two cells, one edited and the other wild-type: only 62% of lineage #4 falls into a single clade, consistent with the proportion (64%) of the lineage edited after the first round. We assume that cells unedited in the first round either accrued edits matching other lineages (thus causing mixing), or accrued different edits (thus remaining outside the major clades).
Figure 3
Figure 3. Generating combinatorial barcode diversity in transgenic zebrafish
(A) One-cell zebrafish embryos were injected with complexed Cas9 ribonucleoproteins (RNPs) containing sgRNAs that matched each of the 10 targets in the array (v6 or v7). Embryos were collected at time points indicated. UMI-tagged barcodes were amplified and sequenced from genomic DNA. (B) Patterns of editing in alleles recovered from a 30 hpf v6 embryo, with layout as described in the Fig. 1B legend. (C) Bar plots show the number of cells sampled (top), unique alleles observed (middle) and proportion of sites edited (bottom) for 45 v7 embryos collected at four developmental time-points and two levels of Cas9 RNP (1/3x, 1x). Colors correspond to stages shown in panel (A). Although more alleles are observed with sampling of larger numbers of cells at later time points, the proportion of target sites edited remains relatively constant. (D) Bar plots show the proportion of edited barcodes containing the most common editing event in a given embryo. Six of 45 embryos had the most common edit in approximately 50% of cells (dashed line), consistent with this edit having occurred at the two-cell stage (see fig. S8A for example). Colors correspond to stages shown in panel (A). These same edits are rarer or absent in other embryos (black bars below). (E) For each of the 45 v7 embryos, all barcodes observed were sampled without replacement. The cumulative number of unique alleles observed as a function of the number of cells sampled is shown (average of the 500 iterations shown per embryo; two levels of Cas9 RNP: 1/3x on left, 1x on right). The number of unique alleles observed, even in later developmental stages where we are sampling much larger numbers of cells, appears to saturate, and there is no consistent pattern supporting substantially greater diversity in later time-points, consistent with the bottom row of panel (C) in supporting the conclusion that the majority of editing occurs before dome stage.
Figure 4
Figure 4. Lineage reconstruction of an edited zebrafish embryo
(A) A lineage reconstruction of 1,323 alleles recovered from the v6 embryo also represented in Fig. 3B, generated by a maximum parsimony approach implemented in the PHYLIP Mix package (see Materials and Methods and fig. S4B). A dendrogram to the left of each column represents the lineage relationships, and the alleles are represented on the right. Each row represents a unique allele. Matched colored arrows and dashed lines connect subsections of the tree together. There are many large clades of alleles sharing specific edits, as well as sub-clades defined by ‘dependent’ edits. These dependent edits occur within a clade defined by a more frequent edit but are rare or absent elsewhere in the tree. (B) A portion of the tree is shown at higher resolution. Two edits are shared by all alleles in this clade. Six independent edits define descendent sub-clades within this clade, and further edits define additional sub-sub-clades within the clade.
Figure 5
Figure 5. Organ-specific progenitor cell dominance
(A) The indicated organs were dissected from a single adult v7 transgenic edited zebrafish (ADR1). A blood sample was collected as described in the Methods. The heart was further split into the four samples shown (fig. S10). (B) Patterns of editing in the most prevalent 25 alleles (out of 135 total) recovered from the blood sample. Layout as described in the Fig. 1B legend. The most prevalent 5 alleles (indicated by asterisks) comprise >98% of observed cells. (C) Patterns of editing in the most prevalent 25 alleles (out of 399 total) recovered from brain. Layout as described in the Fig. 1B legend. Alleles that have identical editing patterns compared to the most prevalent blood alleles are indicated by asterisks and light shading. (D) The five dominant blood alleles (shades of red) are present in varying proportions (10–40%) in all intact organs except the FACS-sorted cardiomyocyte population (0.5%). All other alleles are summed in grey. (E) The cumulative proportion of cells (y-axis) represented by the most frequent alleles (x-axis) for each adult organ of ADR1 is shown, as well as the adult organs in aggregate. In all adult organs except blood, the five dominant blood alleles are excluded. All organs exhibit dominance of sampled cells by a small number of progenitors, with fewer than 7 alleles comprising the majority of cells. For comparison, a similar plot for the median embryo (dashed) from each time-point of the developmental time course experiment is also shown. (F) The distribution of the most prevalent alleles for each organ, after removal of the five dominant blood alleles, across all organs. The most prevalent alleles were defined as being at >5% abundance in a given organ (median 5 alleles, range 4–7). Organ proportions were normalized by column and colored as shown in legend. Underlying data presented in table S2.
Figure 6
Figure 6. Lineage reconstruction for adult zebrafish ADR1
Unique alleles sequenced from adult zebrafish organs can be related to one another using a maximum parsimony approach implemented in the PHYLIP Mix package (see Materials and Methods and fig. S4B). For reasons of space, we show a tree reconstructed from the 601 ADR1 alleles observed at least five times in individual organs. Eight major clades are displayed with colored nodes, each defined by ‘ancestral’ edits that are shared by all alleles assigned to that clade (shown in Fig. 7A). Editing patterns in individual alleles are represented as shown previously. Alleles observed in multiple organs are plotted on separate lines per organ and are connected with stippled branches. Two sets of bars outside the alleles identify the organ in which the allele was observed and the proportion of cells in that organ represented by that allele (log scale).
Figure 7
Figure 7. Clades and subclades corresponding to inferred progenitors exhibit increasing levels of organ restriction
(A) Top panel: The parsimony inferred ancestral edits that define eight major clades of ADR1 are shown, with the total number of cells in which these are observed indicated on the right. Bottom panel: Contributions of the eight major clades to all cells or all alleles. 19 alleles (out of 1,138 total) that contained ancestral edits from more than one clade were excluded from assignment to any clade, and any further lineage analysis. (B) Contributions of each of the eight major clades to each organ, displayed as a proportion of each organ. To accurately display the contributions of the eight major clades to each organ, we first re-assigned the five dominant blood alleles from other organs back to the blood. The total number of cells and alleles within a given major clade are listed below. The clade contributions of all clades and subclades are presented in table S3. For heart subsamples, ‘piece of heart’ = a piece of heart tissue, ‘DHCs’ = dissociated unsorted cells; ‘cardiomyocytes’ = FACS-sorted GFP+ cardiomyocytes; and ‘NCs’ = non-cardiomyocyte heart cells. (C) and (E) Edits that define subclades of clade #1 (C) and clade #2 (E), with the total number of cells in which these are observed indicated on the right. A grey box indicates an unedited site or sites, distinguishing it from related alleles that contain an edit at this location. (D) and (F) Lineage trees corresponding to subclades of clade #1 (D) and clade #2 (F) that show how dependent edits are associated with increasing lineage restriction. The pie chart at each node indicates the organ distribution within a clade or subclade. Ratios of cell proportions are plotted, a normalization that accounts for differential depth of sampling between organs. Labels in the center of each pie chart correspond to the subclade labels in (C) and (E). Alleles present in a clade but not assigned to a descendent subclade (either they have no additional lineage restriction or are at low abundance) are not plotted for clarity. The number of cells (and the number of unique alleles) are also listed, and terminal nodes also list major organ restriction(s), i.e. those comprising >25% of a subclade by proportion.

Comment in

References

    1. Stent GS. Developmental cell lineage. Int. J. Dev. Biol. 1998;42:237–241. - PubMed
    1. Sulston JE, Schierenberg E, White JG, Thomson JN. The embryonic cell lineage of the nematode Caenorhabditis elegans. Developmental Biology. 1983;100:64–119. - PubMed
    1. Kretzschmar K, Watt FM. Lineage Tracing. Cell. 2012;148:33–45. - PubMed
    1. Kimmel CB, Law RD. Cell lineage of zebrafish blastomeres. III. Clonal analyses of the blastula and gastrula stages. Developmental Biology. 1985;108:94–101. - PubMed
    1. Keller RE. Vital dye mapping of the gastrula and neurula of Xenopus laevis. I. Prospective areas and morphogenetic movements of the superficial layer. Developmental Biology. 1975;42:222–241. - PubMed

Publication types