

Weight gain in anorexia nervosa does not ameliorate the faecal microbiota, branched chain fatty acid profiles, and gastrointestinal complaints
- PMID: 27229737
- PMCID: PMC4882621
- DOI: 10.1038/srep26752
Weight gain in anorexia nervosa does not ameliorate the faecal microbiota, branched chain fatty acid profiles, and gastrointestinal complaints
Abstract
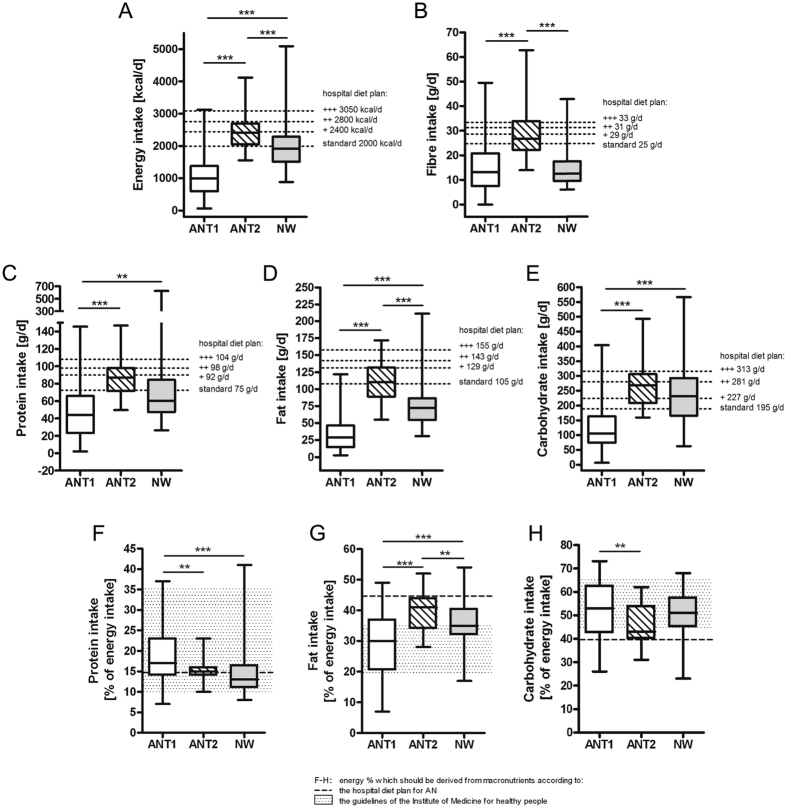
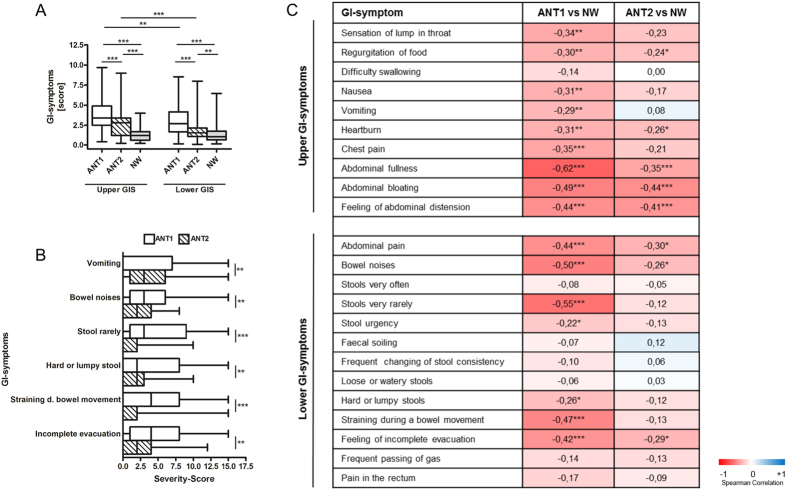
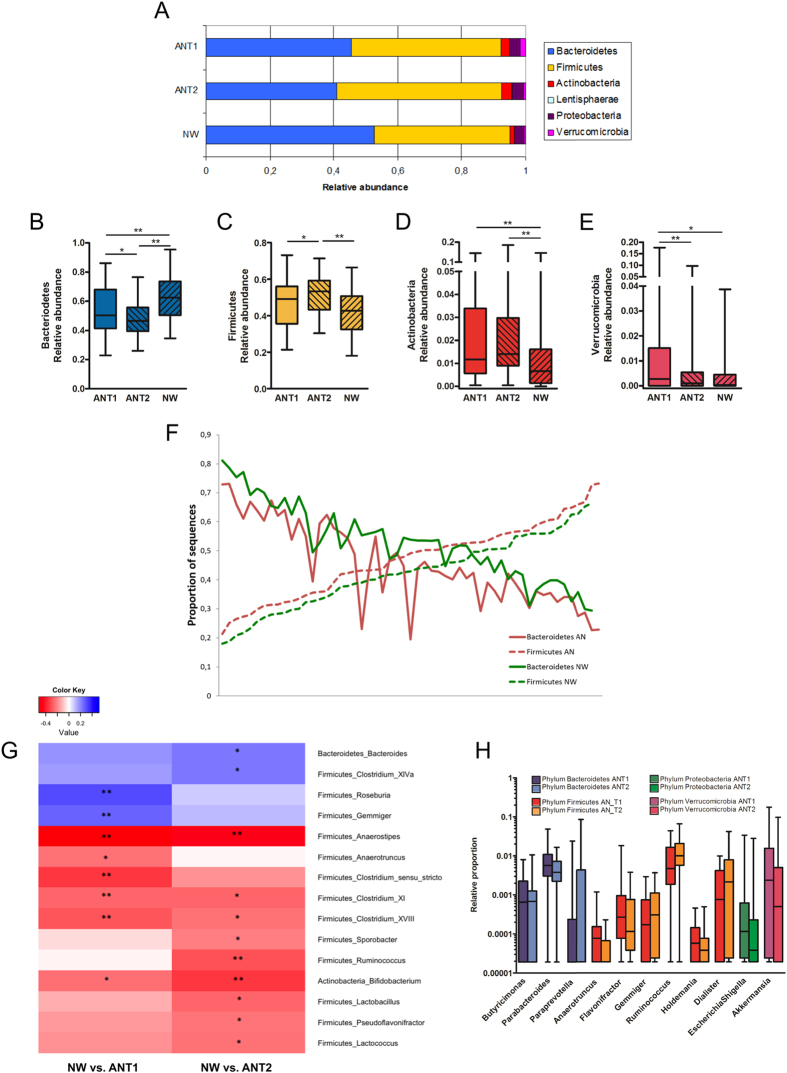
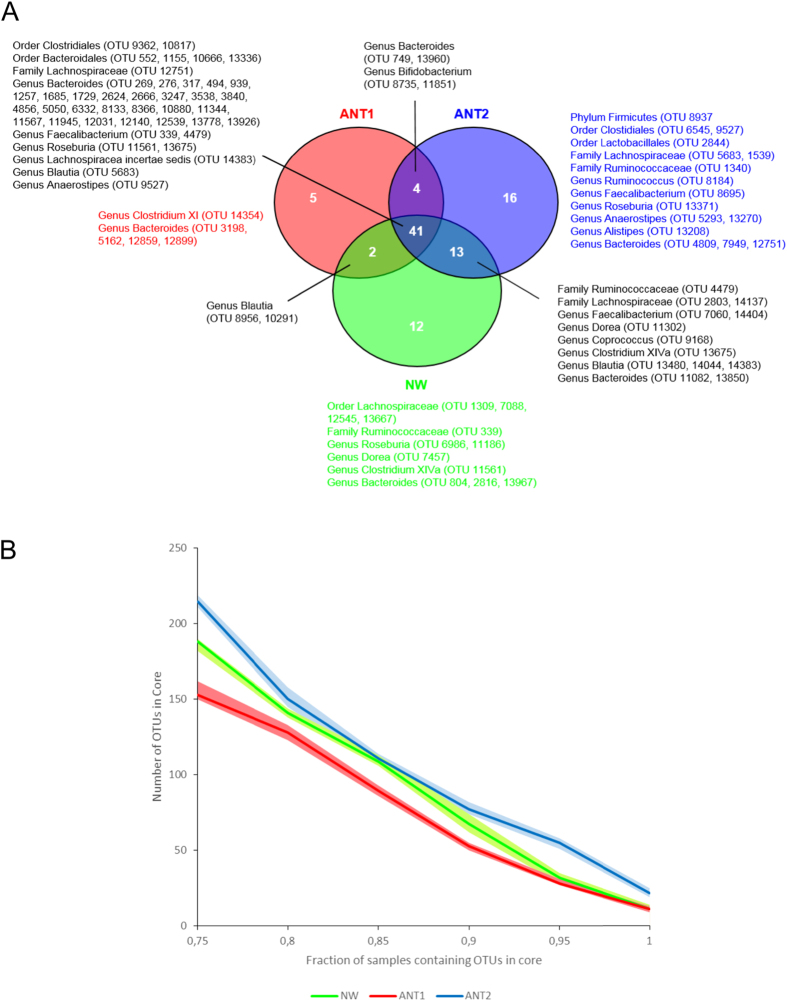
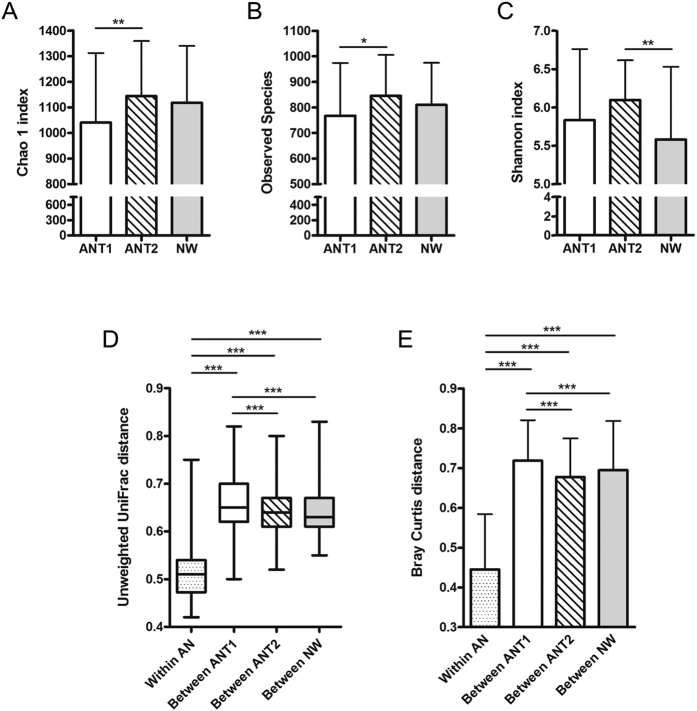
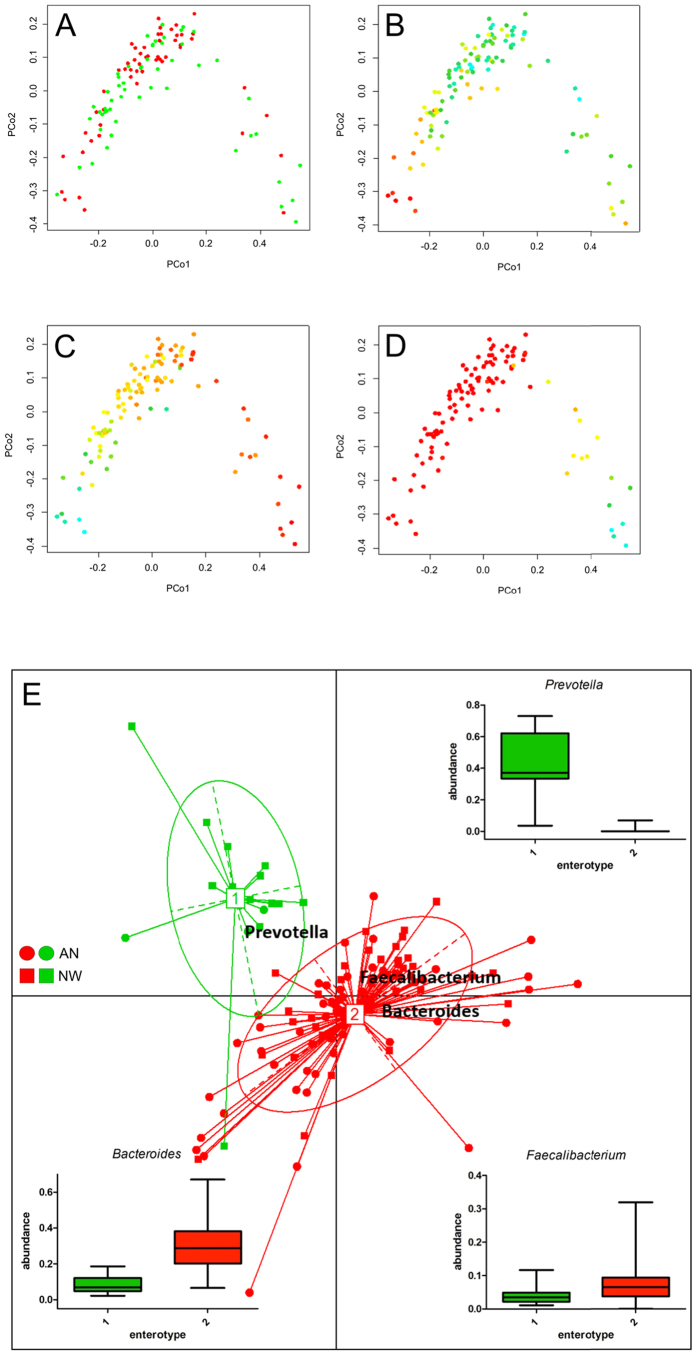
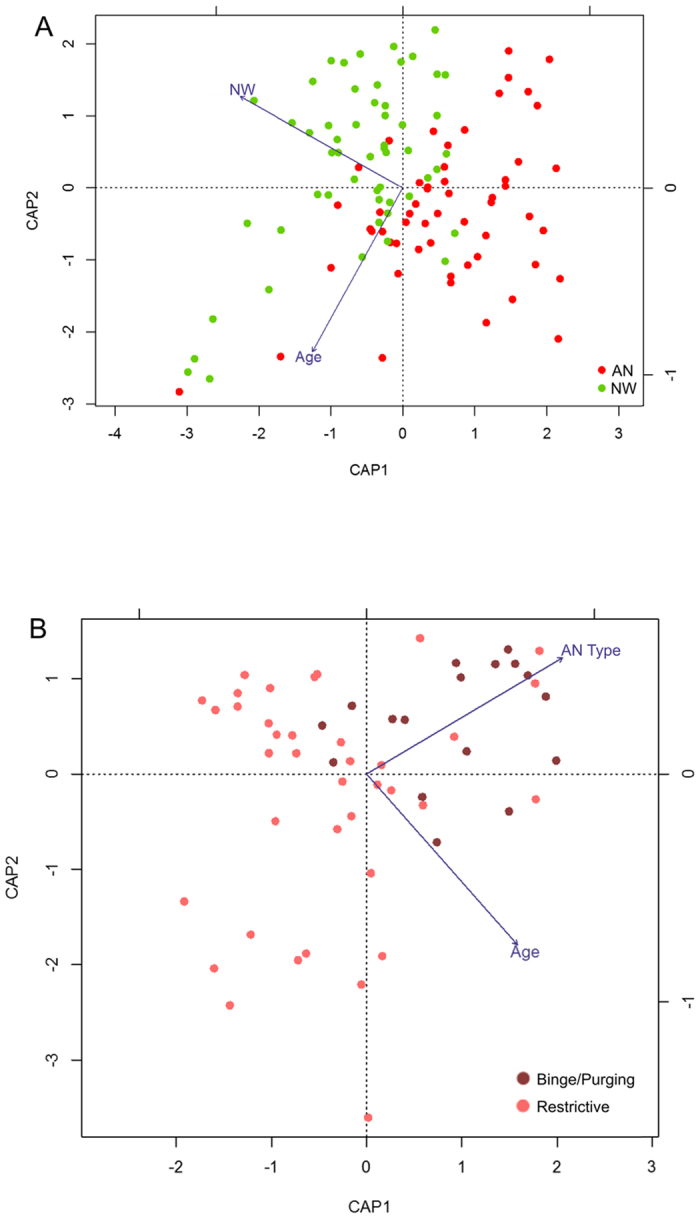
The gut microbiota not only influences host metabolism but can also affect brain function and behaviour through the microbiota-gut-brain axis. To explore the potential role of the intestinal microbiota in anorexia nervosa (AN), we comprehensively investigated the faecal microbiota and short-chain fatty acids in these patients before (n = 55) and after weight gain (n = 44) in comparison to normal-weight participants (NW, n = 55) along with dietary intake and gastrointestinal complaints. We show profound microbial perturbations in AN patients as compared to NW participants, with higher levels of mucin-degraders and members of Clostridium clusters I, XI and XVIII and reduced levels of the butyrate-producing Roseburia spp. Branched-chain fatty acid concentrations, being markers for protein fermentation, were elevated. Distinct perturbations in microbial community compositions were observed for individual restrictive and binge/purging AN-subtypes. Upon weight gain, microbial richness increased, however perturbations in intestinal microbiota and short chain fatty acid profiles in addition to several gastrointestinal symptoms did not recover. These insights provide new leads to modulate the intestinal microbiota in order to improve the outcomes of the standard therapy.
Figures
Similar articles
-
The intestinal microbiota and metabolites in patients with anorexia nervosa.Gut Microbes. 2021 Jan-Dec;13(1):1-25. doi: 10.1080/19490976.2021.1902771. Gut Microbes. 2021. PMID: 33779487 Free PMC article.
-
Microbiota in anorexia nervosa: The triangle between bacterial species, metabolites and psychological tests.PLoS One. 2017 Jun 21;12(6):e0179739. doi: 10.1371/journal.pone.0179739. eCollection 2017. PLoS One. 2017. PMID: 28636668 Free PMC article.
-
Association of birth mode of delivery with infant faecal microbiota, potential pathobionts, and short chain fatty acids: a longitudinal study over the first year of life.BJOG. 2021 Jul;128(8):1293-1303. doi: 10.1111/1471-0528.16633. Epub 2021 Feb 1. BJOG. 2021. PMID: 33338292 Free PMC article.
-
A systematic review on the role of microbiota in the pathogenesis and treatment of eating disorders.Eur Psychiatry. 2020 Dec 16;64(1):e2. doi: 10.1192/j.eurpsy.2020.109. Eur Psychiatry. 2020. PMID: 33416044 Free PMC article.
-
Anorexia nervosa and gut microbiota: A systematic review and quantitative synthesis of pooled microbiological data.Prog Neuropsychopharmacol Biol Psychiatry. 2021 Mar 2;106:110114. doi: 10.1016/j.pnpbp.2020.110114. Epub 2020 Sep 22. Prog Neuropsychopharmacol Biol Psychiatry. 2021. PMID: 32971217
Cited by
-
Gastrointestinal complaints in patients with anorexia nervosa in the timecourse of inpatient treatment.Front Psychiatry. 2022 Aug 18;13:962837. doi: 10.3389/fpsyt.2022.962837. eCollection 2022. Front Psychiatry. 2022. PMID: 36061281 Free PMC article.
-
Brain and gut microbiota disorders in the psychopathology of anorexia nervosa.Transl Neurosci. 2022 Dec 31;13(1):516-526. doi: 10.1515/tnsci-2022-0267. eCollection 2022 Jan 1. Transl Neurosci. 2022. PMID: 36660007 Free PMC article. Review.
-
Linking the Gut Microbiota to Bone Health in Anorexia Nervosa.Curr Osteoporos Rep. 2018 Feb;16(1):65-75. doi: 10.1007/s11914-018-0420-5. Curr Osteoporos Rep. 2018. PMID: 29417446 Review.
-
A microbial signature for Crohn's disease.Gut. 2017 May;66(5):813-822. doi: 10.1136/gutjnl-2016-313235. Epub 2017 Feb 7. Gut. 2017. PMID: 28179361 Free PMC article.
-
Gut Microbiota in Obesity and Undernutrition.Adv Nutr. 2016 Nov 15;7(6):1080-1089. doi: 10.3945/an.116.012914. Print 2016 Nov. Adv Nutr. 2016. PMID: 28140325 Free PMC article. Review.
References
-
- Arcelus J., Mitchell A. J., Wales J. & Nielsen S. Mortality rates in patients with anorexia nervosa and other eating disorders. A meta-analysis of 36 studies. Arch Gen Psychiatry 68, 724–31 (2011). - PubMed
-
- Zipfel S., Lowe B., Reas D. L., Deter H. C. & Herzog W. Long-term prognosis in anorexia nervosa: lessons from a 21-year follow-up study. Lancet 355, 721–2 (2000). - PubMed
-
- Zipfel S. et al. Focal psychodynamic therapy, cognitive behaviour therapy, and optimised treatment as usual in outpatients with anorexia nervosa (ANTOP study): randomised controlled trial. Lancet 383, 127–37 (2014). - PubMed
-
- Dejong H., Broadbent H. & Schmidt U. A systematic review of dropout from treatment in outpatients with anorexia nervosa. Int J Eat Disord 45, 635–47 (2012). - PubMed
Publication types
MeSH terms
Substances
Associated data
LinkOut - more resources
Full Text Sources
Other Literature Sources
Medical
Miscellaneous
