. 2017 Feb;16(1):15-32.
doi: 10.1007/s10237-016-0799-9. Epub 2016 May 26.

A mathematical model for the simulation of the formation and the subsequent regression of hypertrophic scar tissue after dermal wounding

Affiliations

A mathematical model for the simulation of the formation and the subsequent regression of hypertrophic scar tissue after dermal wounding

Daniël C Koppenol et al. Biomech Model Mechanobiol. 2017 Feb.

Abstract

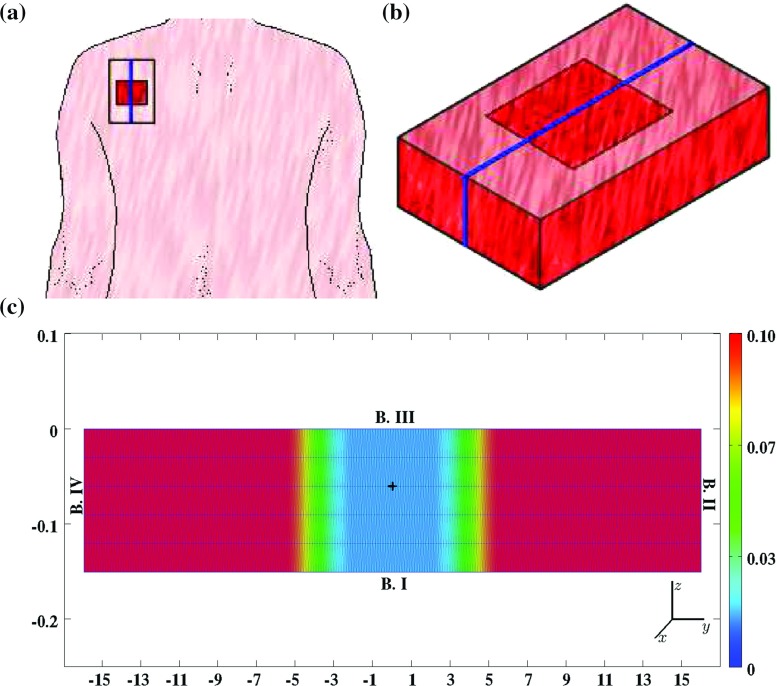
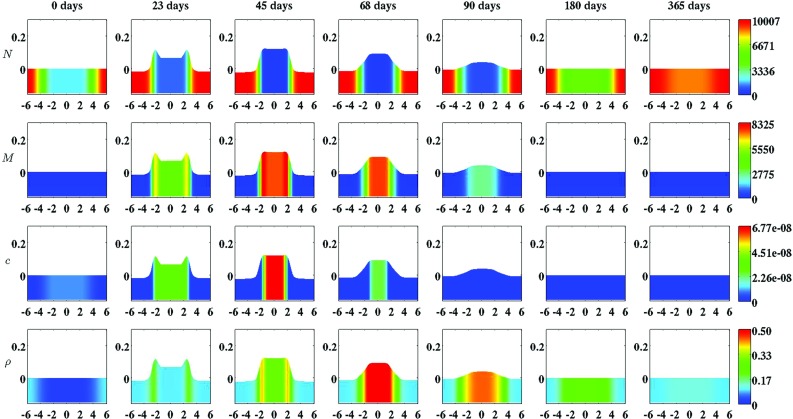
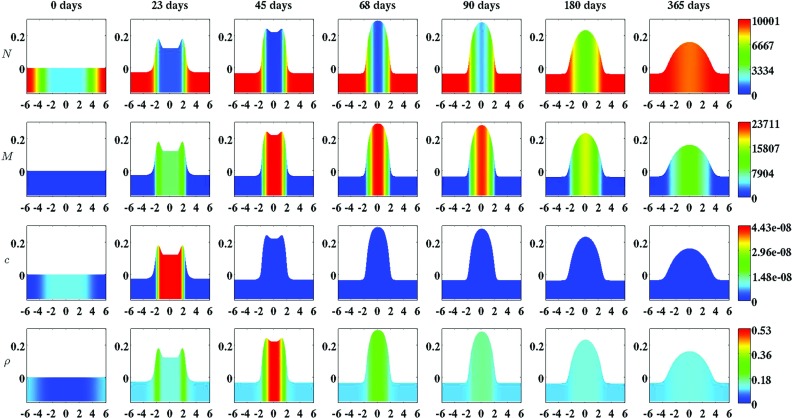
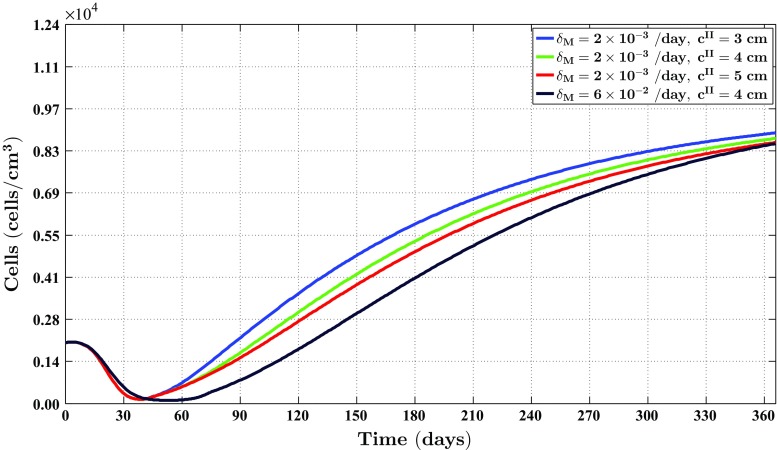
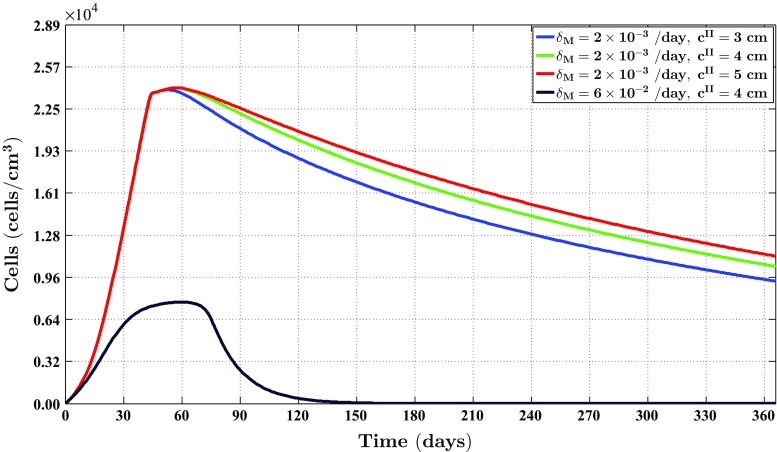
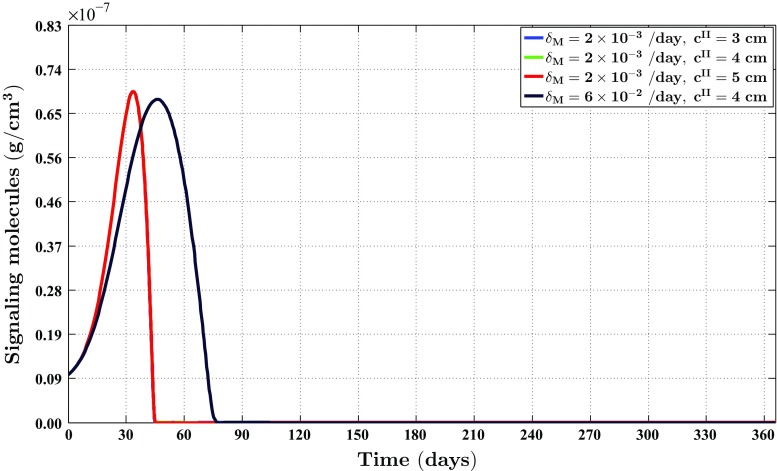
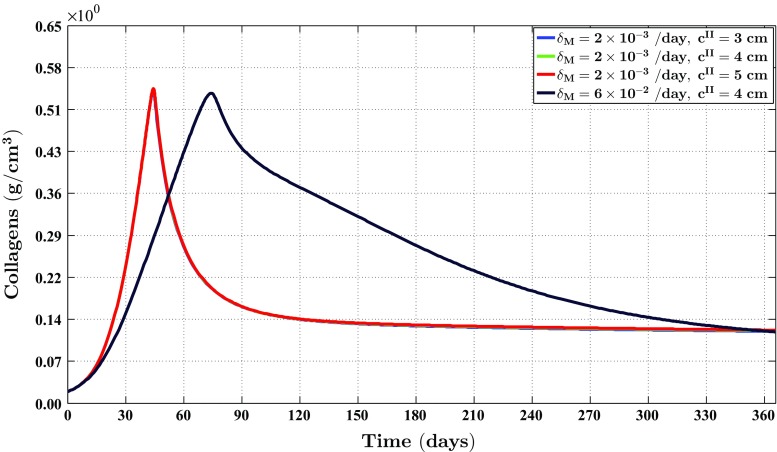
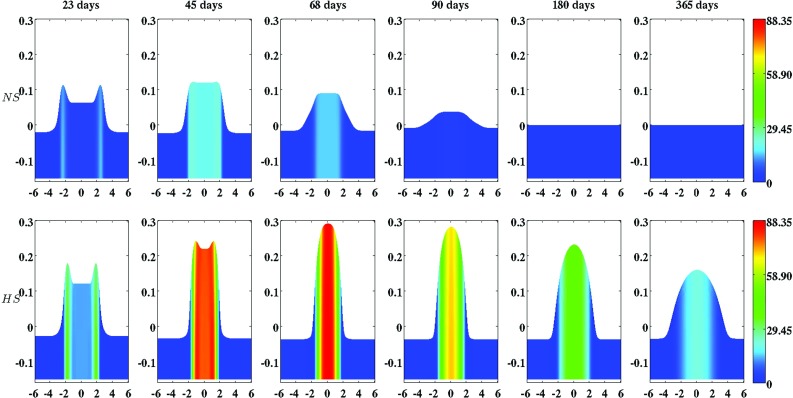
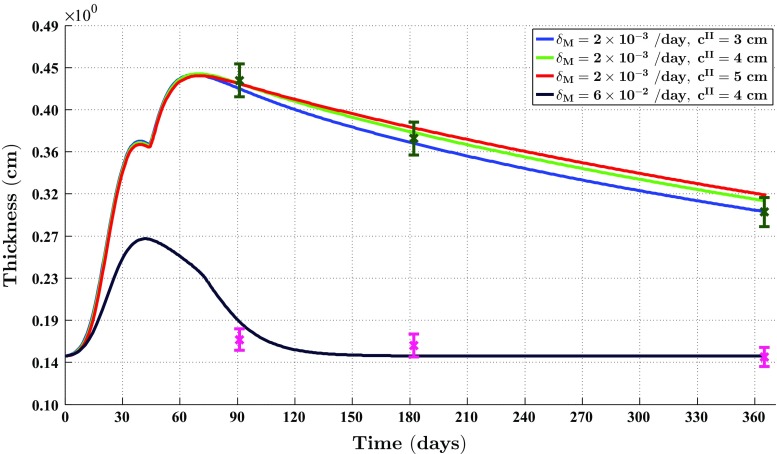
A continuum hypothesis-based model is presented for the simulation of the formation and the subsequent regression of hypertrophic scar tissue after dermal wounding. Solely the dermal layer of the skin is modeled explicitly and it is modeled as a heterogeneous, isotropic and compressible neo-Hookean solid. With respect to the constituents of the dermal layer, the following components are selected as primary model components: fibroblasts, myofibroblasts, a generic signaling molecule and collagen molecules. A good match with respect to the evolution of the thickness of the dermal layer of scars between the outcomes of simulations and clinical measurements on hypertrophic scars at different time points after injury in human subjects is demonstrated. Interestingly, the comparison between the outcomes of the simulations and the clinical measurements demonstrates that a relatively high apoptosis rate of myofibroblasts results in scar tissue that behaves more like normal scar tissue with respect to the evolution of the thickness of the tissue over time, while a relatively low apoptosis rate results in scar tissue that behaves like hypertrophic scar tissue with respect to the evolution of the thickness of the tissue over time. Our ultimate goal is to construct models with which the properties of newly generated tissues that form during wound healing can be predicted with a high degree of certainty. The development of the presented model is considered by us as a step toward their construction.

Keywords: Biomechanics; Compressible neo-Hookean solid; Dermal wound healing; Fibroblasts; Flux-corrected transport (FCT) limiter; Hypertrophic scar tissue; Modeling; Moving boundary; Moving-grid finite-element method.


Conflict of interest statement

Compliance with ethical standards Funding This study was funded by a grant from the Dutch Burns Foundation (project number WO/12.103). Conflict of interest The authors declare that they have no conflict of interest.

Figures

Fig. 1
Fig. 1
A graphical representation of the domain of computation. a A hypothetical wound covering a portion of a shoulder. b A close-up of a piece of the dermal layer of the shoulder from a. c A close-up of the piece of dermal layer from b that is enclosed by the blue box (the scale along both axes is in centimeters). Depicted are the initial shape of the infinitely thin slice of dermal layer and, in color scale, the initial concentration of the collagen molecules, measured in g/cm3. Within c, the boundaries are numbered counterclockwise from B.I to B.IV. B.I coincides with the boundary between the subcutaneous layer and the dermal layer of the skin, B.II and B.IV border on adjacent dermal tissue, and B.III coincides with the boundary between the dermal layer and the epidermal layer (if present). Furthermore, the black plus sign located more or less at the center of the wound marks the material point within the dermal layer where the evolution of the individual modeled constituents was traced over time for the generation of the figures in Sect. 5
Fig. 2
Fig. 2
An overview of a simulation with a relatively high apoptosis rate of myofibroblasts (δM=6×10⁻²/day). The first two rows show the evolution over time of the cell density of, respectively, the fibroblast population and the myofibroblast population. The color scales represent the cell densities, measured in cells/cm3. The last two rows show the evolution over time of the concentration of, respectively, the signaling molecules and the collagen molecules. The color scales represent the concentrations, measured in g/cm3. Within the subfigures, the scale along both axes is in centimeters. All remaining parameter values are equal to those depicted in Table 1 in Appendix 1. With respect to the width of the wound, cII=4cm in this simulation
Fig. 3
Fig. 3
An overview of a simulation with a relatively low apoptosis rate of myofibroblasts (δM=2×10⁻³/day). The first two rows show the evolution over time of the cell density of, respectively, the fibroblast population and the myofibroblast population. The color scales represent the cell densities, measured in cells/cm3. The last two rows show the evolution over time of the concentration of, respectively, the signaling molecules and the collagen molecules. The color scales represent the concentrations, measured in g/cm3. Within the subfigures, the scale along both axes is in centimeters. All remaining parameter values are equal to those depicted in Table 1 in Appendix 1. With respect to the width of the wound, cII=4cm in this simulation
Fig. 4
Fig. 4
The evolution over time of the cell density of the fibroblast population for different values of the apoptosis rate of myofibroblasts and various widths of the wound. See Fig. 1c for the location where the evolution of the cell density was traced over time. The remaining parameter values are equal to those depicted in Table 1 in Appendix 1
Fig. 5
Fig. 5
The evolution over time of the cell density of the myofibroblast population for different values for the apoptosis rate of myofibroblasts and various widths of the wound. See Fig. 1c for the location where the evolution of the cell density was traced over time. The remaining parameter values are equal to those depicted in Table 1 in Appendix 1
Fig. 6
Fig. 6
The evolution over time of the concentration of the signaling molecules for different values for the apoptosis rate of myofibroblasts and various widths of the wound (the blue curve and the green curve are situated underneath the red curve). See Fig. 1c for the location where the evolution of the concentration was traced over time. The remaining parameter values are equal to those depicted in Table 1 in Appendix 1
Fig. 7
Fig. 7
The evolution over time of the concentration of the collagen molecules for different values for the apoptosis rate of myofibroblasts and various widths of the wound (the blue curve and the green curve are situated underneath the red curve). See Fig. 1c for the location where the evolution of the concentration was traced over time. The remaining parameter values are equal to those depicted in Table 1 in Appendix 1
Fig. 8
Fig. 8
The evolution over time of the strain energy density. The first row shows the evolution when the apoptosis rate of myofibroblasts is relatively high (δM=6×10⁻²/day). The second row shows the evolution when the apoptosis rate of myofibroblasts is relatively low (δM=2×10⁻³/day). With respect to the width of the wound, cII=4cm in both cases. The color scales represent the strain energy density, measured in J/cm3. Within the subfigures, the scale along both axes is in centimeters. The remaining parameter values are equal to those depicted in Table 1 in Appendix 1
Fig. 9
Fig. 9
The evolution over time of the thickness of the dermal layer for different values for the apoptosis rate of myofibroblasts and various widths of the wound. In the simulations, the thickness of the dermal layer was computed at y=0cm. The dark green error bars and the magenta error bars represent clinical measurements of the thickness of, respectively, hypertrophic scars and normal scars in human subjects at different time points after injury (Nedelec et al. 2014). Displayed are the means (with a cross sign) plus/minus one standard deviation. The remaining parameter values are equal to those depicted in Table 1 in Appendix 1

References

    1. Abe R, Donneley S, Peng T, Bucala R, Metz C. Peripheral blood fibrocytes: differentiation pathway and migration to wound sites. J Immunol. 2001;166:756–762. - PubMed
    1. Barbul A, Breslin R, Woodyard J, Wasserkrug H, Efron G. The effect of in vivo T helper and T suppressor lymphocyte depletion on wound healing. Ann Surg. 1989;209:479–483. doi: 10.1097/00000658-198904000-00015. - DOI - PMC - PubMed
    1. Barrientos S, Stojadinovic O, Golinko M, Brem H, Tomic-Canic M. Growth factors and cytokines in wound healing. Wound Repair Regen. 2008;16:585–601. doi: 10.1111/j.1524-475X.2008.00410.x. - DOI - PubMed
    1. Baum C, Arpey C. Normal cutaneous wound healing: clinical correlation with cellular and molecular events. Dermatol Surg. 2005;31:674–686. doi: 10.1097/00042728-200506000-00011. - DOI - PubMed
    1. Bischoff J, Arruda E, Grosh K. A rheological network model for the continuum anisotropic and viscoelastic behavior of soft tissue. Biomech Model Mechanbiol. 2004;3:56–65. doi: 10.1007/s10237-004-0049-4. - DOI - PubMed