. 2016 Aug;26(8):3508-26.
doi: 10.1093/cercor/bhw157. Epub 2016 May 26.

The Human Brainnetome Atlas: A New Brain Atlas Based on Connectional Architecture

Affiliations

The Human Brainnetome Atlas: A New Brain Atlas Based on Connectional Architecture

Lingzhong Fan et al. Cereb Cortex. 2016 Aug.

Abstract

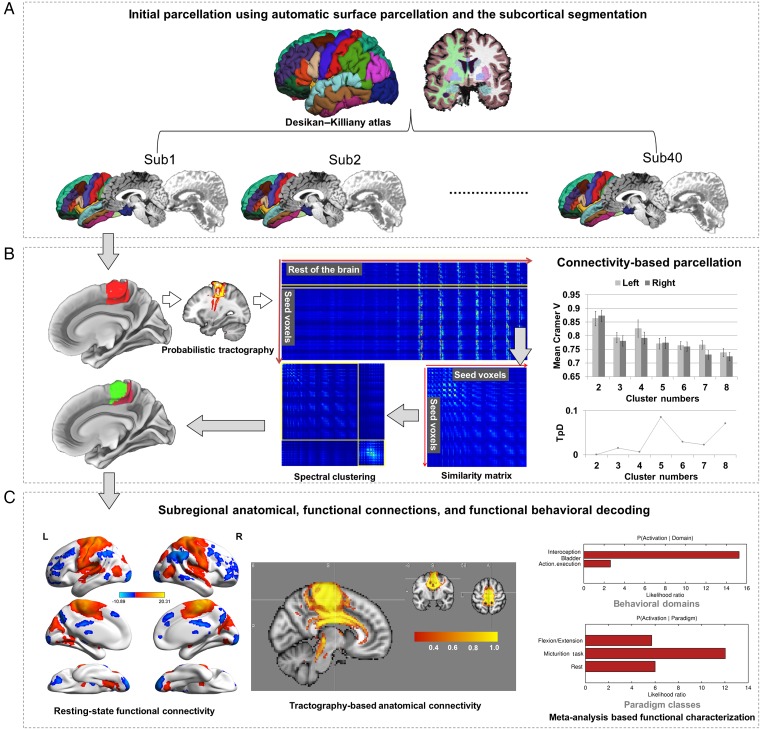
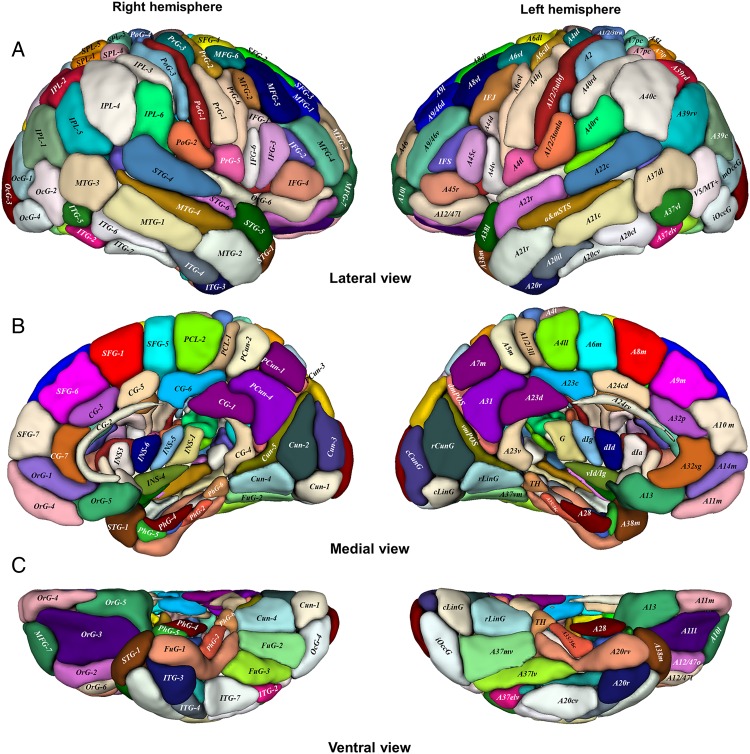
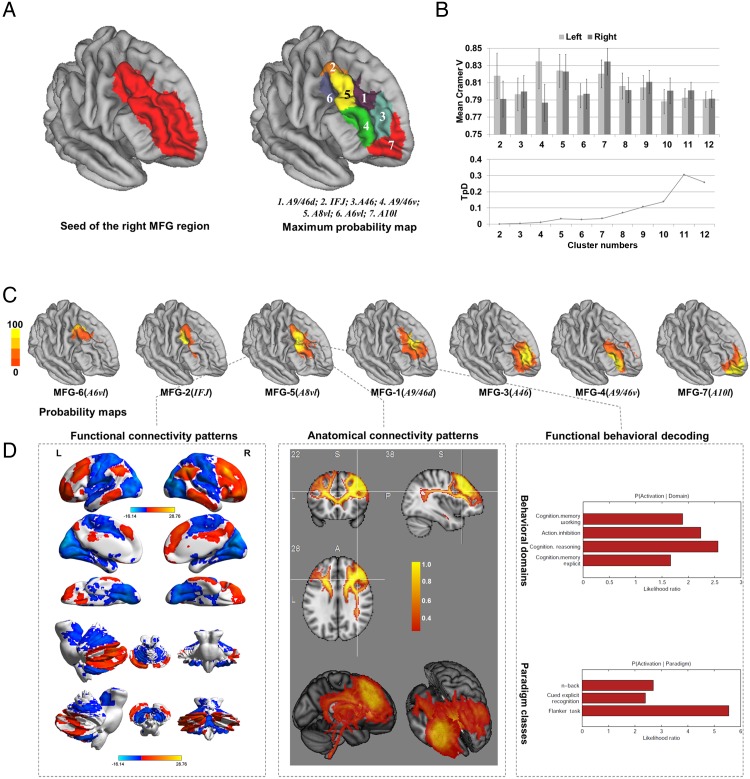
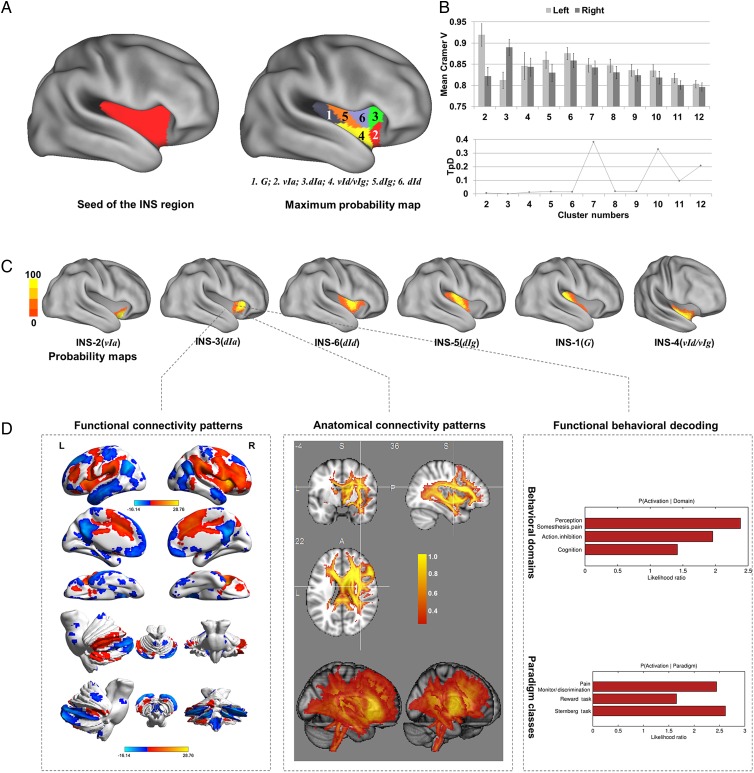
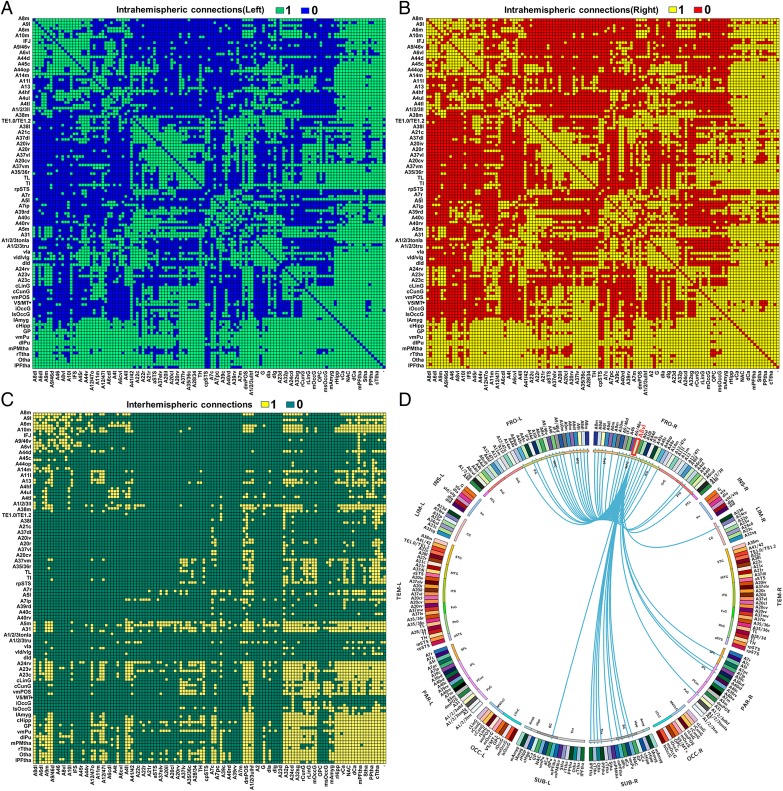
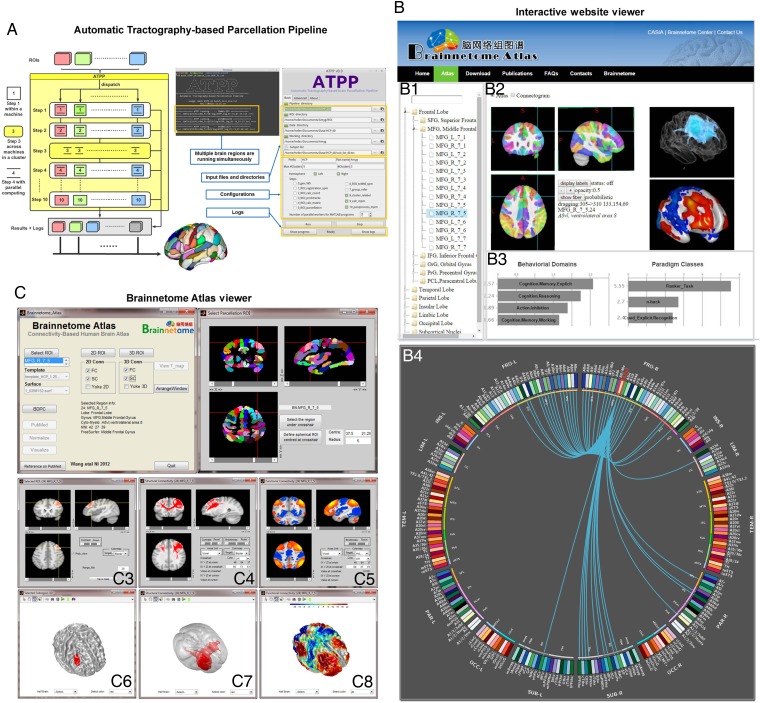
The human brain atlases that allow correlating brain anatomy with psychological and cognitive functions are in transition from ex vivo histology-based printed atlases to digital brain maps providing multimodal in vivo information. Many current human brain atlases cover only specific structures, lack fine-grained parcellations, and fail to provide functionally important connectivity information. Using noninvasive multimodal neuroimaging techniques, we designed a connectivity-based parcellation framework that identifies the subdivisions of the entire human brain, revealing the in vivo connectivity architecture. The resulting human Brainnetome Atlas, with 210 cortical and 36 subcortical subregions, provides a fine-grained, cross-validated atlas and contains information on both anatomical and functional connections. Additionally, we further mapped the delineated structures to mental processes by reference to the BrainMap database. It thus provides an objective and stable starting point from which to explore the complex relationships between structure, connectivity, and function, and eventually improves understanding of how the human brain works. The human Brainnetome Atlas will be made freely available for download at http://atlas.brainnetome.org, so that whole brain parcellations, connections, and functional data will be readily available for researchers to use in their investigations into healthy and pathological states.

Keywords: brain atlas; connectivity-based parcellation; diffusion tensor imaging; functional characterization; resting-state functional connectivity.


Figures

Figure 1.
Figure 1.
Framework of the Brainnetome Atlas construction based on connectivity-based parcellation. (A) Initial parcellation using automatic surface parcellation and subcortical segmentation. The FreeSurfer DK atlas produced the initial parcellations based on gyri and sulci. (B) Tractography-based parcellation with in vivo connectional architecture. Taking the parcellation of the human paracentral lobule by diffusion tensor imaging as an example, the paracentral lobule was first extracted from the DK atlas. The connectional architecture was then mapped with probabilistic tractography using diffusion MRI, after which, by calculating the similarity/dissimilarity between the connectivity architecture, the paracentral lobule was divided into subregions with distinguishing anatomical connectivity patterns. The stability across the population and the interhemispheric anatomic homology were evaluated to determine the final cluster number. (C) Subregional anatomical and functional connections and functional behavioral decoding. Diffusion MRI combined with tractography was used to reconstruct the major fiber bundles, while functional connectivity analysis of resting-state functional MRI was used to provide the in vivo large-scale connectivity in the human brain. We also mapped the functions to each paracentral lobule subregion via the behavioral domain and paradigm analysis using the BrainMap Database.
Figure 2.
Figure 2.
Parcellation scheme of the human brain in the Brainnetome Atlas. The MPM for each of the cortical subregions was created in standard MNI space ((A) lateral view, (B) medial view, (C) ventral view) and visualized using ITK-SNAP (www.itksnap.org). The atlas primarily combines ontological and nomenclature information from 2 sources, that is, anatomical and modified cytoarchitectonic descriptions. For convenience, these 2 types of descriptions are separately displayed in the left and right hemispheres. The details of the parcellation results for each subregion are listed in Table 1, and the online version is available at http://atlas.brainnetome.org/bnatlas.php. See also Supplementary Figures 1–5.
Figure 3.
Figure 3.
Brainnetome Atlas of the right middle frontal gyrus. (A) The right MFG ROI (on the left) and the MPM of the 7 subregions using a connectivity-based parcellation (on the right). We identified area 10l, area 46, dorsal and ventral divisions of area 9/46, area 6vl, area 8vl, and the IFJ subregion in the MFG. (B) The mean Cramer's V for each cluster number from 2 to 12. Cramer's V shows that 7 was the most stable solution for the right MFG. The TpD showed the similarity of the 7 solution for the topological arrangement between the 2 hemispheres. (C) The population probability maps for each MFG subregion. (D) Using the MFG-5, that is, A8vl, as an example: This figure shows the resting-state functional connectivity patterns (left), the tractographic signatures of the A8vl (middle), and the functional behavioral decoding (right).
Figure 4.
Figure 4.
Brainnetome Atlas of the right insular cortex. (A) The right INS ROI (on the left) and the MPM of the 6 subregions using connectivity-based parcellation (on the right). Six subregions were identified in the insular cortex, including areas G, vIa, dIa, vId/vIg, dIg, and dId. (B) Cramer's V indicated that 6 was a local peak compared with the nearby solutions for the right INS. The TpD showed the similarity of the 6 solution for the topological arrangement between the 2 hemispheres. (C) The population probability maps for each INS subregion. (D) Using the INS-3, that is, area dId, as an example, this figure shows the resting-state functional connectivity patterns (left), the tractographic signatures of the area dId (middle), and the functional behavioral decoding (right).
Figure 5.
Figure 5.
Connection matrices and connectogram of the Brainnetome Atlas. (A) The intrahemispheric connection matrix of the left hemisphere. (B) The intrahemispheric connection matrix of the right hemisphere. (C) The interhemispheric connection matrix across the 2 hemispheres. (D) Examples of the subregional connectograms for areas of the right MFG-5, that is, A8vl. The connectograms are represented using the Circos data visualization tool, with the left half depicting the left hemisphere and the right half depicting the right hemisphere. The hemispheres are divided into the frontal lobe, insular cortex, limbic lobe, temporal lobe, parietal lobe, occipital lobe, and subcortical structures.
Figure 6.
Figure 6.
Resources of the Brainnetome Atlas: pipeline, Brainnetome Atlas Viewer, and interactive website. (A) Automatic Tractography-based Parcellation Pipeline (ATPP): The GUI version is single-ROI oriented; thus, it is a user friendly method that can modify some parameters to parcellate a specific brain region. The command line version is multi-ROI oriented, which can be used to parcellate many brain regions simultaneously. (B) The Brainnetome Atlas interactive website: The website makes all the information in the Brainnetome Atlas available to researchers. It provides a hierarchical tree of brain structures in the left panel (B1). The right panel contains an atlas viewer (B2 and B3) that shows slice views together with a connectogram viewer (B4). (C) The Brainnetome Atlas Viewer (V1.0): The main window of the software contains push buttons, pull-down lists, and checkboxes for different function modules (C1), such as subregion selection, template/surface selection, and connectivity visualization. The entire Brainnetome Atlas contains 246 subregions and can be viewed as a maximum probabilistic map in a tri-planar view (C2). The subregion can be viewed as a 2D overlay on the selected structural template (C3) and a 3D patch can be rendered on the cortical surface (C6). Using the checkboxes, the structural and functional connectivities of the selected subregion can be viewed in both 2D tri-planar views (C4 and C5) and 3D renderings (C7 and C8) as probabilistic maps.

References

    1. Alexander-Bloch A, Giedd JN, Bullmore E. 2013. Imaging structural co-variance between human brain regions. Nat Rev Neurosci. 14:322–336. - PMC - PubMed
    1. Amunts K, Hawrylycz MJ, Van Essen DC, Van Horn JD, Harel N, Poline JB, De Martino F, Bjaalie JG, Dehaene-Lambertz G, Dehaene S et al. . 2014. Interoperable atlases of the human brain. Neuroimage. 99:525–532. - PubMed
    1. Amunts K, Lenzen M, Friederici AD, Schleicher A, Morosan P, Palomero-Gallagher N, Zilles K. 2010. Broca's region: novel organizational principles and multiple receptor mapping. PLoS Biol. 8:e1000489. - PMC - PubMed
    1. Amunts K, Zilles K. 2015. Architectonic mapping of the human brain beyond Brodmann. Neuron. 88:1086–1107. - PubMed
    1. Anwander A, Tittgemeyer M, von Cramon DY, Friederici AD, Knosche TR. 2007. Connectivity-based parcellation of Broca's area. Cereb Cortex. 17:816–825. - PubMed