. 2016 May 26:15:89.
doi: 10.1186/s12934-016-0485-8.

Production of para-aminobenzoic acid from different carbon-sources in engineered Saccharomyces cerevisiae

Affiliations

Production of para-aminobenzoic acid from different carbon-sources in engineered Saccharomyces cerevisiae

Nils J H Averesch et al. Microb Cell Fact. .

Abstract

Background: Biological production of the aromatic compound para-aminobenzoic acid (pABA) is of great interest to the chemical industry. Besides its application in pharmacy and as crosslinking agent for resins and dyes pABA is a potential precursor for the high-volume aromatic feedstocks terephthalic acid and para-phenylenediamine. The yeast Saccharomyces cerevisiae synthesises pABA in the shikimate pathway: Outgoing from the central shikimate pathway intermediate chorismate, pABA is formed in two enzyme-catalysed steps, encoded by the genes ABZ1 and ABZ2. In this study S. cerevisiae metabolism was genetically engineered for the overproduction of pABA. Using in silico metabolic modelling an observed impact of carbon-source on product yield was investigated and exploited to optimize production.

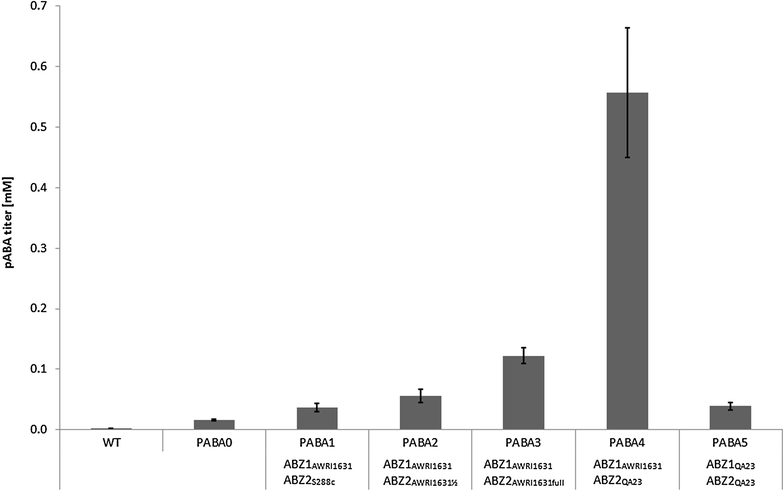
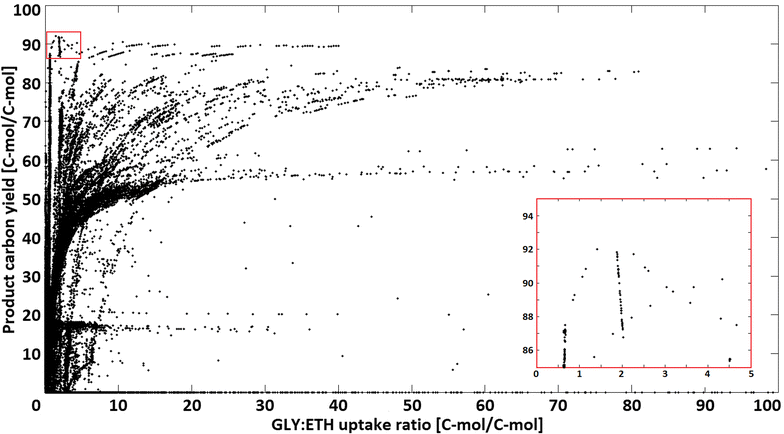
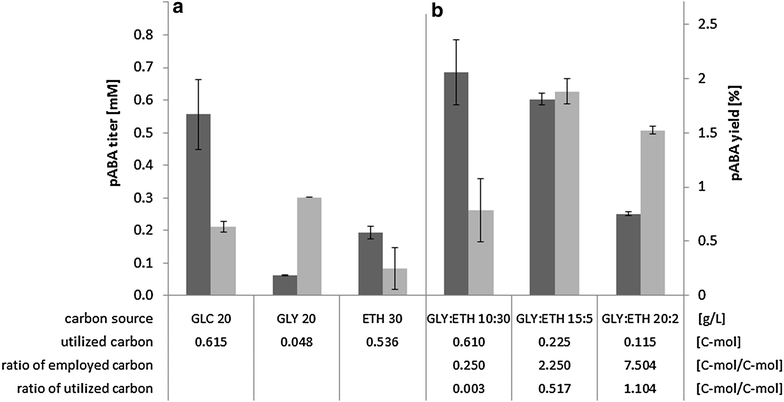
Results: A strain that incorporated the feedback resistant ARO4 (K229L) and deletions in the ARO7 and TRP3 genes, in order to channel flux to chorismate, was used to screen different ABZ1 and ABZ2 genes for pABA production. In glucose based shake-flaks fermentations the highest titer (600 µM) was reached when over-expressing the ABZ1 and ABZ2 genes from the wine yeast strains AWRI1631 and QA23, respectively. In silico metabolic modelling indicated a metabolic advantage for pABA production on glycerol and combined glycerol-ethanol carbon-sources. This was confirmed experimentally, the empirical ideal glycerol to ethanol uptake ratios of 1:2-2:1 correlated with the model. A (13)C tracer experiment determined that up to 32% of the produced pABA originated from glycerol. Finally, in fed-batch bioreactor experiments pABA titers of 1.57 mM (215 mg/L) and carbon yields of 2.64% could be achieved.

Conclusion: In this study a combination of genetic engineering and in silico modelling has proven to be a complete and advantageous approach to increase pABA production. Especially the enzymes that catalyse the last two steps towards product formation appeared to be crucial to direct flux to pABA. A stoichiometric model for carbon-utilization proved useful to design carbon-source composition, leading to increased pABA production. The reported pABA concentrations and yields are, to date, the highest in S. cerevisiae and the second highest in a microbial production system, underlining the great potential of yeast as a cell factory for renewable aromatic feedstocks.

Keywords: Aromatics; Ethanol; Glycerol; Phenylethanol; Yeast; pABA.


Figures
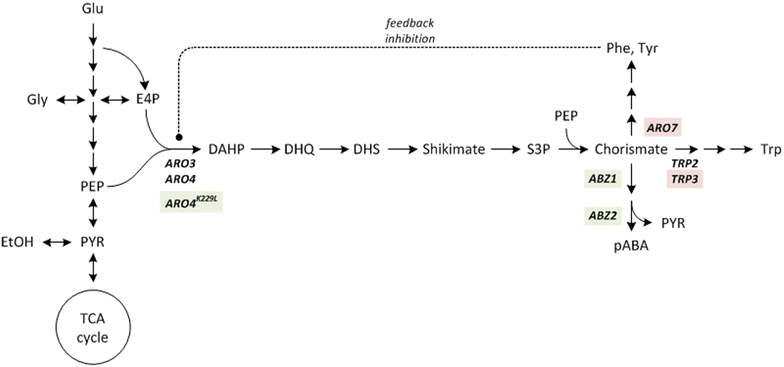
Fig. 1
Fig. 1
Simplified shikimate pathway including modifications for pABA production. Knock-out targets are highlighted red, (over)expression targets green. The central intermediates are: 3-deoxy-d-arabino-heptulosonate-7-phosphate (DAHP), 3-dehydroquinate (DHQ), 3-dehydroshikimate (DHS), shikimate, shikimate-3-phosphate (S3P), chorismate, phenylalanine (PHE), tyrosine (TYR), tryptophan (TRP) and para-aminobenzoate (pABA). Important genes and the respective enzymes involved are: ARO3/ARO4: 3-deoxy-d-arabino-heptulosonate-7-phosphate (DAHP) synthase, ARO7: chorismate mutase, TRP2: anthranilate synthase, TRP3: indole-3-glycerol-phosphate synthase, ABZ1: aminodeoxychorismate synthase, ABZ2: aminodeoxychorismate lyase
Fig. 2
Fig. 2
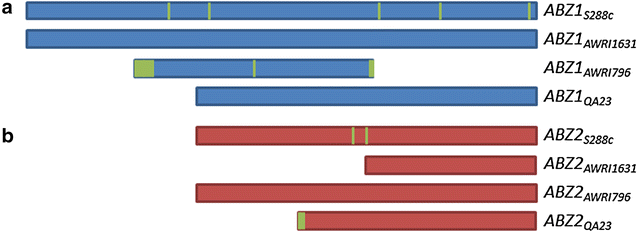
Simplified depiction of the alignment of ABZ1 (a) and ABZ2 (b) amino acid sequences. Amino acid residues unique to a certain sequence are indicated in green. Sequences are shown from N-terminus to C-terminus
Fig. 3
Fig. 3
Production of pABA in shake flask experiments of S. cerevisiae strains. WT = CEN.PK113-5D, PABA0 = CEN.PK113-5D Δtrp3 Δaro7 ARO4 K229L. PABA1–PABA5 are based on PABA0, with over-expression of additional ABZ1 and ABZ2 alleles on a plasmid expression vector as indicated on the figure (for full genotype cf. “Strain and plasmid construction” section)
Fig. 4
Fig. 4
Distribution of pABA yields in dependence of the glycerol to ethanol ratio in elementary flux modes in a window with a GLY:ETH ratio ≤100 [C-mol/C-mol]. Each point in the chart corresponds to the specific product carbon yields [%] and substrate ratio of the respective elementary flux mode. The insert at the bottom right corner is a magnification of the area in the top left corner where the modes with the highest yields are located
Fig. 5
Fig. 5
pABA titers (dark grey) and yields (light grey) achieved by PABA4 on different carbon-sources (a) and GLY:ETH different ratios (b). Titers are evaporation corrected and represent the maximum after either carbon-source was used up and/or no further product formation occurred. Utilized carbon is the amount of C-mol from either carbon-source that was taken up and actually metabolised. Yields and carbon usage ratios are based on the evaporation corrected titers while only respecting the actually metabolized fraction of the carbon-source
Fig. 6
Fig. 6
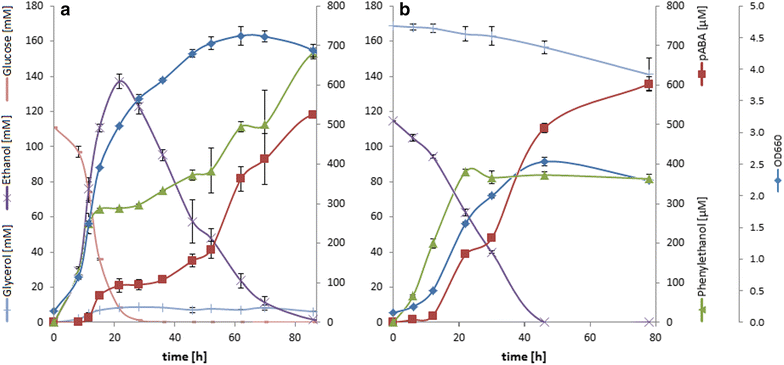
Time course of substrate consumption and product formation of biomass main aromatic products on GLC (a) and GLY/ETH (b). Titers are corrected for evaporation of H2O to reflect comparable metabolite concentrations. Carbon sources were 20 g/L glucose (initial 0.666 C-mol, of which 0.615 were consumed) in (a) and 15 g/L ethanol + 5 g/L glycerol (initial 0.722 C-mol, of which 0.225 were consumed) in (b). Biomass is reflected by means of the OD at 660 nm. Growth rates in the exponential phase were µ = 0.2242 h−1 on glucose and µ = 0.1081 h−1 on glycerol/ethanol
Fig. 7
Fig. 7
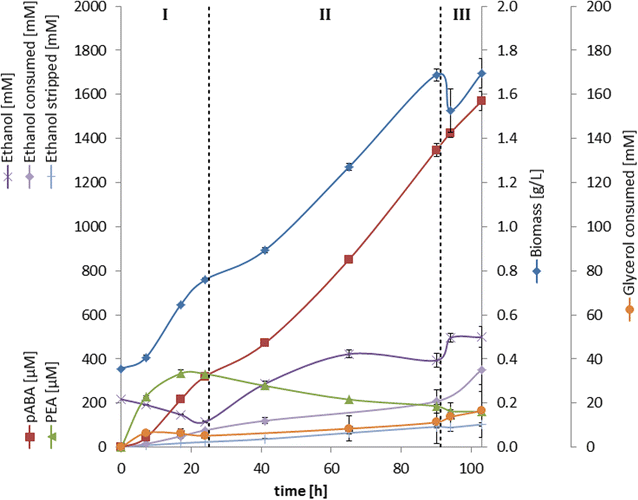
Substrate uptake and aromatic product formation over time in a bioreactor fermentation on GLY/ETH with continuous ETH-feed. Profiles of consumed substrates have been adjusted/corrected for dilution to reflect actual substrate uptake. Dashed vertical lines indicate activation/increase of the feed with CDM + ETH respectively: I = batch-phase, II = 6 mL/h, III = 21 mL/h

References

    1. Becker J, Wittmann C. Advanced biotechnology: metabolically engineered cells for the bio-based production of chemicals and fuels, materials, and health-care products. Angew Chem Int Ed Engl. 2015;54:3328–3350. doi: 10.1002/anie.201409033. - DOI - PubMed
    1. Chen Y, Nielsen J. Advances in metabolic pathway and strain engineering paving the way for sustainable production of chemical building blocks. Curr Opin Biotechnol. 2013;24:965–972. doi: 10.1016/j.copbio.2013.03.008. - DOI - PubMed
    1. Jang YS, Kim B, Shin JH, Choi YJ, Choi S, Song CW, Lee J, Park HG, Lee SY. Bio-based production of C2-C6 platform chemicals. Biotechnol Bioeng. 2012;109:2437–2459. doi: 10.1002/bit.24599. - DOI - PubMed
    1. Li M, Borodina I. Application of synthetic biology for production of chemicals in yeast Saccharomyces cerevisiae. FEMS Yeast Res. 2015;15(1):1–12. doi: 10.1093/femsyr/fou003. - DOI - PubMed
    1. Borodina I, Nielsen J. Advances in metabolic engineering of yeast Saccharomyces cerevisiae for production of chemicals. Biotechnol J. 2014;9:609–620. doi: 10.1002/biot.201300445. - DOI - PubMed

Publication types

MeSH terms