. 2016 Aug 15;76(16):4850-60.
doi: 10.1158/0008-5472.CAN-16-0058. Epub 2016 May 26.

Diverse, Biologically Relevant, and Targetable Gene Rearrangements in Triple-Negative Breast Cancer and Other Malignancies

Affiliations

Diverse, Biologically Relevant, and Targetable Gene Rearrangements in Triple-Negative Breast Cancer and Other Malignancies

Timothy M Shaver et al. Cancer Res. .

Abstract

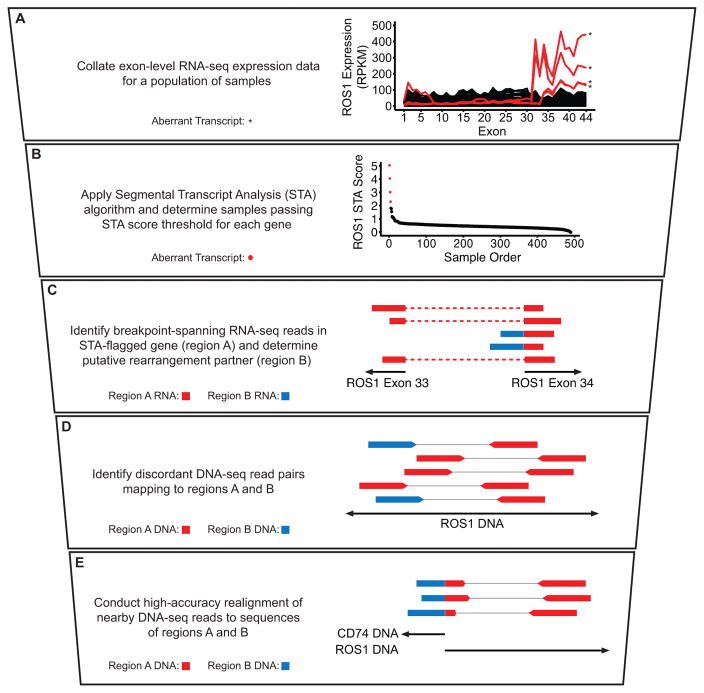
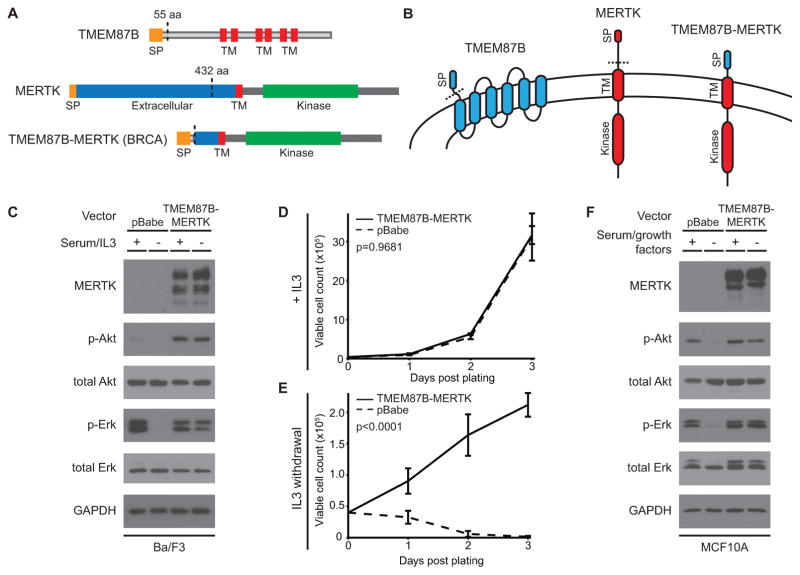
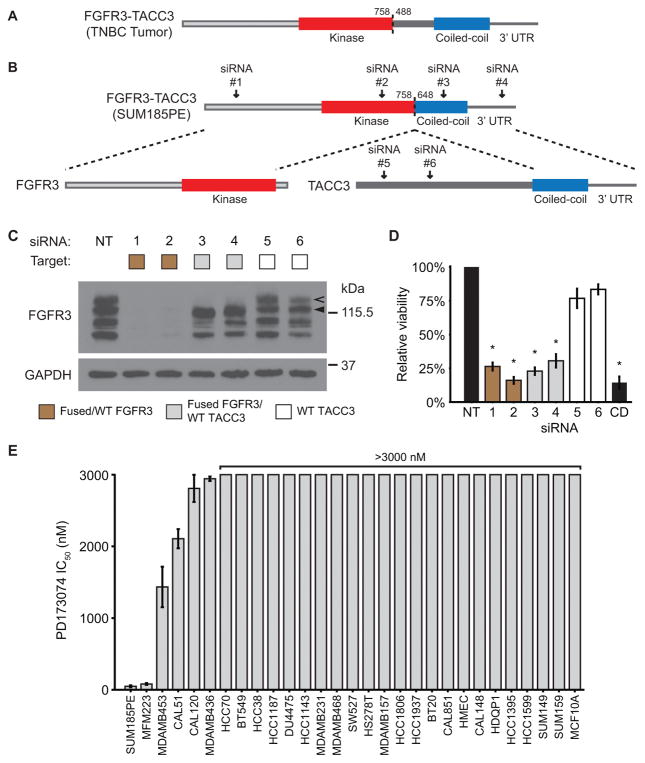
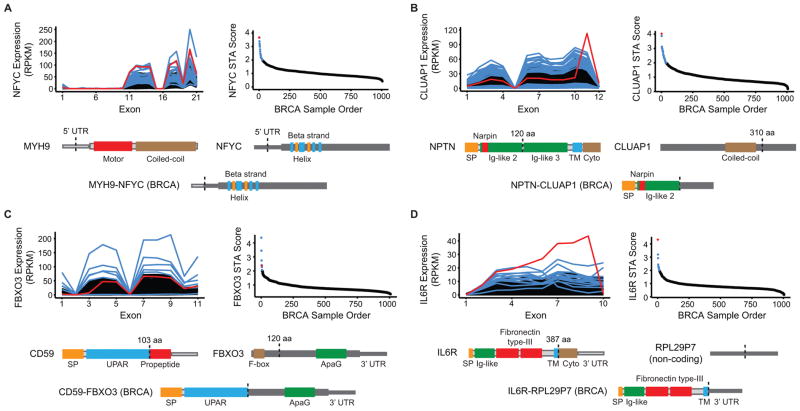
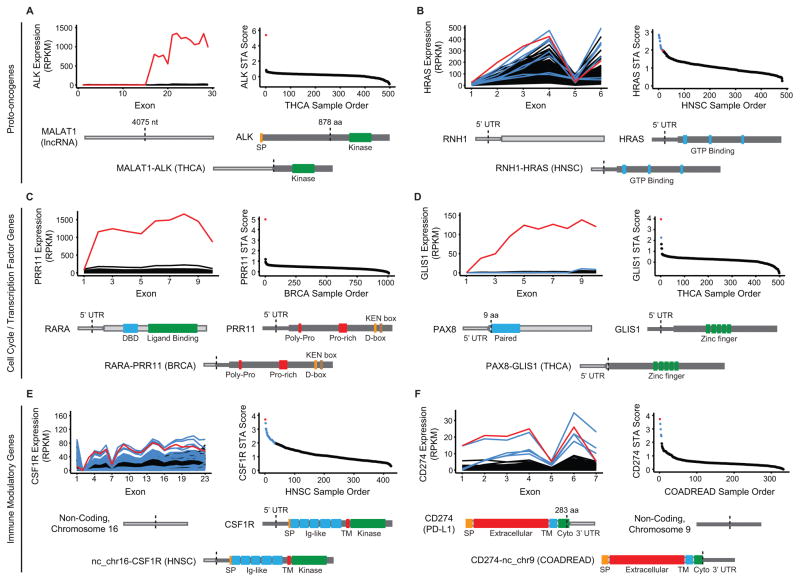
Triple-negative breast cancer (TNBC) and other molecularly heterogeneous malignancies present a significant clinical challenge due to a lack of high-frequency "driver" alterations amenable to therapeutic intervention. These cancers often exhibit genomic instability, resulting in chromosomal rearrangements that affect the structure and expression of protein-coding genes. However, identification of these rearrangements remains technically challenging. Using a newly developed approach that quantitatively predicts gene rearrangements in tumor-derived genetic material, we identified and characterized a novel oncogenic fusion involving the MER proto-oncogene tyrosine kinase (MERTK) and discovered a clinical occurrence and cell line model of the targetable FGFR3-TACC3 fusion in TNBC. Expanding our analysis to other malignancies, we identified a diverse array of novel and known hybrid transcripts, including rearrangements between noncoding regions and clinically relevant genes such as ALK, CSF1R, and CD274/PD-L1 The over 1,000 genetic alterations we identified highlight the importance of considering noncoding gene rearrangement partners, and the targetable gene fusions identified in TNBC demonstrate the need to advance gene fusion detection for molecularly heterogeneous cancers. Cancer Res; 76(16); 4850-60. ©2016 AACR.


Figures

Figure 1
Figure 1. Quantitative prediction by STA facilitates an integrated fusion detection pipeline
A–E, Stepwise description of STA discovery pipeline with accompanying schematics and example data. A, Exon-level expression values for a population of samples plotted as continuous lines. Samples passing STA score threshold (B) are plotted in red and denoted by asterisks; samples below the threshold are plotted in black. B, ROS1 STA scores for each sample plotted in descending order. Samples with an STA score of 2 or above are plotted in red; samples with an STA score below 2 are plotted in black. C, Schematic of RNA-seq reads. Dotted lines denote continuous read segments. D, Schematic of discordant whole-genome sequencing (WGS) read pairs. Thin lines represent denote read pairs. E, Schematic of breakpoint-spanning WGS reads identified after realignment. In C–E, colors indicate alignment location of individual read segments, as depicted in the description at left. Schematics are not to scale.
Figure 2
Figure 2. The TMEM87B-MERTK gene fusion in TNBC promotes constitutive oncogenic signaling and cell survival
A, Diagram of the TMEM87B and MERTK proteins and the DNA-validated gene fusion protein product. Protein features are labeled. B, Protein schematics indicating membrane topology (not to scale). Colors indicate protein sequences as indicated. In A and B, dotted lines represent protein regions encoded by the gene fusion transcript. C, Immunoblot analysis of the indicated proteins from Ba/F3 cells transfected with an empty vector or one expressing the TMEM87B-MERTK fusion gene. Cell lines were grown in the continuous presence of 5% FBS and 1 ng/mL IL3 (+) or switched to 0.5% FBS and no IL3 (−) for 90 min. D–E, Graphs depicting growth curves of Ba/F3 cells transfected with the TMEM87B-MERTK fusion gene (solid line) or empty vector (dotted line). Cells were grown in the continuous presence of 1 ng/mL IL3 (D) or switched to no-IL3 media at day 0 (E) and viable cell counts were obtained by hemocytometer with trypan blue exclusion at the indicated timepoints. Error bars represent standard deviation of three replicates and p-values comparing the two conditions are specified at top left. F, Immunoblot analysis of the indicated proteins from MCF10A cells transfected with constructs identical to C. Cells were grown in complete growth media with 2.5% horse serum (+) or switched to base media with 0.5% horse serum and no growth factor additives for 180 min (−). aa: amino acid; BRCA: breast invasive carcinoma; SP: signal peptide; TM: transmembrane.
Figure 3
Figure 3. The FGFR3-TACC3 gene fusion is a targetable driver alteration in TNBC
A–B, diagram of the protein products of the FGFR3-TACC3 gene fusions found in a tumor sample from TNBC patient TTR0001024(3) (A) and the SUM185PE TNBC cell line (B). Protein features are labeled and dotted lines outline protein regions encoded by the gene fusion transcript. Numbers indicate amino acid position in the wild-type proteins and arrows indicate targeting locations of the siRNAs used in the experiments. C–D, Immunoblot analysis of the indicated proteins from SUM185PE lysate (C) and relative viability of the cells (D) after 72-hr treatment with the indicated siRNAs (depicted in B), a non-targeting control (NT), or a cell death-inducing positive control (CD). In C, the legend indicates proteins expected to undergo knockdown based on siRNA target location. Wild-type (WT) and fused forms of FGFR3 are denoted by a filled and hollow arrow, respectively. In D, viability as assessed by alamarBlue is normalized to the non-targeting control. Error bars represent standard error of the mean of four independent experiments. Asterisks indicate p < 0.001 when compared to NT control. E, Half-maximal inhibitory concentrations (IC50) of the FGFR inhibitor PD173074 for the indicated cell lines as assessed by alamarBlue assay. Error bars represent standard error of the mean of three independent experiments.
Figure 4
Figure 4. Triple-negative breast cancers harbor a functionally diverse array of gene rearrangements
A–D, Four examples of STA-predicted rearrangements in triple-negative breast cancers from TCGA. Each panel features an exon-level expression diagram and STA score plot for the gene and cancer type analyzed. Red indicates the representative DNA-validated rearrangement that is depicted at the bottom of each panel as a schematic of the resulting aberrant protein. Blue indicates additional aberrant transcripts meeting STA score threshold. Black indicates background population below threshold. Protein features and untranslated regions (UTRs) are labeled and dotted lines indicate hybrid transcript junctions. aa: amino acid; BRCA: breast invasive carcinoma; Cyto: cytoplasmic domain; nt: nucleotide; SP: signal peptide; TM: transmembrane.
Figure 5
Figure 5. Overexpression of oncogenic transcripts across cancer types results from gene rearrangement with coding and non-coding DNA
A–F, Six examples of STA-predicted rearrangements from additional tumor types in TCGA, representing the categories described at left. Each panel features an exon-level expression diagram and STA score plot for the gene and cancer type analyzed. Red indicates the representative DNA-validated rearrangement that is depicted at the bottom of each panel as a schematic of the resulting aberrant protein. Blue indicates additional aberrant transcripts meeting STA score threshold. Black indicates background population below threshold. Protein features and untranslated regions (UTRs) are labeled and dotted lines indicate hybrid transcript junctions. aa: amino acid; BRCA: breast invasive carcinoma; COADREAD: colorectal carcinoma; Cyto: cytoplasmic domain; HNSC: head and neck squamous cell carcinoma; nt: nucleotide; SP: signal peptide; THCA: thyroid carcinoma; TM: transmembrane.

References

    1. Lehmann BD, Bauer JA, Chen X, Sanders ME, Chakravarthy AB, Shyr Y, et al. Identification of human triple-negative breast cancer subtypes and preclinical models for selection of targeted therapies. J Clin Invest. 2011;121(7):2750–67. - PMC - PubMed
    1. Masuda H, Baggerly KA, Wang Y, Zhang Y, Gonzalez-Angulo AM, Meric-Bernstam F, et al. Differential response to neoadjuvant chemotherapy among 7 triple-negative breast cancer molecular subtypes. Clin Cancer Res. 2013;19(19):5533–40. - PMC - PubMed
    1. Shah SP, Roth A, Goya R, Oloumi A, Ha G, Zhao Y, et al. The clonal and mutational evolution spectrum of primary triple-negative breast cancers. Nature. 2012;486(7403):395–9. - PMC - PubMed
    1. Cancer Genome Atlas N. Comprehensive molecular portraits of human breast tumours. Nature. 2012;490(7418):61–70. - PMC - PubMed
    1. Lehmann BD, Bauer JA, Schafer JM, Pendleton CS, Tang L, Johnson KC, et al. PIK3CA mutations in androgen receptor-positive triple negative breast cancer confer sensitivity to the combination of PI3K and androgen receptor inhibitors. Breast Cancer Res. 2014;16(4):406. - PMC - PubMed