

In Vivo T1 of Blood Measurements in Children with Sickle Cell Disease Improve Cerebral Blood Flow Quantification from Arterial Spin-Labeling MRI
- PMID: 27231223
- PMCID: PMC7984682
- DOI: 10.3174/ajnr.A4793
In Vivo T1 of Blood Measurements in Children with Sickle Cell Disease Improve Cerebral Blood Flow Quantification from Arterial Spin-Labeling MRI
Abstract
Background and purpose: Children with sickle cell disease have low hematocrit and elevated CBF, the latter of which can be assessed with arterial spin-labeling MR imaging. Quantitative CBF values are obtained by using an estimation of the longitudinal relaxation time of blood (T1blood). Because T1blood depends on hematocrit in healthy individuals, we investigated the importance of measuring T1blood in vivo with MR imaging versus calculating it from hematocrit or assuming an adult fixed value recommended by the literature, hypothesizing that measured T1blood would be the most suited for CBF quantification in children with sickle cell disease.
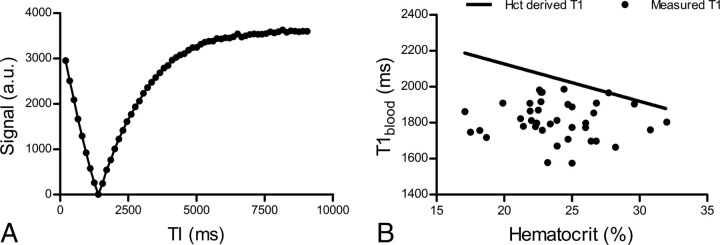
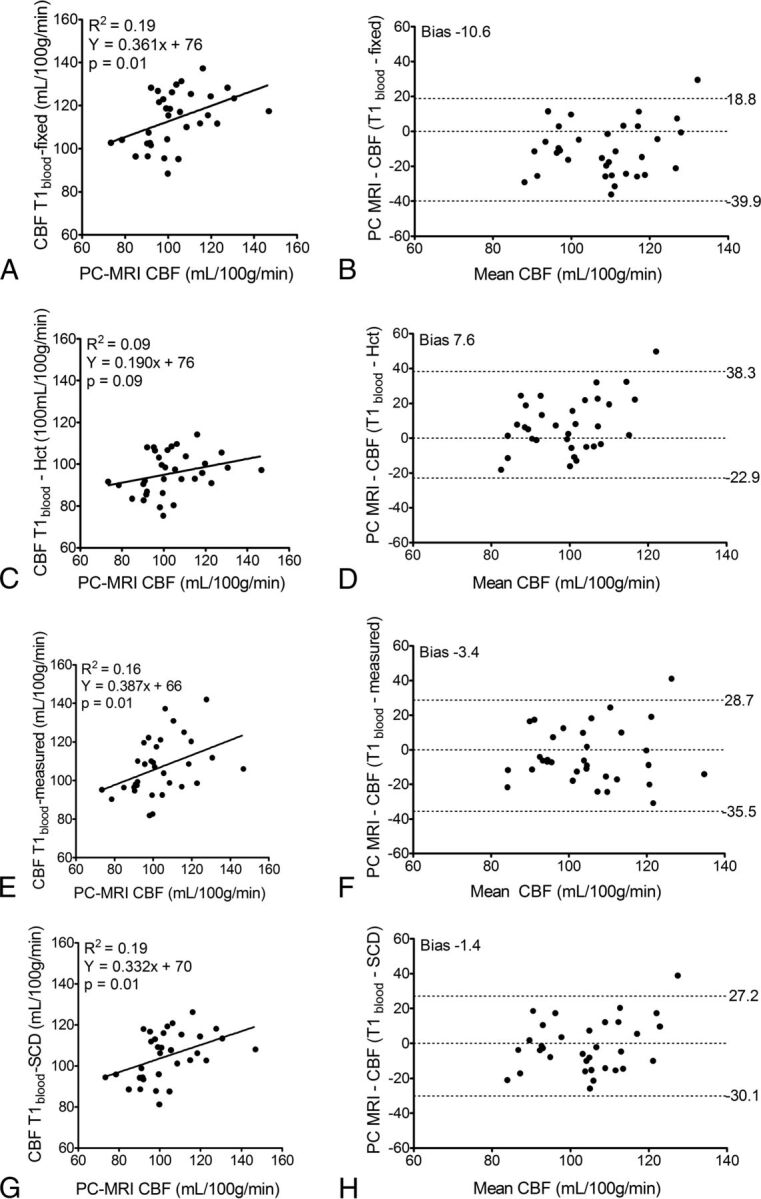
Materials and methods: Four approaches for T1blood estimation were investigated in 39 patients with sickle cell disease and subsequently used in the CBF quantification from arterial spin-labeling MR imaging. First, we used 1650 ms as recommended by the literature (T1blood-fixed); second, T1blood calculated from hematocrit measured in patients (T1blood-hematocrit); third, T1blood measured in vivo with a Look-Locker MR imaging sequence (T1blood-measured); and finally, a mean value from T1blood measured in this study in children with sickle cell disease (T1blood-sickle cell disease). Quantitative flow measurements acquired with phase-contrast MR imaging served as reference values for CBF.
Results: T1blood-measured (1818 ± 107 ms) was higher than the literature recommended value of 1650 ms, was significantly lower than T1blood-hematocrit (2058 ± 123 ms, P < .001), and, most interesting, did not correlate with hematocrit measurements. Use of either T1blood-measured or T1blood-sickle cell disease provided the best agreement on CBF between arterial-spin labeling and phase-contrast MR imaging reference values.
Conclusions: This work advocates the use of patient-specific measured T1blood or a standardized value (1818 ms) in the quantification of CBF from arterial spin-labeling in children with SCD.
© 2016 by American Journal of Neuroradiology.
Figures
References
MeSH terms
Substances
Grants and funding
LinkOut - more resources
Full Text Sources
Other Literature Sources
Medical