. 2016 Jul 22;291(30):15614-27.
doi: 10.1074/jbc.M116.738187. Epub 2016 May 26.

Modulation of Macrophage Inflammatory Nuclear Factor κB (NF-κB) Signaling by Intracellular Cryptococcus neoformans

Affiliations

Modulation of Macrophage Inflammatory Nuclear Factor κB (NF-κB) Signaling by Intracellular Cryptococcus neoformans

James B Hayes et al. J Biol Chem. .

Abstract

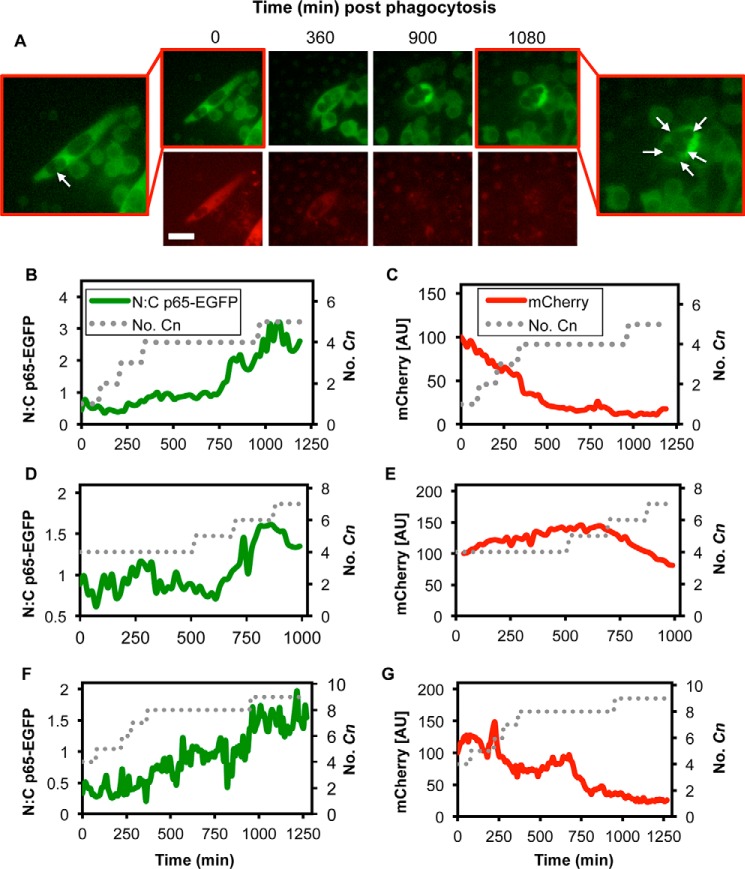
Cryptococcus neoformans (Cn) is a common facultative intracellular pathogen that can cause life-threatening fungal meningitis in immunocompromised individuals. Shortly after infection, Cn is detectable as both extra- and intracellular yeast particles, with Cn being capable of establishing long-lasting latent infections within host macrophages. Although recent studies have shown that shed capsular polysaccharides and intact extracellular Cn can compromise macrophage function through modulation of NF-κB signaling, it is currently unclear whether intracellular Cn also affects NF-κB signaling. Utilizing live cell imaging and computational modeling, we find that extra- and intracellular Cn support distinct modes of NF-κB signaling in cultured murine macrophages. Specifically, in RAW 264.7 murine macrophages treated with extracellular glucuronoxylomannan (GXM), the major Cn capsular polysaccharide, LPS-induced nuclear translocation of p65 is inhibited, whereas in cells with intracellular Cn, LPS-induced nuclear translocation of p65 is both amplified and sustained. Mathematical simulations and quantification of nascent protein expression indicate that this is a possible consequence of Cn-induced "translational interference," impeding IκBα resynthesis. We also show that long term Cn infection induces stable nuclear localization of p65 and IκBα proteins in the absence of additional pro-inflammatory stimuli. In this case, nuclear localization of p65 is not accompanied by TNFα or inducible NOS (iNOS) expression. These results demonstrate that capsular polysaccharides and intact intracellular yeast manipulate NF-κB via multiple distinct mechanisms and provide new insights into how Cn might modulate cellular signaling at different stages of an infection.

Keywords: Cryptococcus neoformans; NF-kappa B (NF-KB); computational biology; host-pathogen interaction; inflammation; intracellular pathogen; macrophage.


Figures

FIGURE 1.
FIGURE 1.
Exposure to GXM inhibits LPS-induced nuclear accumulation of p65. A, fluorescence microscopy images of p65-EGFP (green) localization in RAW 264.7 NF-κB reporter cells exposed to 100 ng/ml LPS with and without a 1-h pretreatment with 200 μg/ml GXM. The scale bar represents 20 μm. B–D, single cell trajectories of the nuc:cyto ratio of p65-EGFP fluorescence after LPS stimulation without (B) and with (C) GXM pretreatment for four representative cells and (D) the population average for GXM, LPS, and GXM + LPS cells. E, quantification of the average maximum amplitude, time to achieve maximum amplitude, and response duration. Error is represented as the S.E. Statistical significance is indicated as follows: *, p < 0.05; **, p < 0.01; and ***, p < 0.001. The data from >100 cells were collected per condition across three independent biological repeats. F, a diagram linking model parameters to biological events. G, P19, the parameter describing the magnitude of MyD88-dependent IKK activity, was decreased to 0.75 and 0.50 of the nominal value, and the model was simulated in MATLAB as described under “Numerical Experiments.” The predicted ratio in the concentration of nuclear to cytoplasmic p65 was plotted as a function of time after LPS stimulation.
FIGURE 2.
FIGURE 2.
Effect of macrophage-activating stimuli and Cn opsonins on p65-EGFP localization in RAW 264.7 cells. A, RAW 264.7 NF-κB reporter cells were treated as indicated and imaged by live cell microscopy for periods of up to 5 h. Conditions that induced p65-EGFP nuclear localization (nuc:cyto p65-EGFP ≥ 1) in cells were classified as “activating.” Conditions that caused no apparent accumulation of p65-EGFP were classified as “not activating.” B, schematic of the Cn-macrophage infection protocol. Timeline for the preparation of Cn-infected RAW 264.7 NF-κB reporter cells for live cell imaging.
FIGURE 3.
FIGURE 3.
Macrophages containing intracellular Cn exhibit a delayed and sustained NF-κB response to LPS stimulation. A, fluorescence microscopy images of p65-EGFP (green) localization in RAW 264.7 NF-κB reporter cells exposed to 100 ng/ml LPS 2 h after infection with Cn. The scale bar represents 20 μm. Intracellular Cn are indicated with arrows. B, single cell trajectories of the nuc:cyto ratio of p65-EGFP fluorescence after LPS stimulation for cells that do not (Ctrl) and do contain >3 intracellular H99S Cn (3+ H99S) for four representative cells. C–E, the population average trajectory of the nuc:cyto ratio of p65-EGFP fluorescence after LPS stimulation for cells that do not (Ctrl) and do contain intracellular Cn with quantification of the average maximum amplitude, time to achieve maximum amplitude, and response duration for H99S (C), 24067 (D), and Cap59 (E)-infected macrophages. Error is represented as the S.E. Statistical significance is indicated as follows: *, p < 0.05; **, p < 0.01; and ***, p < 0.001 (ANOVA, p < 0.05). Data from >35 cells were collected per condition across a minimum of six independent biological repeats.
FIGURE 4.
FIGURE 4.
Numerical experiments using the model of Sung et al. (24) to evaluate potential mechanisms through which intracellular Cn modulates NF-κB signaling. A, diagram linking model parameters to biological events. B–E, select model parameters were varied about a nominal value as indicate in the figure legends and the model was simulated in MATLAB as described under “Numerical Experiments.” The predicted ratio in the concentration of nuclear to cytoplasmic p65 was plotted as a function of time after LPS stimulation.
FIGURE 5.
FIGURE 5.
Live GXM-positive Cn causes translational interference in RAW 264.7 macrophages. A, quantification of the nuclear:cytoplasmic ratio of p65-EGFP fluorescence in LPS-treated live RAW 264.7 NF-κB-reporter cells pretreated with vehicle (Ctrl) or the indicated doses of CHX. Data from >40 cells were collected per condition across a minimum of two independent biological repeats. B, fluorescence microscopy images of RAW 264.7 cells treated with 100 μm CHX or infected with live or heat-killed H99S Cn. Nascent protein synthesis was detected by staining with OPP-647 (red in merge) and genomic DNA was stained using NuclearMask Blue (blue in merge). Arrows indicate Cn-infected macrophages. C, quantification of OPP-647 staining in non-infected RAW 264.7 cells (No Cn) and cells infected with live (Live; also separated in to low (1–2 Cn; LB) and high burden (3+ Cn; HB) infected cells) or heat-killed (HK) H99S Cn. D, quantification of ribopuromycylation (RPM) staining of H99S-infected RAW264.7 cells. E, OPP-647 staining was quantified as described in B and C for Cap59 infected RAW 264.7 cells. Error is represented as the S.E. Statistical significance is indicated as follows: *, p < 0.05; **, p < 0.01; and ***, p < 0.001 (ANOVA, p < 0.05). Data from >40 cells were collected per condition across a minimum of three independent biological repeats. The scale bar represents 20 μm.
FIGURE 6.
FIGURE 6.
High intracellular Cn burden stimulates nuclear accumulation of p65 without gene expression. A, fluorescence microscopy images of p65-EGFP (green) localization and destabilized mCherry (red) expression in RAW 264.7 NF-κB reporter cells after phagocytosis of opsonized H99S Cn. The scale bar represents 20 μm. Intracellular Cn are indicated with arrows. B and C, quantification of the nuc:cyto ratio of p65-EGFP fluorescence (B) and mCherry fluorescence (C) for the cell depicted in A. The approximate number of intracellular Cn is represented by the dotted line. D–G, representative single cell trajectories of the nuc:cyto ratio of p65-EGFP fluorescence and mCherry fluorescence for three representative cells.
FIGURE 7.
FIGURE 7.
High intracellular Cn burden alters the NF-κB response to LPS. A, fluorescence microscopy images of p65-EGFP (green) localization and destabilized mCherry (red) expression in RAW 264.7 NF-κB reporter cells. Cells with Cn (H99S)-induced nuclear p65-EGFP and control cells were imaged for 2 h prior to treatment with 100 ng/ml LPS (T = 0 min). Intracellular Cn are indicated with arrows. B, single cell trajectories of the nuc:cyto ratio of p65-EGFP fluorescence before and after LPS stimulation for representative cells with (Cn +ve) and without (Cn −ve) intracellular Cn as indicated in A. C and D, change in total p65-EGFP (C) and mCherry fluorescence (D) after LPS stimulation for cells exhibiting Cn-induced nuclear p65 (Cn +ve) and control cells that do not contain Cn (Cn −ve). Error is represented as the S.E. Statistical significance is indicated as follows: *, p < 0.05; **, p < 0.01; and ***, p < 0.001. Data from >8 Cn-infected cells (containing an average of 4.5 ± 2.8 Cn) were collected across five independent biological repeats. E, RAW 264.7 NF-κB reporter cells were fixed at the indicated times after stimulation with 100 ng/ml LPS or after infection with H99S and stained with Hoechst 33342 (blue) and immunostained with anti-iNOS antibodies (red). Fluorescence from p65-EGFP is represented in green. The large white circle demarcates a representative Cn-infected macrophage, and the smaller white circle indicates the nucleus of this cell. This result was consistent across all Cn-infected cells (12 cells) from four independent biological repeats. These cells contained an average of 4.3 ± 1.6 Cn. The scale bars represent 20 μm.
FIGURE 8.
FIGURE 8.
Numerical experiments using the model of Sung et al. (24) to evaluate potential mechanisms through which intracellular Cn can induce stable nuclear localization of p65. A–C, select model parameters were varied about a nominal value as indicate in the figure legends, and the model was simulated in MATLAB as described under “Numerical Experiments.” The predicted ratio in the concentration of nuclear to cytoplasmic p65 was plotted as a function of time in the absence of LPS stimulation. D, RAW 264.7 NF-κB reporter cells were fixed 24 h after infection with H99S and stained with Hoechst 33342 (blue) and immunostained with anti-IκBα antibodies (red). Fluorescence from p65-EGFP is represented in green. The arrow indicates the nucleus of a representative Cn-infected macrophage. This result was consistent across all Cn-infected cells (11 cells) from six independent biological repeats. These cells contained an average of 6.0 ± 2.2 Cn. The scale bars represent 20 μm.

References

    1. Lin X., and Heitman J. (2006) The biology of the Cryptococcus neoformans species complex. Annu. Rev. Microbiol. 60, 69–105 - PubMed
    1. Goldman D. L., Khine H., Abadi J., Lindenberg D. J., Pirofski L., Niang R., and Casadevall A. (2001) Serologic evidence for Cryptococcus neoformans infection in early childhood. Pediatrics 107, E66. - PubMed
    1. Park B. J., Wannemuehler K. A., Marston B. J., Govender N., Pappas P. G., and Chiller T. M. (2009) Estimation of the current global burden of cryptococcal meningitis among persons living with HIV/AIDS. AIDS 23, 525–530 - PubMed
    1. Cherniak R., and Sundstrom J. B. (1994) Polysaccharide antigens of the capsule of Cryptococcus neoformans. Infect. Immun. 62, 1507–1512 - PMC - PubMed
    1. Chang Y. C., and Kwon-Chung K. J. (1994) Complementation of a capsule-deficient mutation of Cryptococcus neoformans restores its virulence. Mol. Cell. Biol. 14, 4912–4919 - PMC - PubMed

MeSH terms

LinkOut - more resources