

Peroxisome Proliferator-activated Receptor γ Coactivator-1 α Isoforms Selectively Regulate Multiple Splicing Events on Target Genes
- PMID: 27231350
- PMCID: PMC4946932
- DOI: 10.1074/jbc.M115.705822
Peroxisome Proliferator-activated Receptor γ Coactivator-1 α Isoforms Selectively Regulate Multiple Splicing Events on Target Genes
Abstract
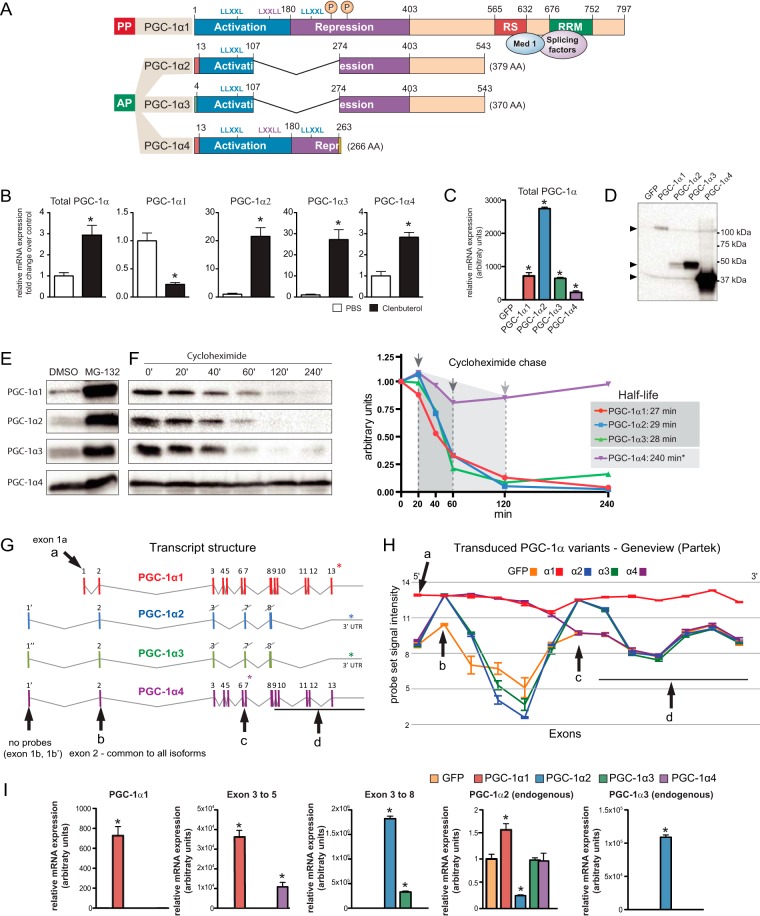
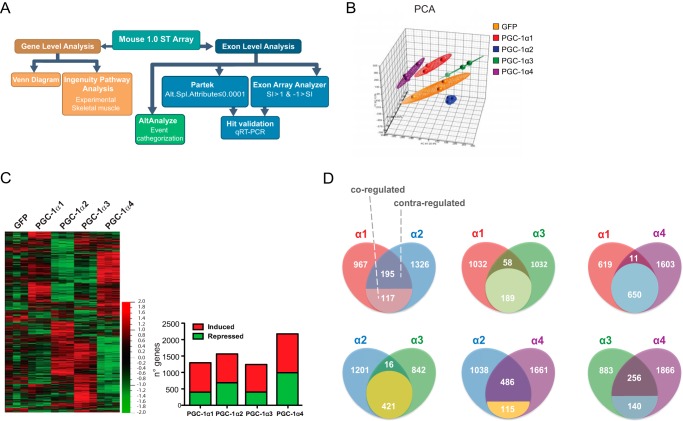
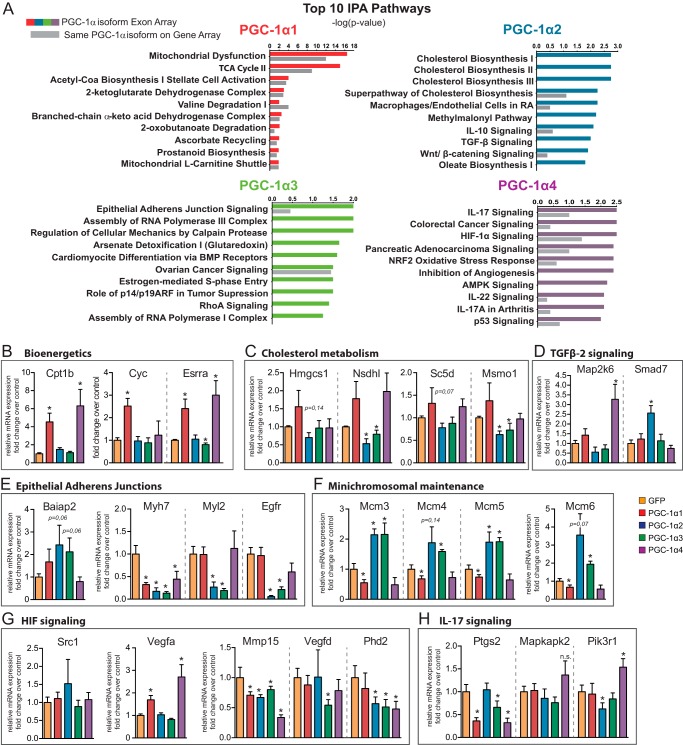
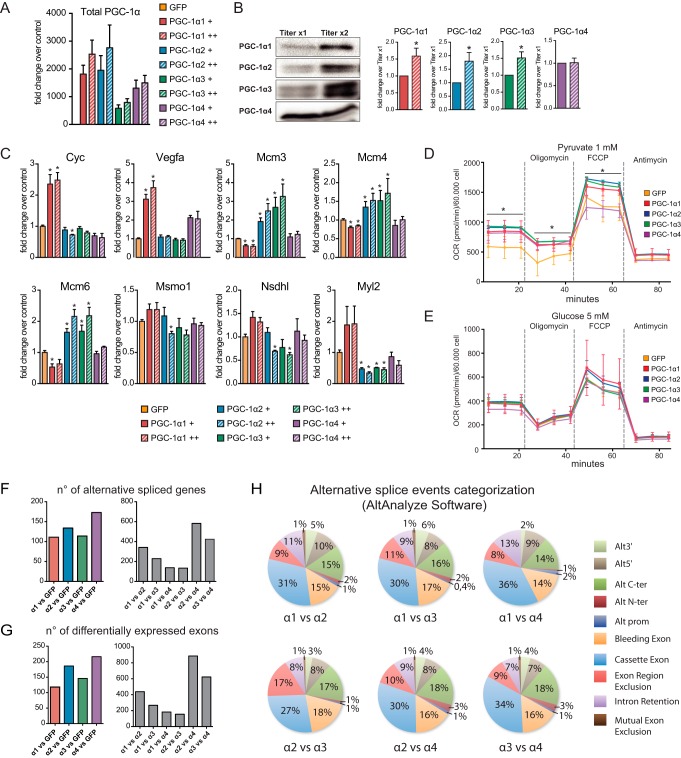
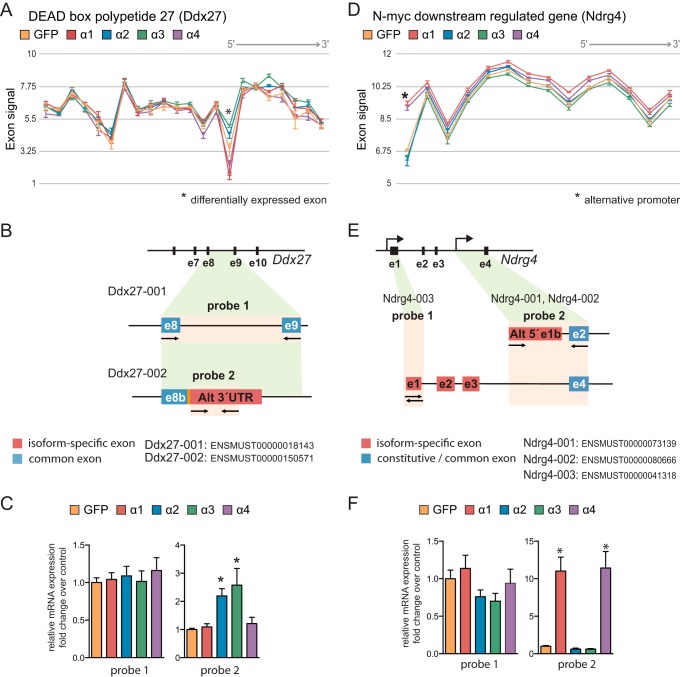
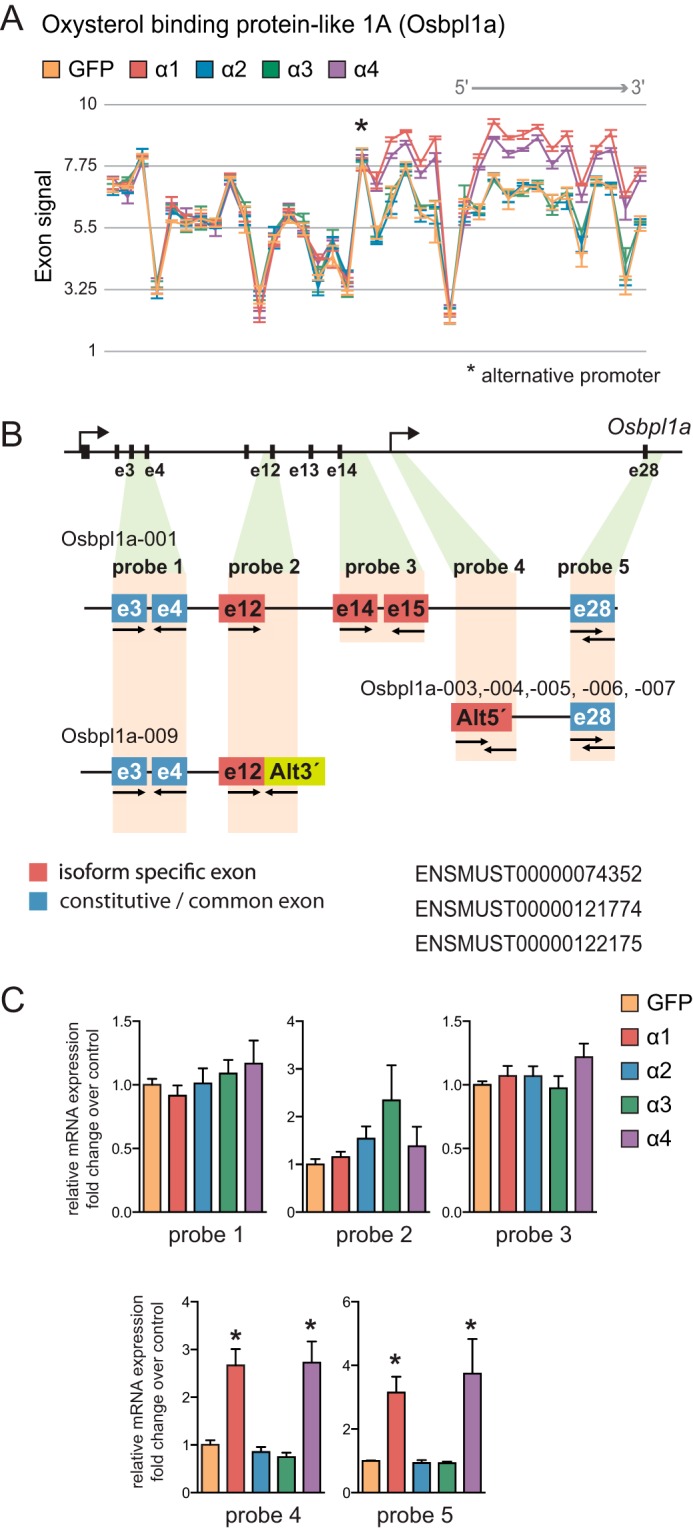
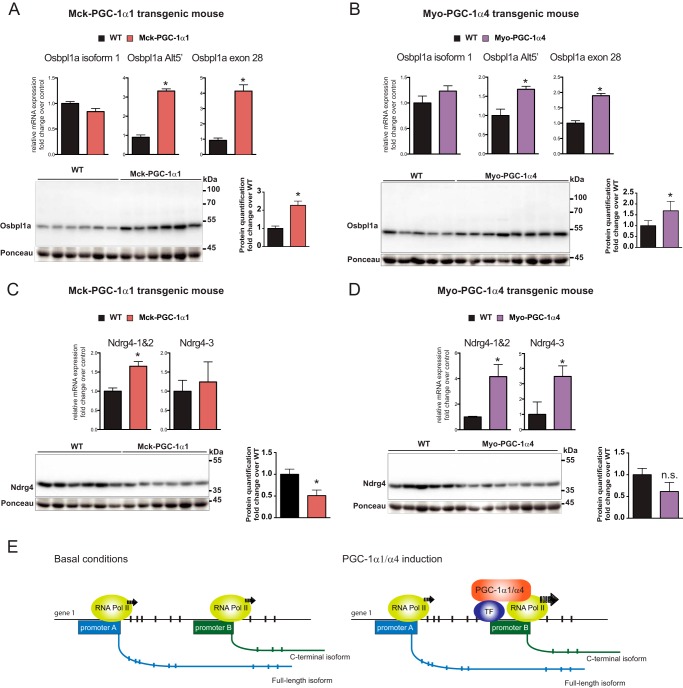
Endurance and resistance exercise training induces specific and profound changes in the skeletal muscle transcriptome. Peroxisome proliferator-activated receptor γ coactivator-1 α (PGC-1α) coactivators are not only among the genes differentially induced by distinct training methods, but they also participate in the ensuing signaling cascades that allow skeletal muscle to adapt to each type of exercise. Although endurance training preferentially induces PGC-1α1 expression, resistance exercise activates the expression of PGC-1α2, -α3, and -α4. These three alternative PGC-1α isoforms lack the arginine/serine-rich (RS) and RNA recognition motifs characteristic of PGC-1α1. Discrete functions for PGC-1α1 and -α4 have been described, but the biological role of PGC-1α2 and -α3 remains elusive. Here we show that different PGC-1α variants can affect target gene splicing through diverse mechanisms, including alternative promoter usage. By analyzing the exon structure of the target transcripts for each PGC-1α isoform, we were able to identify a large number of previously unknown PGC-1α2 and -α3 target genes and pathways in skeletal muscle. In particular, PGC-1α2 seems to mediate a decrease in the levels of cholesterol synthesis genes. Our results suggest that the conservation of the N-terminal activation and repression domains (and not the RS/RNA recognition motif) is what determines the gene programs and splicing options modulated by each PGC-1α isoform. By using skeletal muscle-specific transgenic mice for PGC-1α1 and -α4, we could validate, in vivo, splicing events observed in in vitro studies. These results show that alternative PGC-1α variants can affect target gene expression both quantitatively and qualitatively and identify novel biological pathways under the control of this system of coactivators.
Keywords: PGC-1α2; PGC-1α3; PGC-1α4; alternative splicing; exercise; exon array; gene regulation; peroxisome proliferator-activated receptor γ coactivator 1-α (PGC-1α) (PPARGC1A); skeletal muscle.
© 2016 by The American Society for Biochemistry and Molecular Biology, Inc.
Figures
Similar articles
-
The hitchhiker's guide to PGC-1α isoform structure and biological functions.Diabetologia. 2015 Sep;58(9):1969-77. doi: 10.1007/s00125-015-3671-z. Epub 2015 Jun 25. Diabetologia. 2015. PMID: 26109214 Review.
-
Sustained PGC-1α2 or PGC-1α3 expression induces astrocyte dysfunction and degeneration.Eur J Cell Biol. 2024 Mar;103(1):151377. doi: 10.1016/j.ejcb.2023.151377. Epub 2023 Nov 19. Eur J Cell Biol. 2024. PMID: 38006841
-
A PGC-1α isoform induced by resistance training regulates skeletal muscle hypertrophy.Cell. 2012 Dec 7;151(6):1319-31. doi: 10.1016/j.cell.2012.10.050. Cell. 2012. PMID: 23217713 Free PMC article.
-
Isoform-specific increases in murine skeletal muscle peroxisome proliferator-activated receptor-gamma coactivator-1alpha (PGC-1alpha) mRNA in response to beta2-adrenergic receptor activation and exercise.Endocrinology. 2008 Sep;149(9):4527-33. doi: 10.1210/en.2008-0466. Epub 2008 May 29. Endocrinology. 2008. PMID: 18511502
-
Adaptation of Skeletal Muscles to Contractile Activity of Varying Duration and Intensity: The Role of PGC-1α.Biochemistry (Mosc). 2018 Jun;83(6):613-628. doi: 10.1134/S0006297918060019. Biochemistry (Mosc). 2018. PMID: 30195320 Review.
Cited by
-
Co-expression networks reveal the tissue-specific regulation of transcription and splicing.Genome Res. 2017 Nov;27(11):1843-1858. doi: 10.1101/gr.216721.116. Epub 2017 Oct 11. Genome Res. 2017. PMID: 29021288 Free PMC article.
-
Full-length transcriptomic analysis in murine and human heart reveals diversity of PGC-1α promoters and isoforms regulated distinctly in myocardial ischemia and obesity.BMC Biol. 2022 Jul 30;20(1):169. doi: 10.1186/s12915-022-01360-w. BMC Biol. 2022. PMID: 35907957 Free PMC article.
-
Diversification of the muscle proteome through alternative splicing.Skelet Muscle. 2018 Mar 6;8(1):8. doi: 10.1186/s13395-018-0152-3. Skelet Muscle. 2018. PMID: 29510724 Free PMC article. Review.
-
Mitochondria Initiate and Regulate Sarcopenia.Exerc Sport Sci Rev. 2017 Apr;45(2):58-69. doi: 10.1249/JES.0000000000000101. Exerc Sport Sci Rev. 2017. PMID: 28098577 Free PMC article. Review.
-
The PGC-1/ERR network and its role in precision oncology.NPJ Precis Oncol. 2019 Mar 21;3:9. doi: 10.1038/s41698-019-0081-6. eCollection 2019. NPJ Precis Oncol. 2019. PMID: 30911677 Free PMC article. Review.
References
-
- Correia J. C., Ferreira D. M., and Ruas J. L. (2015) Intercellular: local and systemic actions of skeletal muscle PGC-1s. Trends Endocrinol. Metab. 26, 305–314 - PubMed
-
- Zhang Y., Huypens P., Adamson A. W., Chang J. S., Henagan T. M., Boudreau A., Lenard N. R., Burk D., Klein J., Perwitz N., Shin J., Fasshauer M., Kralli A., and Gettys T. W. (2009) Alternative mRNA splicing produces a novel biologically active short isoform of PGC-1α. J. Biol. Chem. 284, 32813–32826 - PMC - PubMed
-
- Ruas J. L., White J. P., Rao R. R., Kleiner S., Brannan K. T., Harrison B. C., Greene N. P., Wu J., Estall J. L., Irving B. A., Lanza I. R., Rasbach K. A., Okutsu M., Nair K. S., Yan Z., Leinwand L. A., and Spiegelman B. M. (2012) A PGC-1α isoform induced by resistance training regulates skeletal muscle hypertrophy. Cell 151, 1319–1331 - PMC - PubMed
-
- Martínez-Redondo V., Pettersson A. T., and Ruas J. L. (2015) The hitchhiker's guide to PGC-1α isoform structure and biological functions. Diabetologia 58, 1969–1977 - PubMed
Publication types
MeSH terms
Substances
Grants and funding
LinkOut - more resources
Full Text Sources
Other Literature Sources
Molecular Biology Databases
