

Range and niche shifts in response to past climate change in the desert horned lizard (Phrynosoma platyrhinos)
- PMID: 27231410
- PMCID: PMC4876873
- DOI: 10.1111/ecog.01464
Range and niche shifts in response to past climate change in the desert horned lizard (Phrynosoma platyrhinos)
Abstract
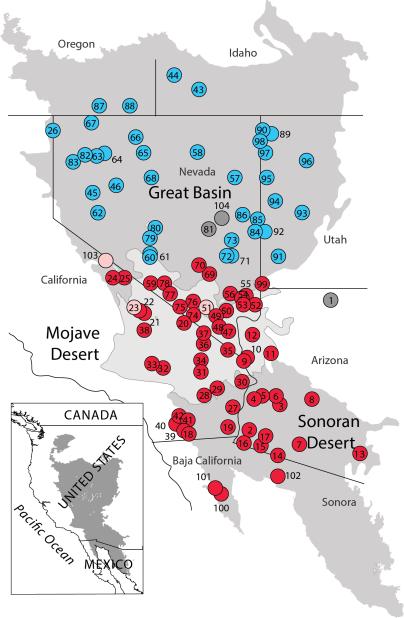
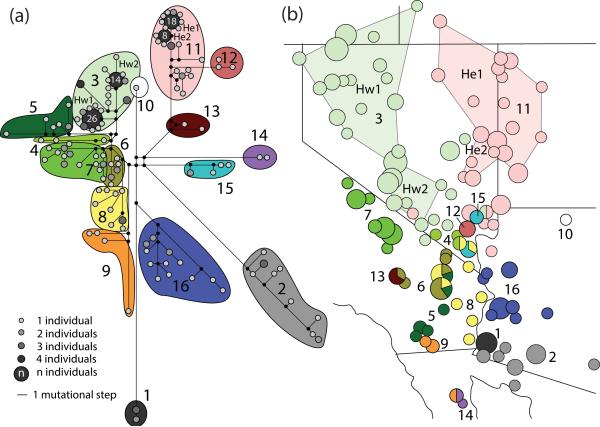
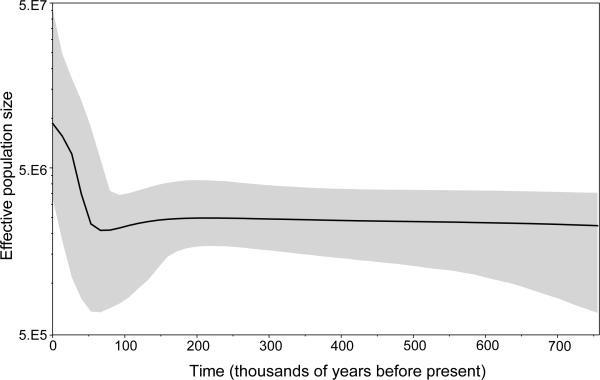
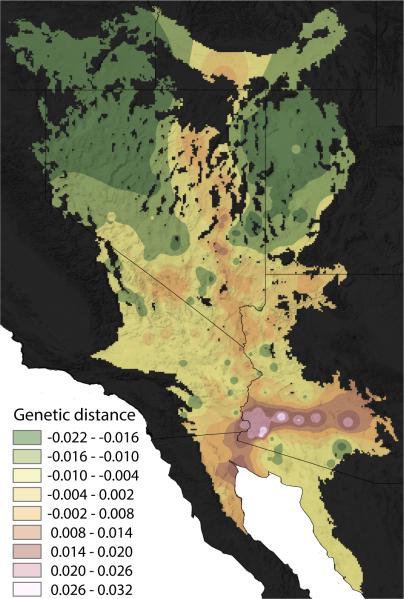
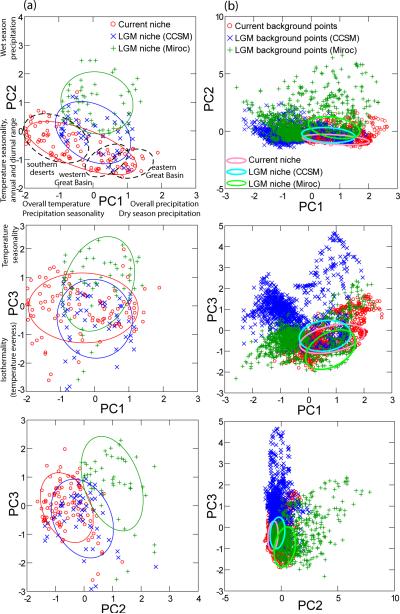
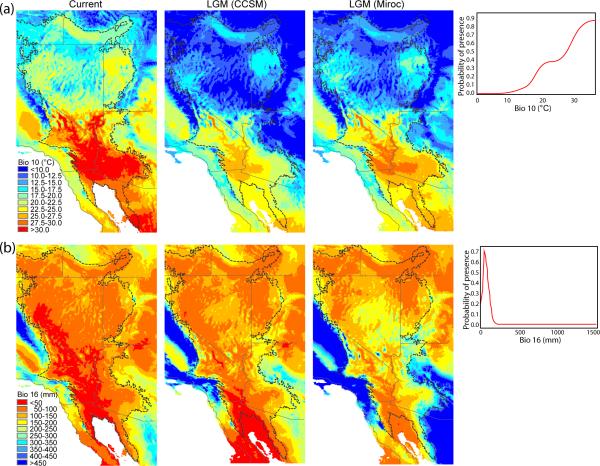
During climate change, species are often assumed to shift their geographic distributions (geographic ranges) in order to track environmental conditions - niches - to which they are adapted. Recent work, however, suggests that the niches do not always remain conserved during climate change but shift instead, allowing populations to persist in place or expand into new areas. We assessed the extent of range and niche shifts in response to the warming climate after the Last Glacial Maximum (LGM) in the desert horned lizard (Phrynosoma platyrhinos), a species occupying the western deserts of North America. We used a phylogeographic approach with mitochondrial DNA sequences to approximate the species range during the LGM by identifying populations that exhibit a genetic signal of population stability versus those that exhibit a signal of a recent (likely post-LGM) geographic expansion. We then compared the climatic niche that the species occupies today with the niche it occupied during the LGM using two models of simulated LGM climate. The genetic analyses indicated that P. platyrhinos persisted within the southern Mojave and Sonoran deserts throughout the latest glacial period and expanded from these deserts northwards, into the western and eastern Great Basin, after the LGM. The climatic niche comparisons revealed that P. platyrhinos expanded its climatic niche after the LGM towards novel, warmer and drier climates that allowed it to persist within the southern deserts. Simultaneously, the species shifted its climatic niche towards greater temperature and precipitation fluctuations after the LGM. We concluded that climatic changes at the end of the LGM promoted both range and niche shifts in this lizard. The mechanism that allowed the species to shift its niche remains unknown, but phenotypic plasticity likely contributes to the species ability to adjust to climate change.
Keywords: Great Basin; Last Glacial Maximum; niche assessment; niche shift; non-analog climate; range expansion.
Figures
Similar articles
-
The effects of climate and demographic history in shaping genomic variation across populations of the Desert Horned Lizard (Phrynosoma platyrhinos).Mol Ecol. 2021 Sep;30(18):4481-4496. doi: 10.1111/mec.16070. Epub 2021 Jul 21. Mol Ecol. 2021. PMID: 34245067
-
Evaluating Past Range Shifts and Niche Dynamics of Giant Pandas Since the Last Interglacial.Animals (Basel). 2025 Mar 12;15(6):801. doi: 10.3390/ani15060801. Animals (Basel). 2025. PMID: 40150330 Free PMC article.
-
Phylogeography of Beck's Desert Scorpion, Paruroctonus becki, reveals Pliocene diversification in the Eastern California Shear Zone and postglacial expansion in the Great Basin Desert.Mol Phylogenet Evol. 2013 Dec;69(3):502-13. doi: 10.1016/j.ympev.2013.07.028. Epub 2013 Aug 9. Mol Phylogenet Evol. 2013. PMID: 23933071
-
Responses of Amazonian ecosystems to climatic and atmospheric carbon dioxide changes since the last glacial maximum.Philos Trans R Soc Lond B Biol Sci. 2004 Mar 29;359(1443):499-514. doi: 10.1098/rstb.2003.1434. Philos Trans R Soc Lond B Biol Sci. 2004. PMID: 15212099 Free PMC article. Review.
-
The climatic association of population divergence and future extinction risk of Solanum pimpinellifolium.AoB Plants. 2020 Mar 12;12(2):plaa012. doi: 10.1093/aobpla/plaa012. eCollection 2020 Apr. AoB Plants. 2020. PMID: 32257092 Free PMC article. Review.
Cited by
-
Genome-Scale Data Reveal Deep Lineage Divergence and a Complex Demographic History in the Texas Horned Lizard (Phrynosoma cornutum) throughout the Southwestern and Central United States.Genome Biol Evol. 2022 Jan 4;14(1):evab260. doi: 10.1093/gbe/evab260. Genome Biol Evol. 2022. PMID: 34849831 Free PMC article.
-
Genetic variation during range expansion: effects of habitat novelty and hybridization.Proc Biol Sci. 2017 Apr 12;284(1852):20170007. doi: 10.1098/rspb.2017.0007. Proc Biol Sci. 2017. PMID: 28381622 Free PMC article.
-
Comparative phylogeography clarifies the complexity and problems of continental distribution that drove A. R. Wallace to favor islands.Proc Natl Acad Sci U S A. 2016 Jul 19;113(29):7970-7. doi: 10.1073/pnas.1601072113. Proc Natl Acad Sci U S A. 2016. PMID: 27432953 Free PMC article.
-
A chromosome-level genome assembly and annotation of the desert horned lizard, Phrynosoma platyrhinos, provides insight into chromosomal rearrangements among reptiles.Gigascience. 2022 Feb 4;11:giab098. doi: 10.1093/gigascience/giab098. Gigascience. 2022. PMID: 35134927 Free PMC article.
-
Rattlesnake migrations and the implications of thermal landscapes.Mov Ecol. 2020 May 27;8:21. doi: 10.1186/s40462-020-00202-0. eCollection 2020. Mov Ecol. 2020. PMID: 32514356 Free PMC article.
References
-
- Ackerly D. Canopy gaps to climate change - extreme events, ecology and evolution. New Phytologist. 2003a;160:2–4. - PubMed
-
- Ackerly DD. Community assembly, niche conservatism, and adaptive evolution in changing environments. International Journal of Plant Sciences. 2003b;164:S165–S184.
-
- Araújo MB, Guisan A. Five (or so) challenges for species distribution modelling. Journal of Biogeography. 2006;33:1677–1688.
-
- Arévalo E, et al. Mitochondrial DNA sequence divergence and phylogenetic relationships among 8 chromosome races of the Sceloporus grammicus complex (Phrynosomatidae) in central Mexico. Systematic Biology. 1994;43:387–418.
-
- Bandelt HJ, et al. Median-joining networks for inferring intraspecific phylogenies. Molecular Biology and Evolution. 1999;16:37–48. - PubMed
Grants and funding
LinkOut - more resources
Full Text Sources
Other Literature Sources
Miscellaneous