. 2016 Feb 23;7(3):963-78.
doi: 10.1364/BOE.7.000963. eCollection 2016 Mar 1.

In vivo bioluminescence and reflectance imaging of multiple organs in bioluminescence reporter mice by bundled-fiber-coupled microscopy

Affiliations

In vivo bioluminescence and reflectance imaging of multiple organs in bioluminescence reporter mice by bundled-fiber-coupled microscopy

Yoriko Ando et al. Biomed Opt Express. .

Abstract

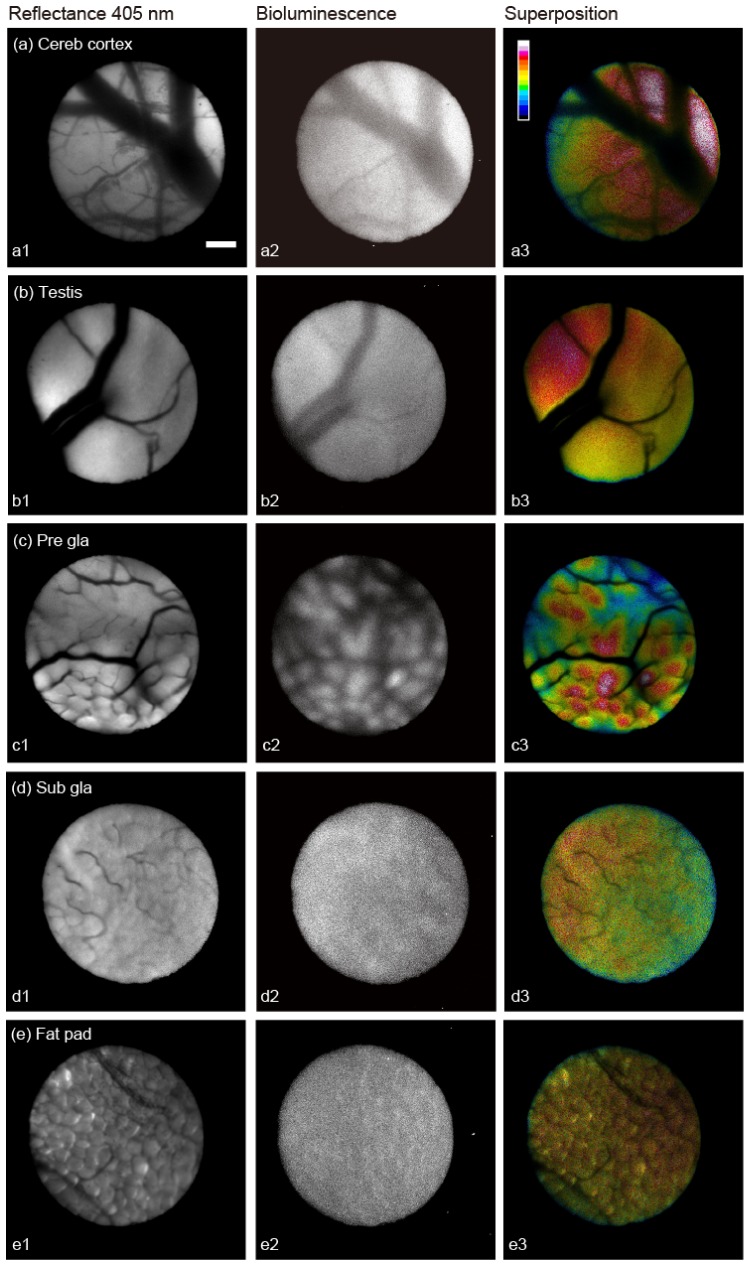
Bioluminescence imaging (BLI) is used in biomedical research to monitor biological processes within living organisms. Recently, fiber bundles with high transmittance and density have been developed to detect low light with high resolution. Therefore, we have developed a bundled-fiber-coupled microscope with a highly sensitive cooled-CCD camera that enables the BLI of organs within the mouse body. This is the first report of in vivo BLI of the brain and multiple organs in luciferase-reporter mice using bundled-fiber optics. With reflectance imaging, the structures of blood vessels and organs can be seen clearly with light illumination, and it allowed identification of the structural details of bioluminescence images. This technique can also be applied to clinical diagnostics in a low invasive manner.

Keywords: (110.2350) Fiber optics imaging; (170.2150) Endoscopic imaging; (170.3880) Medical and biological imaging.


Figures

Fig. 1
Fig. 1
The bundled-fiber-coupled microscope system. (A) Cross-sectional view of the fiber bundle. The inset shows an enlarged view. (B) Setup of the bundled-fiber-coupled microscope for in vivo BLI and reflectance imaging. The focal plane of the objective lens is optically conjugated with the facial side of a fiber bundle that contacts the surface of the target organ. A laser optically coupled to a fiber is used as the light source for reflectance imaging. OL: Objective lens, TL: tube lens.
Fig. 2
Fig. 2
Experimental setup for spatial resolution analysis of the bundled-fiber-coupled microscope. A fluorescent bead in the air or in water is excited by the fluorescence microscope system, and luminescence imaging of the fluorescence bead is performed by the bundled-fiber-coupled microscope with changing distance, x, from the bead to the facial side of the fiber bundle.
Fig. 3
Fig. 3
Spatial resolution of the bundled-fiber-coupled microscope. (A) Luminescnce images of a single fluorescent bead, 10 – 15 μm in diameter, with changing distance, x = 0, 10, 20 or 30 μm. The dashed circle indicates the edge of the fiber bundle. The scale bar indicates 100 μm. (B) The maximum intensity with changing distance (i: 10 – 15 μm bead, ii: 45 – 53 μm bead). The closed circle indicates in the air and the opened circle indicates in water. The solid and dashed lines represent the smoothed curves of data with the Gaussian kernel (SD = 2.5) in the air and in water, respectively. (C) FWHM (d) in diameter of luminescence image with changing distance (i: 10 – 15 μm bead, ii: 45 – 53 μm bead). The closed circle indicates in the air and the opened circle indicates in water. Both are fitted by a hyperbolic function curve with a solid curve and a dashed curve for air and water, respectively. The inset shows the concept of FWHM, d.
Fig. 4
Fig. 4
Bioluminescence and reflectance images of ffLuc-HEK293 cells. Reflectance image (left) and bioluminescence image (right) with high (upper) and low (bottom) cell densities. The scale bar indicates 100 μm.
Fig. 5
Fig. 5
In vivo bioluminescence and reflectance image of the brain and peripheral organs of Per1-luc mice. Bioluminescence and reflectance image of Cereb cortex (a), testis (b), Pre gla (c), Sub gla (d), and Fat pad (e) of Per1-luc mouse. (Left) Reflectance images with 405 nm illumination. (Middle) Bioluminescence images. (Right) Superposition image of the reflectance image in grayscale and the bioluminescence image as a heat map with 16 colors in lookup tables of ImageJ. The scale bar indicates 100 μm.
Fig. 6
Fig. 6
Bioluminescence intensity. The data show the mean intensity per pixel for an integral time of 5 minutes ± SE (Cereb cortex, 15636 ± 1680, n = 7; testis, 18063 ± 3141, n = 6; Pre gla, 25878 ± 7144, n = 7; Sub gla, 2553 ± 292, n = 7; Fat pad, 2415 ± 673, n = 6 with 50 mM luciferin, and Cereb cortex, 198 ± 42, n = 4; testis, 166 ± 63, n = 4; Pre gla, 109 ± 11, n = 4; Sub gla, 192 ± 28, n = 4; Fat pad, 236 ± 153, n = 3 with 0 mM luciferin; ****p < 0.0001; **p < 0.01 vs. the mean intensity with 0 mM luciferin, unpaired Student’s t test).
Fig. 7
Fig. 7
Ex vivo luciferase assay of Per1-luc mouse. Luciferase activity in the brain and organs of Per1-luc mice were evaluated by ex vivo luciferase assay. Each organ was cut into small pieces and homogenized. The supernatant from each sample were mixed with luciferase assay kit (PicaGene BrillianStar-LT, 301-15371; Toyo Ink Group, Tokyo, Japan). Bioluminescence intensity was measured with a plate reader (Fluoroscan Ascent FL; Thermo Scientific). The protein concentration of the supernatant was determined with a BCA protein assay kit (Pierce BCA Protein Assay Kit, 23227; Thermo Scientific), and used to correct the bioluminescence intensity. Bioluminescence intensity per protein of each organ is plotted (mean ± SE, n = 4 except Sub gla and Fat pad n = 3).
Fig. 8
Fig. 8
Reflectance image with 488 nm illumination. Reflectance images with 488 nm illumination of Cereb cortex (a), testis (b), Pre gla (c), Sub gla (d), and Fat pad (e) of Per1-luc mouse. Triangles in (a) show the overlapping of blood vessels. The scale bar indicates 100 μm.
Fig. 9
Fig. 9
Fluorescence imaging of cell membrane in Pre gla. Pre gla was fixed and stained with the fluorescent marker for the cell membrane (CellMask Deep Red plasma Membrane Stain, C10046, diluted 1:2000 with PBS; Molecular Probes, Eugene, OR). Fluorescence imaging was performed using a confocal microscopy system (A1; Nikon). (a) and (b) show the perspective and magnified fluorescence image, respectively.

Similar articles

Cited by

References

    1. Badr C. E., Tannous B. A., “Bioluminescence imaging: progress and applications,” Trends Biotechnol. 29(12), 624–633 (2011).10.1016/j.tibtech.2011.06.010 - DOI - PMC - PubMed
    1. Deluca M., “Firefly luciferase,” Adv. Enzymol. Relat. Areas Mol. Biol. 44, 37–68 (1976). - PubMed
    1. Wood K. V., “The chemical mechanism and evolutionary development of beetle bioluminescence,” Photochem. Photobiol. 62(4), 662–673 (1995).10.1111/j.1751-1097.1995.tb08714.x - DOI
    1. Shimomura O., Bioluminescence: Chemical Principles and Methods (World Scientific, Hackensack, N.J., 2006), pp. xxvii, 470 p.
    1. Troy T., Jekic-McMullen D., Sambucetti L., Rice B., “Quantitative comparison of the sensitivity of detection of fluorescent and bioluminescent reporters in animal models,” Mol. Imaging 3(1), 9–23 (2004).10.1162/153535004773861688 - DOI - PubMed

LinkOut - more resources