

Eye-pupil displacement and prediction: effects on residual wavefront in adaptive optics retinal imaging
- PMID: 27231607
- PMCID: PMC4869933
- DOI: 10.1364/BOE.7.001051
Eye-pupil displacement and prediction: effects on residual wavefront in adaptive optics retinal imaging
Abstract
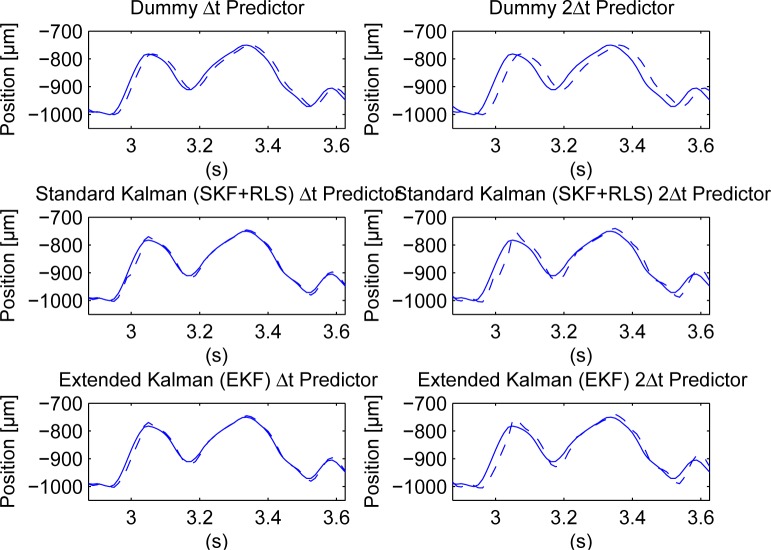
This paper studies the effect of pupil displacements on the best achievable performance of retinal imaging adaptive optics (AO) systems, using 52 trajectories of horizontal and vertical displacements sampled at 80 Hz by a pupil tracker (PT) device on 13 different subjects. This effect is quantified in the form of minimal root mean square (rms) of the residual phase affecting image formation, as a function of the delay between PT measurement and wavefront correction. It is shown that simple dynamic models identified from data can be used to predict horizontal and vertical pupil displacements with greater accuracy (in terms of average rms) over short-term time horizons. The potential impact of these improvements on residual wavefront rms is investigated. These results allow to quantify the part of disturbances corrected by retinal imaging systems that are caused by relative displacements of an otherwise fixed or slowy-varying subject-dependent aberration. They also suggest that prediction has a limited impact on wavefront rms and that taking into account PT measurements in real time improves the performance of AO retinal imaging systems.
Keywords: (070.2025) Discrete optical signal processing; (110.1080) Active or adaptive optics; (120.0120) Instrumentation, measurement, and metrology; (170.4470) Ophthalmology.
Figures


Similar articles
-
Wavefront error correction with adaptive optics in diabetic retinopathy.Optom Vis Sci. 2014 Oct;91(10):1238-43. doi: 10.1097/OPX.0000000000000252. Optom Vis Sci. 2014. PMID: 24748028 Free PMC article.
-
Adaptive optics in the mouse eye: wavefront sensing based vs. image-guided aberration correction.Biomed Opt Express. 2019 Aug 23;10(9):4757-4774. doi: 10.1364/BOE.10.004757. eCollection 2019 Sep 1. Biomed Opt Express. 2019. PMID: 31565523 Free PMC article.
-
High-resolution retinal imaging with micro adaptive optics system.Appl Opt. 2011 Aug 1;50(22):4365-75. doi: 10.1364/AO.50.004365. Appl Opt. 2011. PMID: 21833112
-
[Development of a new evaluation system for visual function].Nippon Ganka Gakkai Zasshi. 2004 Dec;108(12):809-34; discussion 835. Nippon Ganka Gakkai Zasshi. 2004. PMID: 15656088 Review. Japanese.
-
Wave aberration of human eyes and new descriptors of image optical quality and visual performance.J Cataract Refract Surg. 2010 Feb;36(2):313-31. doi: 10.1016/j.jcrs.2009.09.026. J Cataract Refract Surg. 2010. PMID: 20152616 Review.
Cited by
-
Fixational eye movement: a negligible source of dynamic aberration.Biomed Opt Express. 2018 Jan 22;9(2):717-727. doi: 10.1364/BOE.9.000717. eCollection 2018 Feb 1. Biomed Opt Express. 2018. PMID: 29552407 Free PMC article.
References
LinkOut - more resources
Full Text Sources
Other Literature Sources