

Ultrasound-guided photoacoustic imaging for the selective detection of EGFR-expressing breast cancer and lymph node metastases
- PMID: 27231631
- PMCID: PMC4871091
- DOI: 10.1364/BOE.7.001920
Ultrasound-guided photoacoustic imaging for the selective detection of EGFR-expressing breast cancer and lymph node metastases
Abstract
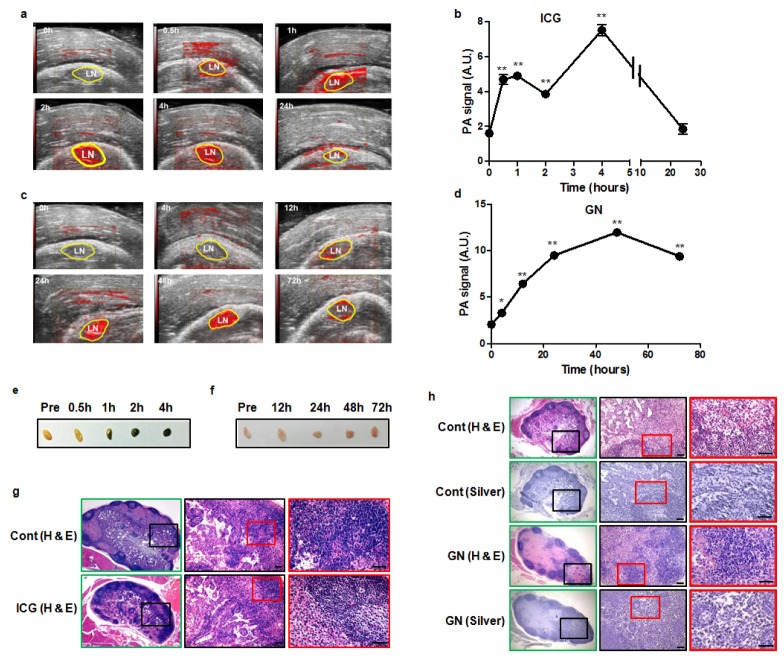
We assessed the use of ultrasound (US)-guided photoacoustic imaging (PAI) and anti-EGFR antibody-conjugated gold nanorods (anti-EGFR-GNs) to non-invasively detect EGFR-expressing primary tumor masses and regional lymph node (LN) metastases in breast tumor mice generated by injecting MCF-7 (EGFR-negative) or MDA-MB-231 (EGFR-positive) human breast cells using a preclinical Vevo 2100 LAZR Imaging system. Anti-EGFR-GNs provided a significant enhancement in the PA signal in MDA-MB-231 tumor and the axillary LN metastases relative to MCF-7 tumor and non-LN metastases. We demonstrated that US-guided PAI using anti-EGFR-GNs is highly sensitive for the selective visualization of EGFR-expressing breast primary tumors as well as LN micrometastases.
Keywords: (170.3880) Medical and biological imaging; (170.4580) Optical diagnostics for medicine; (170.5120) Photoacoustic imaging; (170.7170) Ultrasound.
Figures


Similar articles
-
Noninvasive Photoacoustic Imaging of Dendritic Cell Stimulated with Tumor Cell-Derived Exosome.Mol Imaging Biol. 2020 Jun;22(3):612-622. doi: 10.1007/s11307-019-01410-w. Mol Imaging Biol. 2020. PMID: 31385127
-
Comparisons of Positron Emission Tomography/Computed Tomography and Ultrasound Imaging for Detection of Internal Mammary Lymph Node Metastases in Patients With Breast Cancer and Pathologic Correlation by Ultrasound-Guided Biopsy Procedures.J Ultrasound Med. 2015 Aug;34(8):1385-94. doi: 10.7863/ultra.34.8.1385. J Ultrasound Med. 2015. PMID: 26206824
-
Intraoperative imaging of metastatic lymph nodes using a fluorophore-conjugated antibody in a HER2/neu-expressing orthotopic breast cancer mouse model.Anticancer Res. 2013 Feb;33(2):419-24. Anticancer Res. 2013. PMID: 23393332
-
Staging of women with breast cancer after introduction of sentinel node guided axillary dissection.Dan Med J. 2012 Jul;59(7):B4475. Dan Med J. 2012. PMID: 22759850 Review.
-
Sentinel lymph node as a new marker for therapeutic planning in breast cancer patients.J Surg Oncol. 2004 Mar;85(3):102-11. doi: 10.1002/jso.20022. J Surg Oncol. 2004. PMID: 14991881 Review.
Cited by
-
Noninvasive Photoacoustic Imaging of Dendritic Cell Stimulated with Tumor Cell-Derived Exosome.Mol Imaging Biol. 2020 Jun;22(3):612-622. doi: 10.1007/s11307-019-01410-w. Mol Imaging Biol. 2020. PMID: 31385127
-
Review on ultrasound-guided photoacoustic imaging for complementary analyses of biological systems in vivo.Exp Biol Med (Maywood). 2023 May;248(9):762-774. doi: 10.1177/15353702231181341. Epub 2023 Jul 15. Exp Biol Med (Maywood). 2023. PMID: 37452700 Free PMC article. Review.
-
Ultrasound-guided Photoacoustic image Annotation Toolkit in MATLAB (PHANTOM) for preclinical applications.bioRxiv [Preprint]. 2023 Nov 10:2023.11.07.565885. doi: 10.1101/2023.11.07.565885. bioRxiv. 2023. Update in: Photoacoustics. 2024 Nov 09;41:100662. doi: 10.1016/j.pacs.2024.100662. PMID: 37986998 Free PMC article. Updated. Preprint.
-
Breast cancer cell-derived exosomes and macrophage polarization are associated with lymph node metastasis.Oncotarget. 2017 Dec 13;9(7):7398-7410. doi: 10.18632/oncotarget.23238. eCollection 2018 Jan 26. Oncotarget. 2017. PMID: 29484119 Free PMC article.
-
Ultrasound-guided photoacoustic image annotation toolkit in MATLAB (PHANTOM) for preclinical applications.Photoacoustics. 2024 Nov 9;41:100662. doi: 10.1016/j.pacs.2024.100662. eCollection 2025 Feb. Photoacoustics. 2024. PMID: 39687485 Free PMC article.
References
-
- Wu J. M., Fackler M. J., Halushka M. K., Molavi D. W., Taylor M. E., Teo W. W., Griffin C., Fetting J., Davidson N. E., De Marzo A. M., Hicks J. L., Chitale D., Ladanyi M., Sukumar S., Argani P., “Heterogeneity of breast cancer metastases: comparison of therapeutic target expression and promoter methylation between primary tumors and their multifocal metastases,” Clin. Cancer Res. 14(7), 1938–1946 (2008).10.1158/1078-0432.CCR-07-4082 - DOI - PMC - PubMed
-
- Carey L. A., Rugo H. S., Marcom P. K., Mayer E. L., Esteva F. J., Ma C. X., Liu M. C., Storniolo A. M., Rimawi M. F., Forero-Torres A., Wolff A. C., Hobday T. J., Ivanova A., Chiu W. K., Ferraro M., Burrows E., Bernard P. S., Hoadley K. A., Perou C. M., Winer E. P., “TBCRC 001: randomized phase II study of cetuximab in combination with carboplatin in stage IV triple-negative breast cancer,” J. Clin. Oncol. 30(21), 2615–2623 (2012).10.1200/JCO.2010.34.5579 - DOI - PMC - PubMed
-
- Ferraro D. A., Gaborit N., Maron R., Cohen-Dvashi H., Porat Z., Pareja F., Lavi S., Lindzen M., Ben-Chetrit N., Sela M., Yarden Y., “Inhibition of triple-negative breast cancer models by combinations of antibodies to EGFR,” Proc. Natl. Acad. Sci. U.S.A. 110(5), 1815–1820 (2013).10.1073/pnas.1220763110 - DOI - PMC - PubMed
LinkOut - more resources
Full Text Sources
Other Literature Sources
Research Materials
Miscellaneous