

Utility of a human FcRn transgenic mouse model in drug discovery for early assessment and prediction of human pharmacokinetics of monoclonal antibodies
- PMID: 27232760
- PMCID: PMC4968115
- DOI: 10.1080/19420862.2016.1193660
Utility of a human FcRn transgenic mouse model in drug discovery for early assessment and prediction of human pharmacokinetics of monoclonal antibodies
Abstract
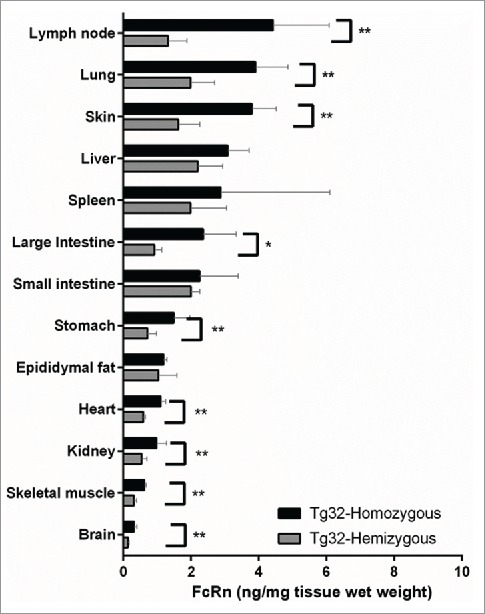
Therapeutic antibodies continue to develop as an emerging drug class, with a need for preclinical tools to better predict in vivo characteristics. Transgenic mice expressing human neonatal Fc receptor (hFcRn) have potential as a preclinical pharmacokinetic (PK) model to project human PK of monoclonal antibodies (mAbs). Using a panel of 27 mAbs with a broad PK range, we sought to characterize and establish utility of this preclinical animal model and provide guidance for its application in drug development of mAbs. This set of mAbs was administered to both hemizygous and homozygous hFcRn transgenic mice (Tg32) at a single intravenous dose, and PK parameters were derived. Higher hFcRn protein tissue expression was confirmed by liquid chromatography-high resolution tandem mass spectrometry in Tg32 homozygous versus hemizygous mice. Clearance (CL) was calculated using non-compartmental analysis and correlations were assessed to historical data in wild-type mouse, non-human primate (NHP), and human. Results show that mAb CL in hFcRn Tg32 homozygous mouse correlate with human (r(2) = 0.83, r = 0.91, p < 0.01) better than NHP (r(2) = 0.67, r = 0.82, p < 0.01) for this dataset. Applying simple allometric scaling using an empirically derived best-fit exponent of 0.93 enabled the prediction of human CL from the Tg32 homozygous mouse within 2-fold error for 100% of mAbs tested. Implementing the Tg32 homozygous mouse model in discovery and preclinical drug development to predict human CL may result in an overall decreased usage of monkeys for PK studies, enhancement of the early selection of lead molecules, and ultimately a decrease in the time for a drug candidate to reach the clinic.
Keywords: Allometric scaling; FcRn; Human PK prediction; IgG; Neonatal Fc Receptor; PK; clearance; hFcRn transgenic mice; mAb; monoclonal antibody; pharmacokinetics.
Figures
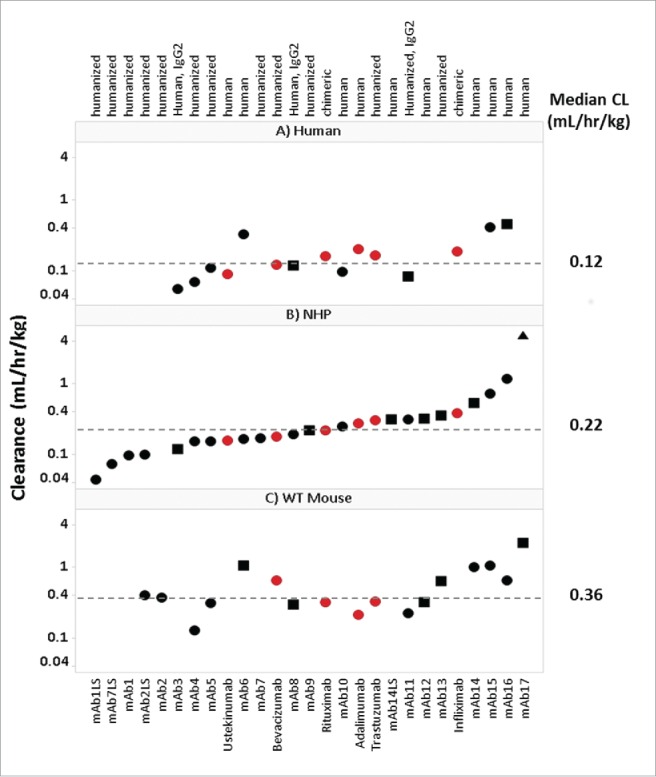
 ) and 6 marketed mAbs () and the CL values (mL/hr/kg) for human (15/27), NHP (26/27), and WT mouse (17/27), respectively. Mean CL value are depicted for each species. Symbols depict definitive linear CL values (•), apparent linear CL values (▪) and non-linear (▴). Of the 27 collected mAbs: 24 are IgG1 and 3 are IgG2; 16 have soluble ligand targets, 9 have membrane bound targets, and 2 target both soluble and membrane bound receptor targets; 12 are fully human, 13 are humanized, and 2 are chimeric.
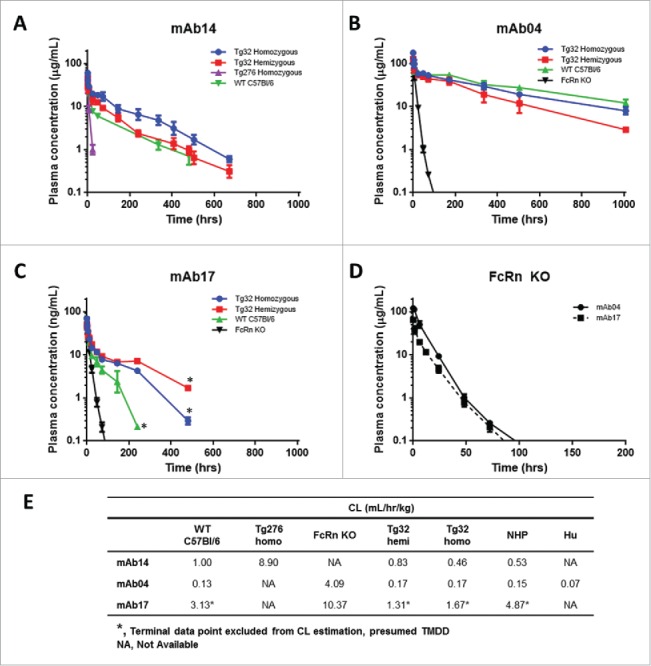
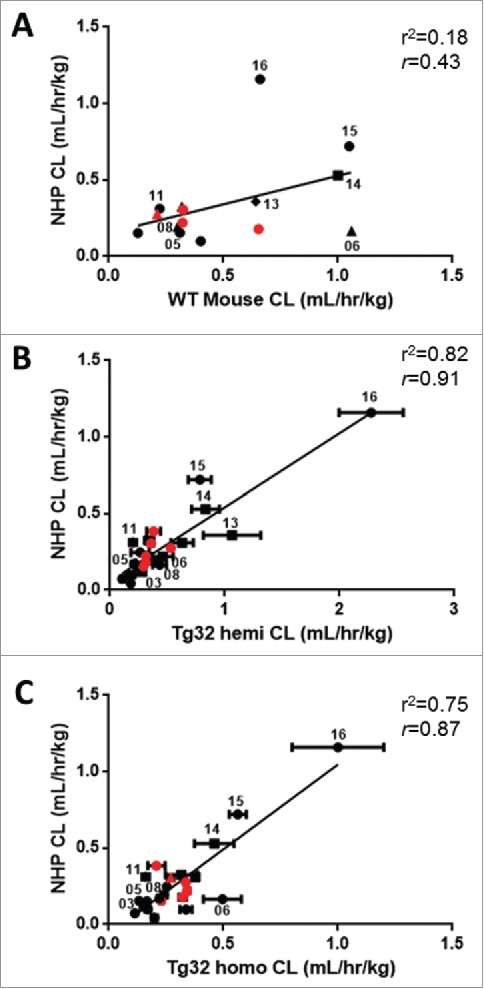 , definitive linear CL values; ▪, apparent linear CL in NHP only; ▴, apparent linear CL in rodent only; ♦, apparent linear CL in both NHP and rodent. •, Pfizer mAbs , marketed therapeutic mAbs.
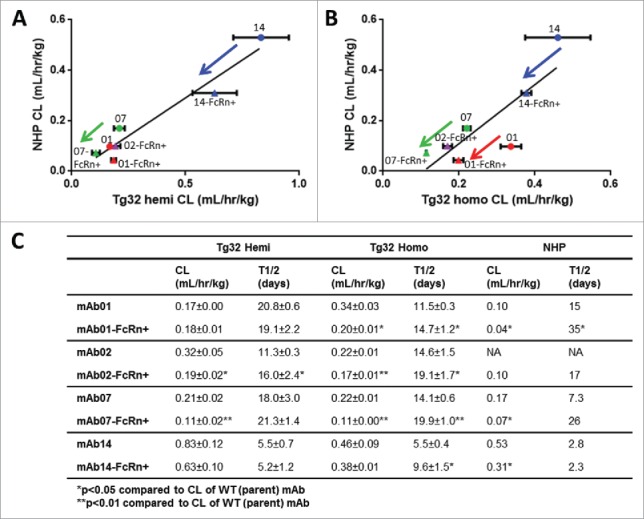
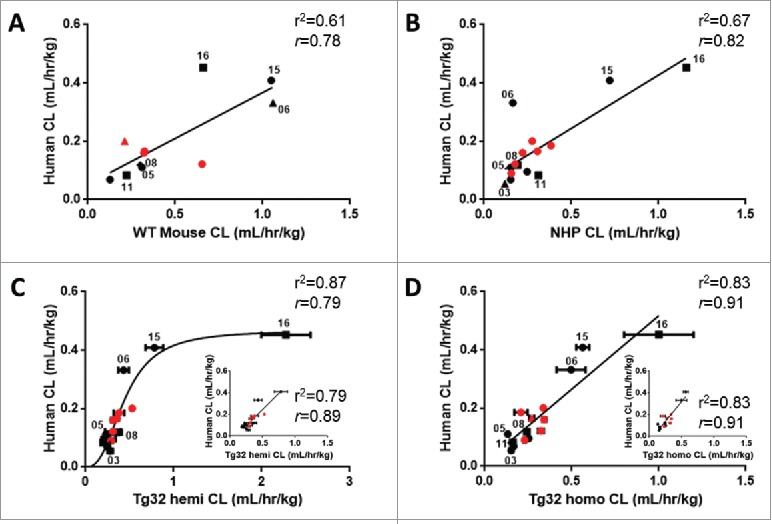 , definitive linear CL values; ▴, apparent linear CL in rodent or NHP; ▪apparent linear CL in human; ♦, apparent linear CL in rodent or NHP and human. •, Pfizer mAbs, , marketed therapeutic mAbs.
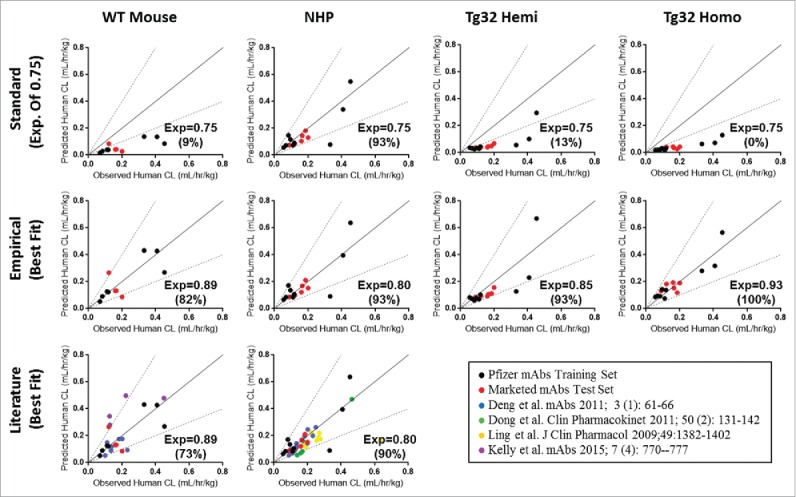 , definitive linear CL values; ▴, apparent linear CL in rodent or NHP; ▪, apparent linear CL in human; ♦ apparent linear CL in rodent or NHP and human. •, training data set. , test set, marketed therapeutic mAbs.
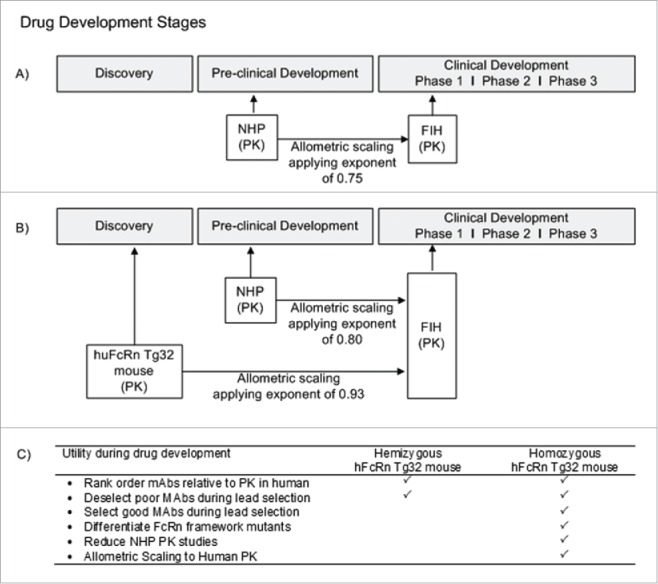
References
-
- Reichert JM. Antibodies to watch in 2015. mAbs 2015; 7:1–8; PMID:25484055; http://dx.doi.org/10.4161/19420862.2015.988944 - DOI - PMC - PubMed
-
- Shi S. Biologics: an update and challenge of their pharmacokinetics. Curr Drug Metab 2014; 15:271–90; PMID:24745789; http://dx.doi.org/10.2174/138920021503140412212905 - DOI - PubMed
-
- Hotzel I, Theil FP, Bernstein LJ, Prabhu S, Deng R, Quintana L, Lutman J, Sibia R, Chan P, Bumbaca D, et al.. A strategy for risk mitigation of antibodies with fast clearance. mAbs 2012; 4:753–60; PMID:23778268; http://dx.doi.org/10.4161/mabs.22189 - DOI - PMC - PubMed
-
- Oitate M, Masubuchi N, Ito T, Yabe Y, Karibe T, Aoki T, Murayama N, Kurihara A, Okudaira N, Izumi T.. Prediction of human pharmacokinetics of therapeutic monoclonal antibodies from simple allometry of monkey data. Drug Metab Pharmacokinet 2011; 26:423–30; PMID:21606605; http://dx.doi.org/10.2133/dmpk.DMPK-11-RG-011 - DOI - PubMed
-
- Deng R, Iyer S, Theil FP, Mortensen DL, Fielder PJ, Prabhu S. Projecting human pharmacokinetics of therapeutic antibodies from nonclinical data: what have we learned? mAbs 2011; 3:61–6; PMID:20962582; http://dx.doi.org/10.4161/mabs.3.1.13799 - DOI - PMC - PubMed
MeSH terms
Substances
LinkOut - more resources
Full Text Sources
Other Literature Sources
Molecular Biology Databases