

Optical Assessment of Soft Contact Lens Edge-Thickness
- PMID: 27232902
- PMCID: PMC4961562
- DOI: 10.1097/OPX.0000000000000892
Optical Assessment of Soft Contact Lens Edge-Thickness
Abstract
Purpose: To assess the edge shape of soft contact lenses using Gabor-Domain Optical Coherence Microscopy (GD-OCM) with a 2-μm imaging resolution in three dimensions and to generate edge-thickness profiles at different distances from the edge tip of soft contact lenses.
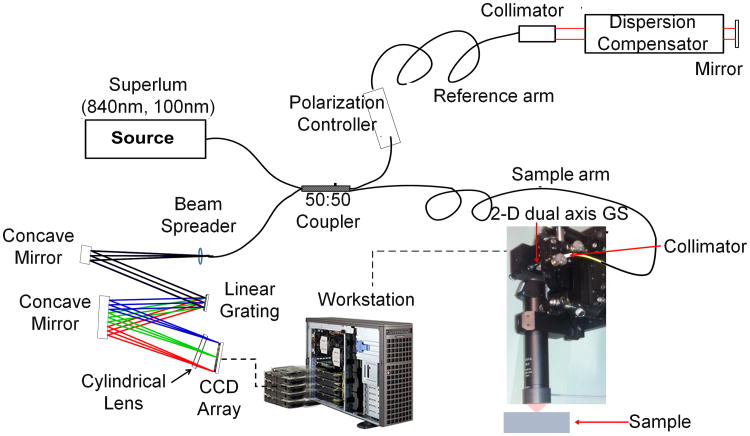
Methods: A high-speed custom-designed GD-OCM system was used to produce 3D images of the edge of an experimental soft contact lens (Bausch + Lomb, Rochester, NY) in four different configurations: in air, submerged into water, submerged into saline with contrast agent, and placed onto the cornea of a porcine eyeball. An algorithm to compute the edge-thickness was developed and applied to cross-sectional images. The proposed algorithm includes the accurate detection of the interfaces between the lens and the environment, and the correction of the refraction error.
Results: The sharply defined edge tip of a soft contact lens was visualized in 3D. Results showed precise thickness measurement of the contact lens edge profile. Fifty cross-sectional image frames for each configuration were used to test the robustness of the algorithm in evaluating the edge-thickness at any distance from the edge tip. The precision of the measurements was less than 0.2 μm.
Conclusions: The results confirmed the ability of GD-OCM to provide high-definition images of soft contact lens edges. As a nondestructive, precise, and fast metrology tool for soft contact lens measurement, the integration of GD-OCM in the design and manufacturing of contact lenses will be beneficial for further improvement in edge design and quality control. In the clinical perspective, the in vivo evaluation of the lens fitted onto the cornea will advance our understanding of how the edge interacts with the ocular surface. The latter will provide insights into the impact of long-term use of contact lenses on the visual performance.
Figures


References
-
- Nichols JJ. Annual report - contact lenses 2013. Contact Lens Spectrum. 2014;29:22–28.
-
- Rah MJ, Walline JJ, Jones-Jordan LA, Sinnott LT, Jackson JM, Manny RE, Coffey B, Lyons S. Vision specific quality of life of pediatric contact lens wearers. ACHIEVE Study Group. Optom Vis Sci. 2010;87:560–6. - PubMed
-
- Craig JP, Willcox MD, Argueso P, Maissa C, Stahl U, Tomlinson A, Wang J, Yokoi N, Stapleton F. The TFOS International Workshop on Contact Lens Discomfort: report of the contact lens interactions with the tear film subcommittee. Invest Ophthalmol Vis Sci. 2013;54:TFOS123–56. - PubMed
-
- Efron N, Jones L, Bron AJ, Knop E, Arita R, Barabino S, McDermott AM, Villani E, Willcox MD, Markoulli M. The TFOS International Workshop on Contact Lens Discomfort: report of the contact lens interactions with the ocular surface and adnexa subcommittee. Invest Ophthalmol Vis Sci. 2013;54:TFOS98–TFOS122. - PubMed
-
- Nichols JJ, Willcox MD, Bron AJ, Belmonte C, Ciolino JB, Craig JP, Dogru M, Foulks GN, Jones L, Nelson JD, Nichols KK, Purslow C, Schaumberg DA, Stapleton F, Sullivan DA. The TFOS International Workshop on Contact Lens Discomfort: executive summary. Invest Ophthalmol Vis Sci. 2013;54:TFOS7–TFOS13. - PMC - PubMed
MeSH terms
Grants and funding
LinkOut - more resources
Full Text Sources
Other Literature Sources
Research Materials
