. 2017 Apr;45(8):1044-1056.
doi: 10.1111/ejn.13287. Epub 2016 Jun 15.

Calcium dynamics predict direction of synaptic plasticity in striatal spiny projection neurons

Affiliations

Calcium dynamics predict direction of synaptic plasticity in striatal spiny projection neurons

Joanna Jędrzejewska-Szmek et al. Eur J Neurosci. 2017 Apr.

Abstract

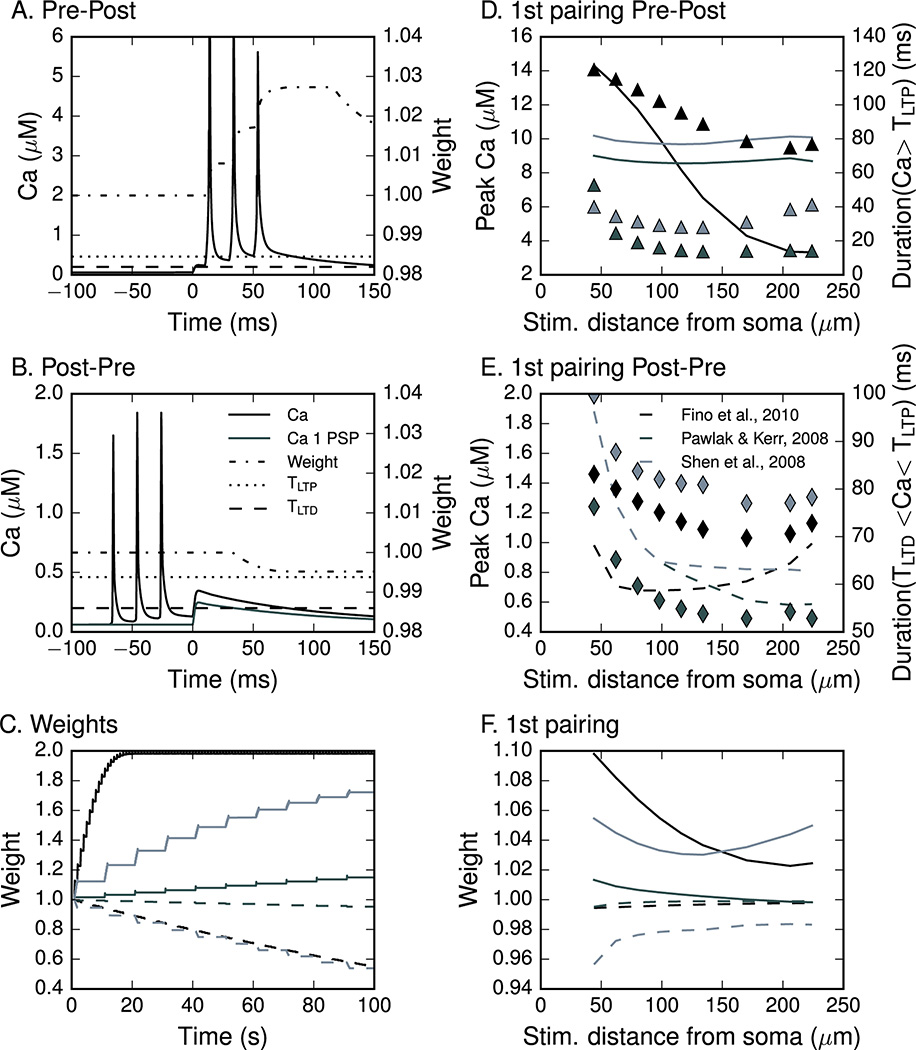
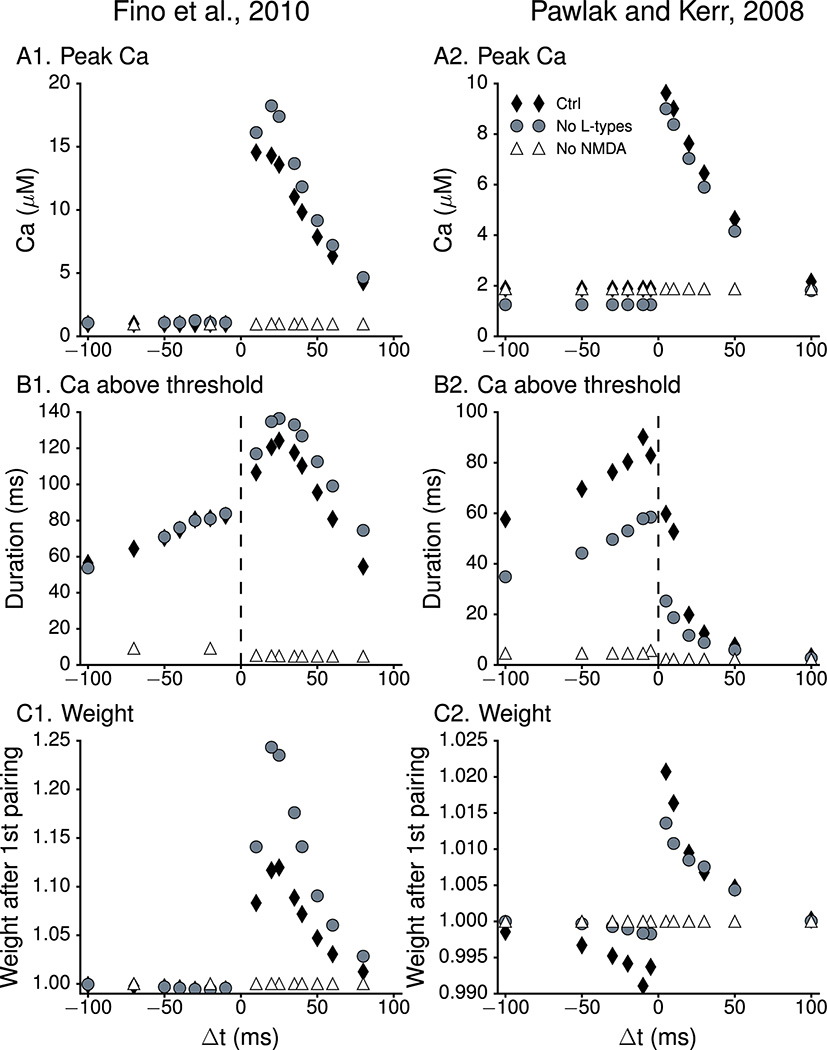
The striatum is a major site of learning and memory formation for sensorimotor and cognitive association. One of the mechanisms used by the brain for memory storage is synaptic plasticity - the long-lasting, activity-dependent change in synaptic strength. All forms of synaptic plasticity require an elevation in intracellular calcium, and a common hypothesis is that the amplitude and duration of calcium transients can determine the direction of synaptic plasticity. The utility of this hypothesis in the striatum is unclear in part because dopamine is required for striatal plasticity and in part because of the diversity in stimulation protocols. To test whether calcium can predict plasticity direction, we developed a calcium-based plasticity rule using a spiny projection neuron model with sophisticated calcium dynamics including calcium diffusion, buffering and pump extrusion. We utilized three spike timing-dependent plasticity (STDP) induction protocols, in which postsynaptic potentials are paired with precisely timed action potentials and the timing of such pairing determines whether potentiation or depression will occur. Results show that despite the variation in calcium dynamics, a single, calcium-based plasticity rule, which explicitly considers duration of calcium elevations, can explain the direction of synaptic weight change for all three STDP protocols. Additional simulations show that the plasticity rule correctly predicts the NMDA receptor dependence of long-term potentiation and the L-type channel dependence of long-term depression. By utilizing realistic calcium dynamics, the model reveals mechanisms controlling synaptic plasticity direction, and shows that the dynamics of calcium, not just calcium amplitude, are crucial for synaptic plasticity.

Keywords: basal ganglia; computational model; long-term potentiation/long-term depression; spike timing-dependent plasticity; striatum.


Conflict of interest statement

The authors declare that they have no conflict of interest.

Figures

Figure 1
Figure 1. Properties of the model
(A) Morphology of the model MSN. (B) Schematic drawing of a dendritic segment with a spine showing calcium (gray circles), calcium buffers (black circles), calcium diffusion between shells (gray arrows), extrusion of calcium via pumps (black arrows), and influx of calcium via voltage-dependent calcium channels (white arrows). (C) Electric response of the model MSN to current injection, showing long latency to AP.
Figure 2
Figure 2. Validation of calcium response in dendrite and dendritic spine
Model produces calcium concentrations similar to that measured using Fluo-5F by (Shindou et al 2011). (A) Calcium in response to EPSP alone in a spine 44 µm or 224 µm from the soma. (B) Calcium in response to a burst of APs alone in the dendrites and in the spines. The model correctly predicts that calcium amplitude in the dendrite in response to a burst of APs increases with distance from the soma, reaches a maximum in the proximal tertiary dendrites (Kerr and Plenz 2002) and then decreases with distance (Day et al 2008). (C,D) Calcium in response to paired EPSP and APs. Both panels present calcium in response to stimulation of a spine 44 µm or 80 µm from the soma. The calcium response to paired EPSP and APs in spines further than 80 µm away from the soma is similar to the calcium response shown for the 80 µm spine. (C) Δt=+10ms for Pre-Post pairing of EPSP and three bAPs. (D) Δt=−30m for Post-Pre pairing of EPSP and three bAPs. The model correctly predicts that calcium amplitudes in response to a Pre-Post STDP protocol are higher (C) than calcium amplitudes in response to a Post-Pre STDP protocol (D). All traces show the calcium bound Fluo-5F, converted to calcium concentration using the equation provided in (Shindou et al 2011).
Figure 3
Figure 3. Calcium transients in response to three different STDP protocols show sensitivity to temporal interval
(A) Each pairing consisted of one PSP and a single bAP that was evoked with a long (30 ms) suprathreshold (0.47 nA) current injection (Fino et al 2010). The timing between the EPSP and bAP was 10 ms. Pairings were given at a frequency of 1 Hz. The peak calcium transient in the PSD region of the spine head in Pre-Post (A1) was ~10 times greater than that seen in Post-Pre (A2). (B) Three bAPs evoked with a 5ms, 1nA somatic current injection are paired with a single EPSP (Pawlak and Kerr 2008). The EPSP either preceded the bAPs (Pre-Post, Δt =+15 ms; B1) or followed the bAPs (Post-Pre, Δt =−10 ms; B2). Pairings were given at a frequency of 0.1 Hz. The peak calcium transients in the PSD region of the spine head in Pre-Post was ~3 times greater than that seen in Post-Pre. (C) The protocol of (Shen et al 2008) consisted of five bursts, with each burst composed of three bAPs (evoked by current injection, 1nA) and 1 or 3 PSPs. For Pre-Post, the three bAPs repeated at 50 Hz (C1) were each preceded by a PSP, (Δt =+5 ms) whereas for Post-Pre three bAPs repeated at 50 Hz were followed by only one EPSP (Δt =−10 ms; C2). Five bursts were repeated at 5 Hz, and each set of bursts was repeated at 10 sec intervals. In response to this protocol the peak calcium transient in the spine head in Pre-Post was around 6 times greater than that seen in Post-Pre. (D) Calcium transients in response to a single pairing of the 3 STDP protocols, both Pre then Post (D1) and Post then Pre (D2) conditions.
Figure 4
Figure 4. Synaptic plasticity rule based on amplitude and duration predicts bidirectional synaptic plasticity correctly
(A) The weight of the corticostriatal synapse was set to increase if the amplitude of the postsynaptic calcium transient was larger than the potentiation threshold TLTP (0.46 µM) for longer than the potentiation duration constant DLTP (2 ms). These thresholds were used for all induction protocols simulated. (B) The weight was set to decrease if the amplitude of the postsynaptic calcium transient was between the potentiation (TLTP) and depression (TLTD: 0.20 µM) thresholds longer than the depression duration constant DLTD (32 ms). No change in weight occurred if the calcium was below the depression threshold. (C) Weight change after 100 s of the simulation for both conditions: Pre then Post (solid line) and Post then Pre (dashed line) of the three STDP protocols. Simulation of Post then Pre of (Pawlak and Kerr 2008) yields a very small weight change for each pairing. Since the pairings are at low frequency, the 100 sec illustrated here shows only 1/6 of the entire stimulation protocol. Simulation of the whole protocol (600 s) would result in synaptic weight of 0.71 for Post then Pre, and 2.0 for Pre then Post. The initial weight was 1 with the maximum weight capped at 2 and minimum capped at 0. (D) Calcium transient amplitudes (lines) and duration above the potentiation threshold (triangles) for the Pre-Post condition as a function of distance of the presynaptic site from the soma. (E) Calcium transient amplitudes (lines) and their duration in between the potentiation and depression threshold (diamonds) for the Post-Pre condition as a function of distance of the presynaptic site from soma. Further than 100 µm from the soma, the calcium amplitude (but not duration) increases with distance for one protocol. (F) Distance dependence of the two threshold with duration plasticity rule shows that taking duration into account is critical for synaptic weight: synaptic weight more closely corresponds to duration than peak amplitude.
Figure 5
Figure 5. Effect of the NMDAR and L-type calcium channel blockers on amplitudes of calcium transients and sensitivity to the inter-stimulus interval (Δt)
(A) Peak calcium concentration in response to Pre-Post and Post-Pre protocols with different inter-stimulus intervals. Peak calcium decreases with distance for Δt > 0 ms, but not for Δt < 0 ms. Blocking NMDA receptors dramatically lowers peak calcium for Δt > 0 ms, with little to no effect for Δt < 0 ms. (B) Duration of calcium above TLTP (for Δt > 0 ms) or between TLTP and TLTD (for Δt < 0 ms). Blocking NMDA receptors reduces the duration of calcium between TLTP and TLTD even when the peak calcium is not reduced. Blocking L type calcium channels reduces the duration above or between thresholds for (Pawlak and Kerr 2008) (B2), but not for (Fino et al 2010) (B1). The increased duration above TLTP for (Fino et al 2010) is caused by a slightly greater action potential amplitude. (C) Synaptic weight after one pairing as a function of inter-stimulus intervals. Synaptic plasticity for both protocols (control condition: solid diamonds) requires Δt between −50 ms and +50 ms. The two threshold with duration plasticity rule correctly predicts that Pre - Post with long Δt will produce no plasticity rather than depression. Blocking NMDA receptors (open triangles) abolishes plasticity as shown experimentally (Pawlak and Kerr 2008). Blocking L-type calcium channels (gray circles) does not effect Δt curve for (Fino et al 2010) (C1) and abolishes LTD for (Pawlak and Kerr 2008) (C2).
Figure 6
Figure 6. Effect of GABAA receptor activation on calcium transients and plasticity direction
(A) Duration of the calcium transient above the potentiation threshold. (B) Duration of the calcium transient between the potentiation and depression thresholds. (C) Change in synaptic weight after one pairing using the Fino et al., 2010 protocol. GABAA receptor activation converts LTP to LTD for Pre-Post pairing (C1) by increasing the duration that calcium remains between the depression and potentiation thresholds (B1). Both phasic and tonic GABAA contribute to this effect. For post-pre pairing, GABAA receptor activation enhances the time spent above the potentiation threshold (A2), but also increases the time between the potentiation and depression thresholds (B2). Thus, the model does not show that GABAA receptor activation converts LTD to LTP for the Post-Pre condition (C2). In all the simulations for Pre-Post condition Δt = 0.070 ms. This interval was chosen because of the smaller positive weight change for control conditions.

Similar articles

Cited by

References

    1. Adermark L, Lovinger DM. Combined activation of L-type Ca2+ channels and synaptic transmission is sufficient to induce striatal long-term depression. J Neurosci. 2007;27:6781–6787. - PMC - PubMed
    1. Allbritton NL, Meyer T, Stryer L. Range of messenger action of calcium ion and inositol 1,4,5-triphosphate. Science. 1992;258:1812–1815. - PubMed
    1. Augustin SM, Beeler JA, McGehee DS, Zhuang X. Cyclic AMP and afferent activity govern bidirectional synaptic plasticity in striatopallidal neurons. J.Neurosci. 2014;34:6692–6699. - PMC - PubMed
    1. Bargas J, Howe A, Eberwine J, Cao Y, Surmeier DJ. Cellular and molecular characterization of Ca2+ currents in acutely isolated, adult rat neostriatal neurons. J.Neuroscience. 1994;14:6667–6686. - PMC - PubMed
    1. Bi GQ, Poo MM. Synaptic modifications in cultured hippocampal neurons: dependence on spike timing, synaptic strength, and postsynaptic cell type. J.Neurosci. 1998;18:10464–10472. - PMC - PubMed

Publication types

MeSH terms

LinkOut - more resources