

Follistatin-like 1 promotes cardiac fibroblast activation and protects the heart from rupture
- PMID: 27234440
- PMCID: PMC4967946
- DOI: 10.15252/emmm.201506151
Follistatin-like 1 promotes cardiac fibroblast activation and protects the heart from rupture
Abstract
Follistatin-like 1 (Fstl1) is a secreted protein that is acutely induced in heart following myocardial infarction (MI). In this study, we investigated cell type-specific regulation of Fstl1 and its function in a murine model of MI Fstl1 was robustly expressed in fibroblasts and myofibroblasts in the infarcted area compared to cardiac myocytes. The conditional ablation of Fstl1 in S100a4-expressing fibroblast lineage cells (Fstl1-cfKO mice) led to a reduction in injury-induced Fstl1 expression and increased mortality due to cardiac rupture during the acute phase. Cardiac rupture was associated with a diminished number of myofibroblasts and decreased expression of extracellular matrix proteins. The infarcts of Fstl1-cfKO mice displayed weaker birefringence, indicative of thin and loosely packed collagen. Mechanistically, the migratory and proliferative capabilities of cardiac fibroblasts were attenuated by endogenous Fstl1 ablation. The activation of cardiac fibroblasts by Fstl1 was mediated by ERK1/2 but not Smad2/3 signaling. This study reveals that Fstl1 is essential for the acute repair of the infarcted myocardium and that stimulation of early fibroblast activation is a novel function of Fstl1.
Keywords: cardiokine; fibrosis; infarct healing; myocardial infarction.
© 2016 The Authors. Published under the terms of the CC BY 4.0 license.
Figures
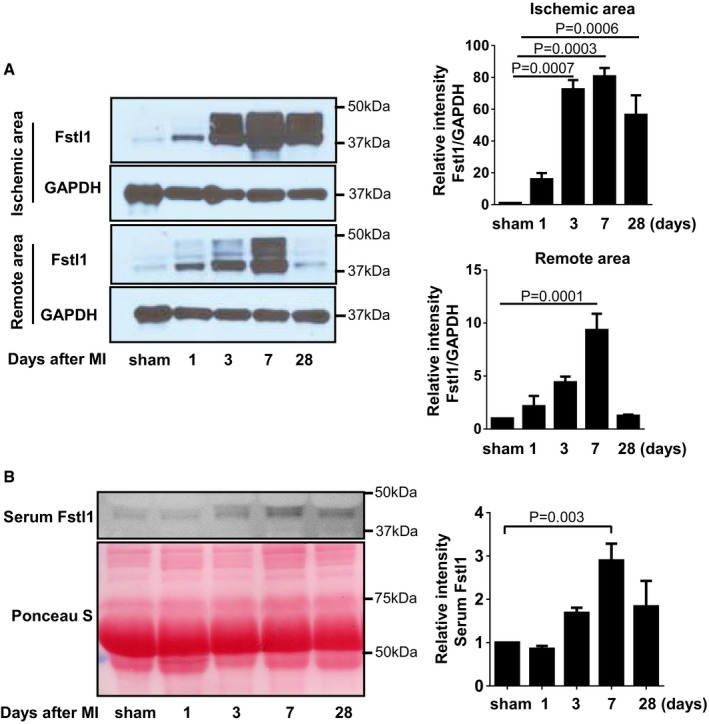
Detection of Fstl1 protein in ischemic myocardium of
WT mice. AfterMI induction, the heart was harvested at the indicated time points and separated to ischemic and remote (non‐ischemic) areas. Fstl1 protein was detected by Western blotting (n = 3, each time point).Serum Fstl1 was detected by Western blotting at the indicated time points. Ponceau S staining of serum reveals equivalent amount of loaded protein (n = 4, each time point).
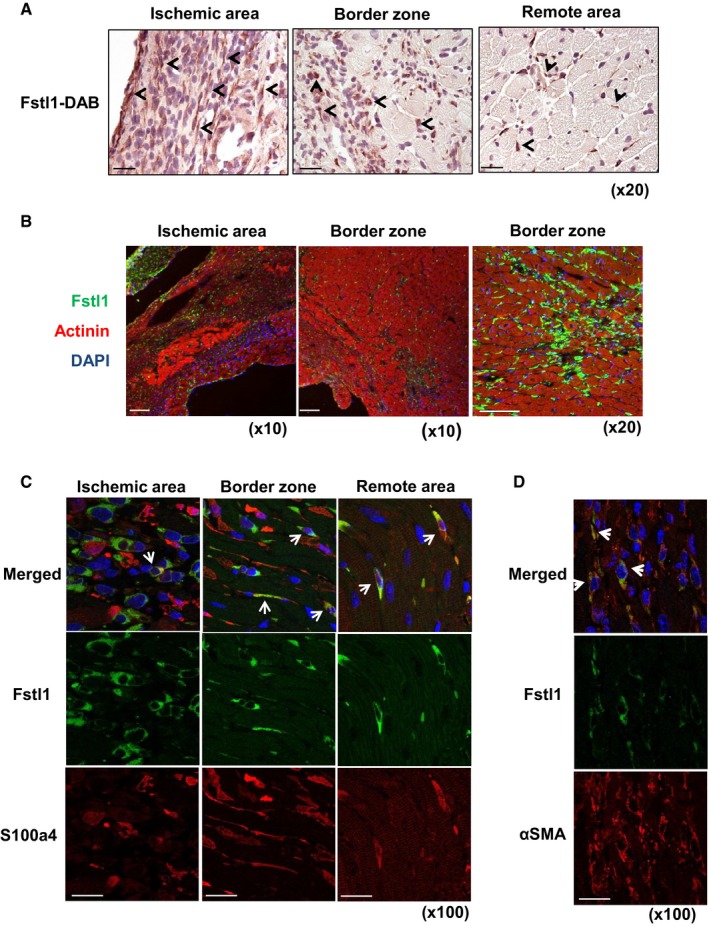
DAB immunohistochemical staining of Fstl1 in ischemic heart at day 3 afterLAD ligation. Arrows indicate a subset of Fstl1‐positive cells. Counter staining was performed with hematoxylin. Scale bar indicates 50 μm.Immunofluorescent staining of Fstl1 (green) and sarcomeric actinin (red). Fstl1 protein was detected in interstitial areas of the ischemic and border zone but not in cardiomyocytes. Scale bar indicates 100 μm.
Immunofluorescent staining of Fstl1 (green) and S100a4 (red) in the ischemic area. Arrows indicate Fstl1 and S100a4 double‐positive cells. Scale bar indicates 20 μm.
Immunofluorescent staining of Fstl1 (green) and α‐smooth muscle actin (red). Arrows indicate Fstl1 and α‐
SMA double‐positive cells. Scale bar indicates 20 μm. Nuclei were stained byDAPI .
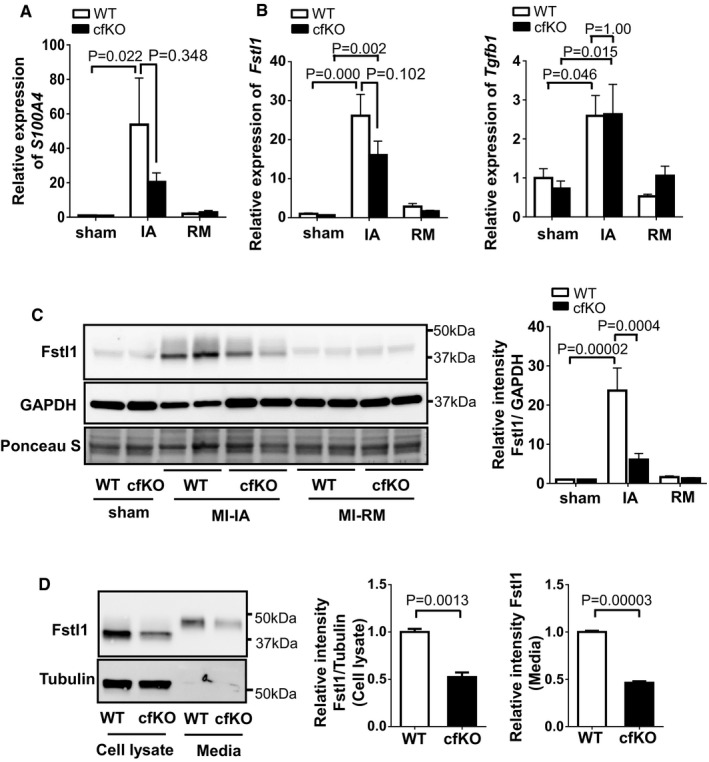
S100a4 expression is induced in the ischemic area (
IA ).qPCR analysis ofmRNA expression of S100a4 in ischemic heart and sham‐operated heart ofWT mice and cfKO mice. Heart samples were harvested at 7 days after the surgery. Statistical analysis was performed by two‐wayANOVA . Post hoc test was performed by Tukey's test. Error bars represent mean ±SEM (n = 16 and 15 forWT and cfKO sham group, n = 15 and 14 forWT and cfKO MI group, respectively).qPCR analysis ofmRNA expression of Fstl1 and Tgfβ1 in sham and post‐MI heart. Error bars represent mean ±SEM (n = 16 and 15 forWT and cfKO sham group, n = 15 and 14 forWT and cfKO MI group, respectively). Statistical analysis was performed by two‐wayANOVA . Post hoc test was performed by Tukey's test.Western blot analysis of Fstl1 protein expression in ischemic and sham‐operated hearts at day 7 after the surgery. Quantified values of Fstl1 protein in
WT and cfKO mouse hearts normalized byGAPDH band intensity are shown. Statistical analysis was performed by two‐wayANOVA . Post hoc test was performed by Tukey's test. Error bars represent mean ±SEM (n = 5 for each sham group and n = 6 for eachMI group).Fstl1 protein expression in isolated cardiac fibroblasts from cf
KO and littermateWT neonatal mice. Cell lysate and its media from cells cultured for 24 h withoutFBS were assessed by Western blotting. Error bars represent mean ±SEM (n = 3 per group). Statistical analysis was performed by unpaired t‐test (two‐tailed). The experiments were performed twice independently.
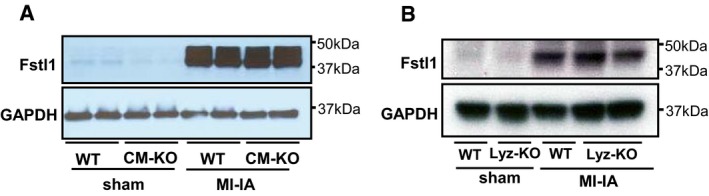
MI ‐induced Fstl1 protein induction in cardiomyocyte‐specific Fstl1 knockout mice (αMHC cre+/− × Fstl1flox/flox) and littermateWT mice (αMHC cre−/− × Fstl1flox/flox) was assessed. The heart was sampled at 7 days afterMI . No attenuation ofMI ‐induced Fstl1 expression was observed.MI ‐induced Fstl1 protein expression in myeloid cell‐specific Fstl1 knockout mice (LyzMcre+/− × Fstl1flox/flox) and littermateWT mice (LyzMcre−/− × Fstl1flox/flox) was assessed. The heart was sampled at 7 days afterMI .MI ‐induced cardiac Fstl1 expression was not attenuated.
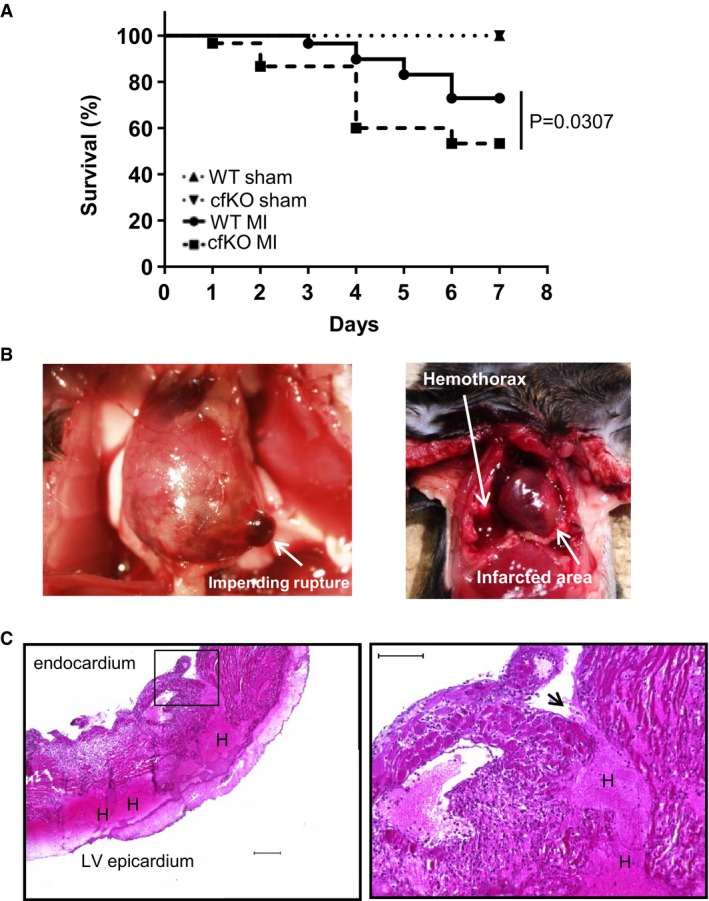
Mouse survival curve after
MI and sham surgery. The mortality of theWT and Fstl1‐cfKO mice afterMI surgery was 27.1 and 46.7%, respectively. Log‐rank (Mantel‐Cox) test was used for statistical analysis (n = 16 forWT sham, n = 15 for Fstl1‐cfKO sham, n = 59 forWT MI and n = 30 for Fstl1‐cfKO MI ).Representative macroscopic images of cardiac rupture. Left: impending
LV rupture found in a cfKO mouse post‐MI when sampling. Right: evidence of hemothorax that was diagnosed as cardiac rupture in deceased mice.Representative microscopic images of ruptured heart stained by H&E. Penetrating hematoma due to a tear from the
LV endocardium to the epicardium. Left: an image obtained with a low magnification lens. Scale bar indicates 200 μm. Right: higher magnification image. Scale bar indicates 100 μm. Arrow indicates the tear site. H indicates hematoma.
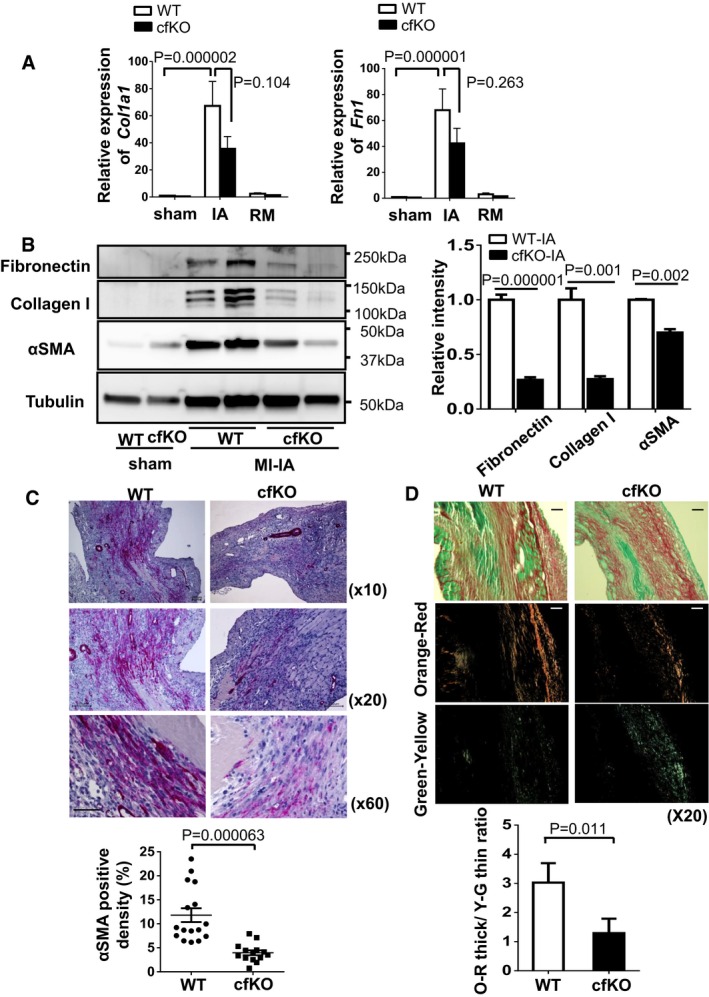
Transcript
mRNA expression of Col1a1 and Fn1 in sham and post‐MI hearts. Hearts were obtained at day 7 after surgery. Error bars represent mean ±SEM (n = 13–16 for each group). Statistical analysis was performed by two‐wayANOVA . Post hoc test was performed by Tukey's test.Protein expression of collagen I, fibronectin and α‐
SMA in the infarcted and sham hearts at day 7 after surgery, as assessed by Western blotting. Quantified values of proteins of interest were normalized relative to the tubulin band intensity. Error bars represent mean ±SEM . Statistical analysis was performed by unpaired t‐test (two‐tailed) for fibronectin and α‐SMA and nonparametric t‐test (two‐tailed) for collagen I (fibronectin and collagen: n = 5 per group, α‐SMA : n = 3 and 4 forWT ‐IA and cfKO ‐IA , respectively).α‐smooth muscle actin‐positive myofibroblasts (red) were stained in histological sections from infarcted hearts of
WT and cfKO mice. Samples were harvested at day 7 afterMI . Counter staining was performed by hematoxylin. Scale bar indicates 100 μm for top and middle images and 50 μm for bottom images. Error bars represent mean ±SEM . Statistical analysis was performed by Mann–Whitney U‐test (n = 16 forWT and n = 14 for cfKO ).Representative images of Picrosirius red staining of infarcted heart at 7 days after
MI surgery. Images were taken by standard light (top) and polarized light microscopes. Scale bar indicates 100 μm. Polarized collagen fibers were sorted to orange‐red (middle) and green‐yellow (bottom) fibers by ImageJ software. Error bars represent mean ±SEM . Statistical analysis was performed by unpaired t‐test (two‐tailed) (n = 11 forWT and n = 13 for cfKO ).
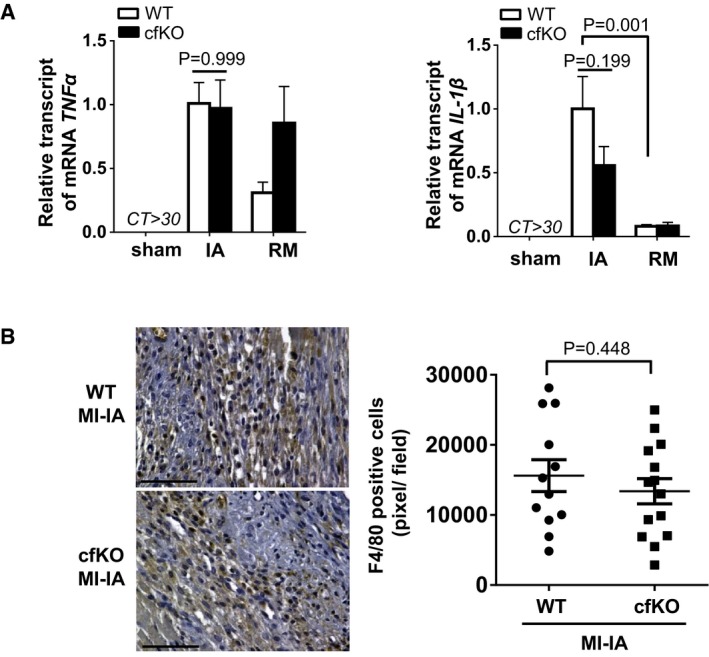
qPCR analysis ofTNF ‐α andIL ‐1βmRNA expression in heart tissues. The heart was harvested at 7 days after the surgery. Error bars represent mean ±SEM (n = 16 and 15 forWT and cfKO sham group, n = 15 and 14 forWT and cfKO MI group, respectively). Statistical analysis was performed by two‐wayANOVA . Post hoc test was performed by Tukey's test.Detection of macrophage by F4/80 staining (AbD Serotec, Clone A3‐1) in the ischemic myocardium of
WT and cfKO mice at day 7 afterMI .DAB substrate was used for detection. Counter staining was performed using hematoxylin stain. F4/80‐positive cell density in the infarcted area was measured as pixel at high magnification. Scale bar indicates 100 μm. Error bars represent mean ±SEM (n = 12 and 14 forWT and cfKO , respectively). Statistical analysis was performed by unpaired t‐test (two‐tailed).
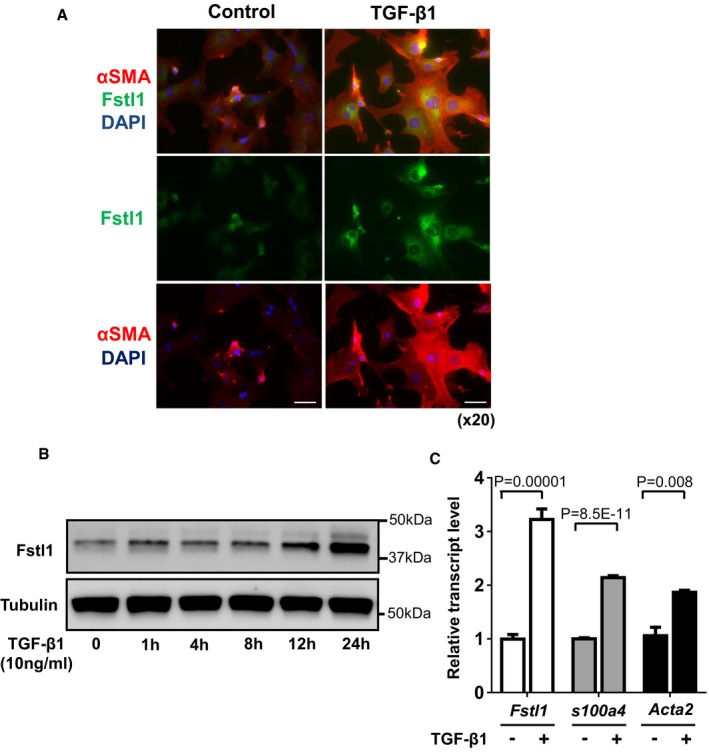
Immunofluorescence staining of Fstl1 (green) and α‐
SMA (red) inNRCF bs at 24 h after recombinantTGF ‐β1 (10 ng/ml) stimulation. Nuclei were stained byDAPI . Scale bar indicates 50 μm.Time course changes of Fstl1 protein expression in
NRCF bs after stimulation of recombinantTGF ‐β1 (10 ng/ml). Protein expression of Fstl1 was detected by immunoblotting. Tubulin was used as a loading control (n = 3 for each time point). Two independent experiments were performed.Transcript level of Fstl1, S100a4, and Acta2
mRNA inNRCF bs was determined byqPCR analysis. The samples were harvested at 24 h after stimulation with recombinantTGF ‐β1 (10 ng/ml) or control vehicle. Error bars represent mean ±SEM (Fstl1 and S100a4: n = 6 for each group, Acta2: n = 3 for each group). Statistical analysis was performed by unpaired t‐test (two‐tailed) for Fstl1 and S100a4, and nonparametric unpaired t‐test (two‐tailed) for Acta2. Two independent experiments were performed.
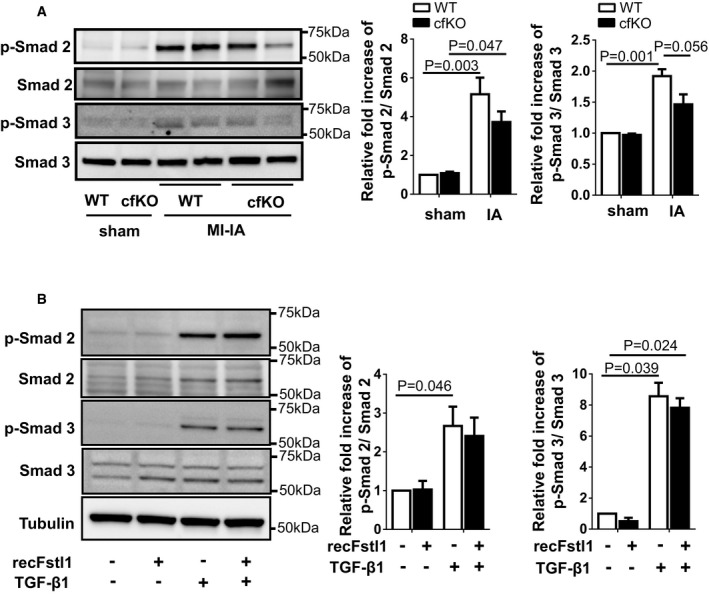
The expression of p‐Smad2, p‐Smad3, Smad2, and Smad3 in Fstl1‐cf
KO andWT hearts was assessed by immunoblotting. Hearts were harvested at 7 days after the surgery. Error bars represent mean ±SEM (n = 3 for each sham group and n = 4 for eachMI ‐IA group). Statistical analysis was performed by two‐wayANOVA . Post hoc test was performed by Tukey's test.The effect of recombinant Fstl1 protein on
TGF ‐β1‐stimulated Smad2/3 signaling pathway in neonatal cardiac fibroblasts (NRCF bs). Recombinant Fstl1 protein (50 ng/ml) or control vehicle was added to serum‐deprived (24 h)NRCF bs at 30 min prior toTGF ‐β1 protein (2 ng/ml) stimulation. Samples were harvested at 15 min afterTGF ‐β1 stimulation. Phosphorylation of Smad 2/3 and Smad 2/3 expression in cell lysates was assessed by immunoblotting. Tubulin was used for internal control. Error bars represent mean ±SEM (n = 3 for each group). Statistical analysis was performed by ordinary one‐wayANOVA and Tukey's test for Smad 2, Kruskal–Wallis test and Dunnett's T3 test for Smad 3. Three independent experiments were performed.
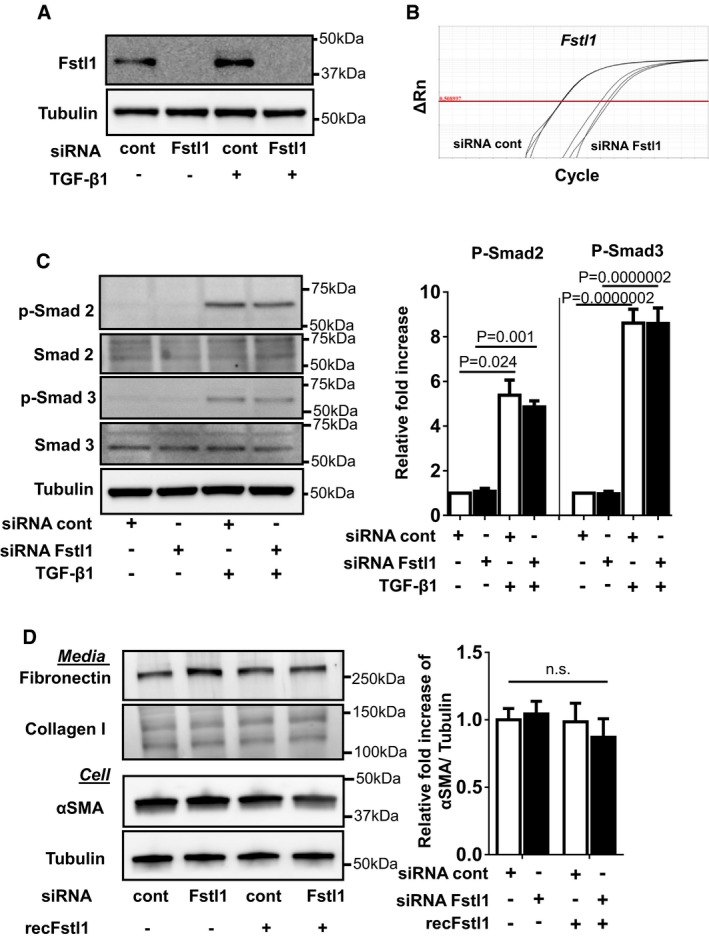
Fstl1 ablation by si
RNA Fstl1 (6 pmol) inNRCF bs. siRNA Fstl1 or siRNA non‐targeting negative control was transfected toNRCF bs by lipofectamineRNA imax for 12 h, followed by stimulation of recombinantTGF ‐β1 (10 ng/ml) for 24 h. Fstl1 protein expression in cell lysate was analyzed by immunoblotting.Efficiency of Fstl1 gene ablation by si
RNA Fstl1 (6 pmol) inNRCF bs. siRNA Fstl1 or siRNA non‐targeting negative control was transfected toNRCF bs by lipofectamineRNA imax for 42 h.mRNA transcripts of Fstl1 andGAPDH were assessed byqPCR . The amplification plots for Fstl1 are shown. The Ct values for Fstl1 in siRNA control and siRNA Fstl1 are 18.17 ± 0.053 and 24.76 ± 0.420, respectively (n = 3 for each sample group).Effect of endogenous Fstl1 protein on
TGF ‐β1‐induced Smad2/3 signaling pathway inNRCF bs. Endogenous Fstl1 protein was ablated by transfecting siRNA Fstl1 toNRCF bs. siRNA negative control was used for control. FollowingFBS starvation for 24 h, cells were stimulated with recombinantTGF ‐β1 protein (2 ng/ml) for 15 min. Phosphorylation of Smad2 and Smad3 was assessed by immunoblotting. Error bars represent mean ±SEM (n = 3 for each group). Statistical analysis was performed by ordinary one‐wayANOVA . Post hoc test was performed by Dunnett's T3 test for Smad2 and Tukey's test for Smad3. Two independent experiments were performed.Ablation of endogenous Fstl1 does not affect markers of myofibroblast differentiation or
ECM protein synthesis. Endogenous Fstl1 was ablated by siRNA , and followingFBS depletion for 24 h, cells were stimulated with recombinant Fstl1 protein (50 ng/ml) for 24 h. α‐SMA protein expression in cell lysate and fibronectin and collagen I protein in the cultured media were assessed by immunoblotting. Tubulin was used as an internal control. Error bars represent mean ±SEM (n = 4 for each group). Statistical analysis was performed by ordinary one‐wayANOVA and Tukey's test. Two independent experiments were performed.
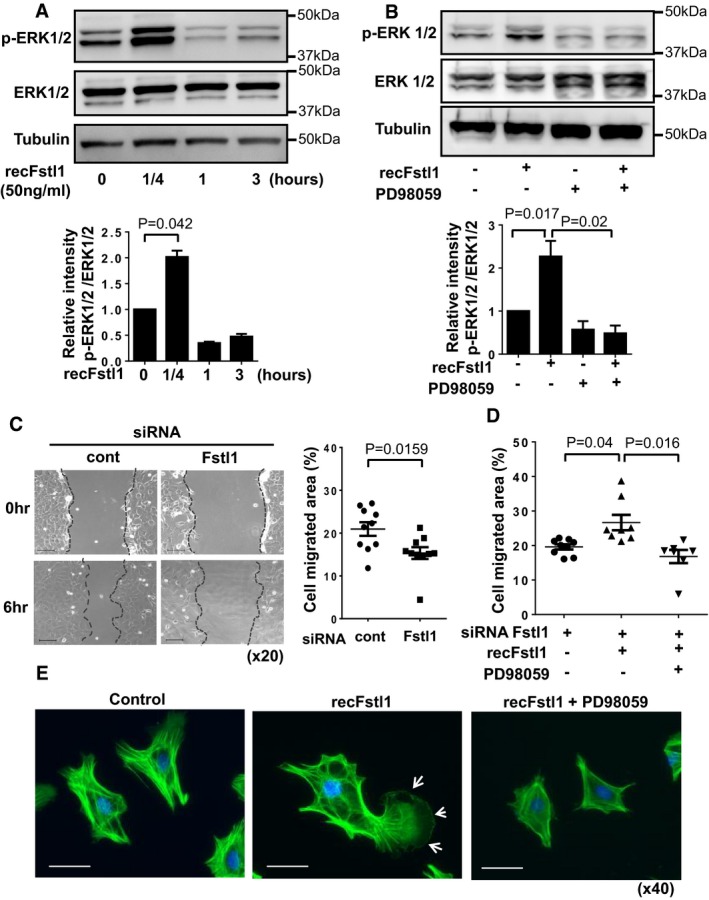
NRCF bs at passage 1 were stimulated with recombinant Fstl1 (50 ng/ml) or vehicle after cultured in serum‐reduced conditions (FBS 0.5%) for 24 h. The samples were harvested at the indicated time points after stimulation. The expression ofERK 1/2 and tubulin were detected by immunoblotting. Error bars represent mean ±SEM . Statistical analysis was performed by one‐wayANOVA and Tukey's multiple comparison test (n = 3 for each time point). Three independent experiments were performed.Fstl1 induced phosphorylation of
ERK 1/2 was ablated by pretreatment with ERK inhibitorPD 98059.NRCF bs were treated byPD 98059 (5 nM) for 30 min and then stimulated with recombinant Fstl1 protein (50 ng/ml) for 15 min. Error bars represent mean ±SEM . Statistical analysis was performed by one‐wayANOVA and Tukey's multiple comparison test (n = 3 for each time point). Two independent experiments were performed.Representative images of
NRCF bs scratch assay (left) and quantified cell migration (right).NRCF bs were transfected by Fstl1 siRNA or siRNA non‐targeting negative control for 12 h followed by culturing in 0.5%FBS media for 24 h. The confluent cell sheet was scratched and cell migration was assessed at 6 h after the scratch. Scale bar indicates 100 μm. Error bars represent mean ±SEM (n = 10 for each group). Statistical analysis was performed by unpaired t‐test (two‐tailed). Two independent experiments were performed.Fstl1 stimulation of cell migration was reversed by
PD 98059. Endogenous Fstl1 inNRCF bs was ablated by Fstl1 siRNA . Serum‐deprivedNRCF bs were treated withPD 98059 (5 nM) for 30 min and then stimulated by Fstl1 (50 ng/ml) or vehicle. Cell migration was assessed at 6 h after Fstl1 stimulation. Error bars represent mean ±SEM (n = 7–9 for each group). Statistical analysis was performed by Kruskal–Wallis test and Dunnett's T3 test. Two independent experiments were performed.Morphological changes of
NRCF bs after recombinant Fstl1 stimulation was assessed by immunocytochemistry. Twenty‐four‐hour serum‐starvedNRCF bs were stimulated by Fstl1 (50 ng/ml) or vehicle for 3 h.PD 98059 (5 nM) orDMSO was added 30 min prior to Fstl1 stimulation. Cells were stained with Alexa Fluor 488‐conjugated phalloidin antibody, and nuclei were stained byDAPI . Arrow shows lamellipodium of the cell. Scale bar indicates 50 μm.
- A, B
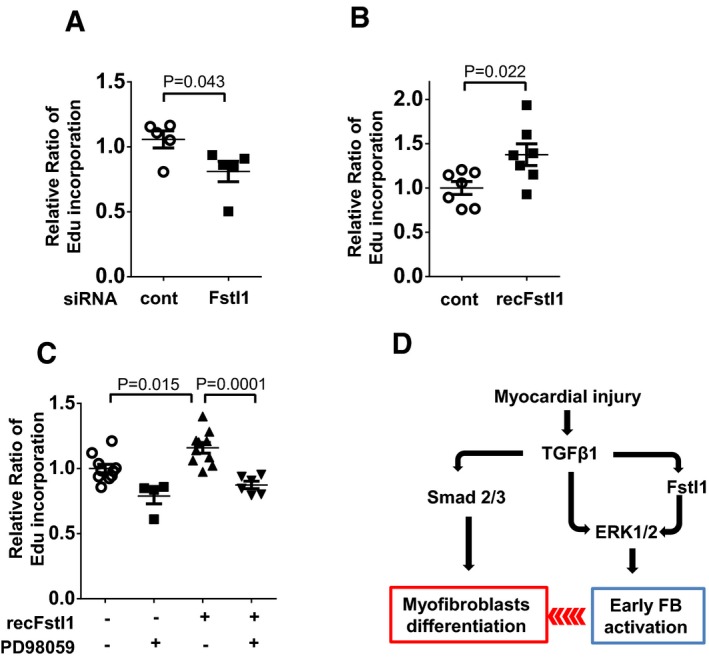
Fibroblast proliferation was assessed by Edu incorporation assay. Endogenous Fstl1 was ablated by si
RNA .NRCF bs were cultured in 0.5%FBS condition for 48 h to synchronize the cell cycle. EdU (10 μM as the final concentration) was added into media at 4 h before harvest. Error bars represent mean ±SEM (n = 5, each group). Statistical analysis was performed by unpaired t‐test (two‐tailed). Two independent experiments were performed. (B) Effect of exogenous Fstl1 on cardiac fibroblast proliferation. Cells were cultured inFBS 0.5% media for 24 h. Recombinant Fstl1 (50 ng/ml) or vehicle was added to 2%FBS ‐containing media and cultured for 48 h. EdU was added into media at 4 h before harvest. Error bars represent mean ±SEM (n = 7, each group). Statistical analysis was performed by unpaired t‐test (two‐tailed). Two independent experiments were performed. - C
Fstl1‐promoted fibroblast proliferation was diminished by
PD 98059.PD 98059 (5 nM) was added 30 min prior to recombinant Fstl1 stimulation (50 ng/ml). The cells were cultured for 48 h, and EdU was added into media at 4 h before harvest. Error bars represent mean ±SEM (n = 4–10, per treatment group). Statistical analysis was performed by one‐wayANOVA and Tukey's multiple comparison test. Two independent experiments were performed. - D
Schema of the role of Fstl1 in infarct repair. Fstl1 is upregulated by
TGF ‐β1 in infarcted heart, and it contributes to the proliferation and migration of fibroblasts into the infarcted site and border zone. These actions increase the number of myofibroblasts (MyoFB ) in the infarcted lesion. In turn, fibroblasts and myofibroblasts synthesizeECM components including collagens and fibronectin and protect the infarcted heart from rupture.
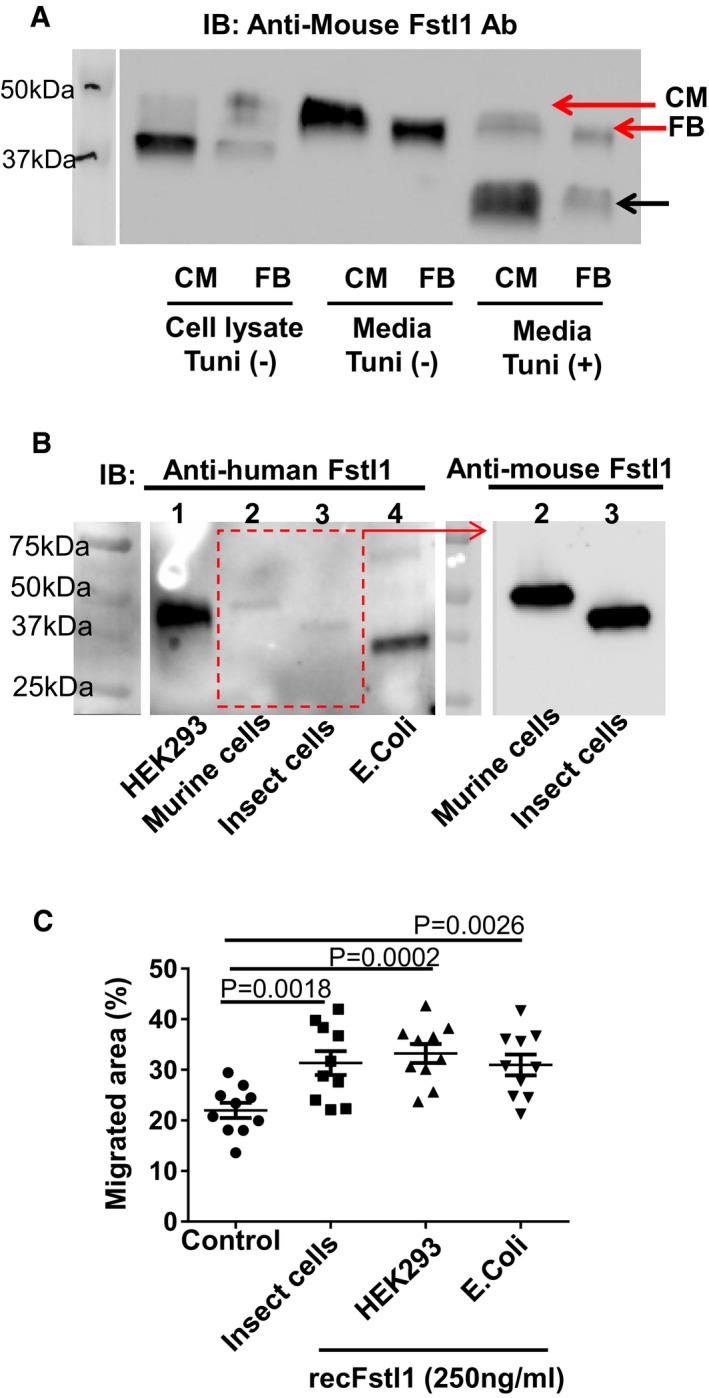
Western blot analysis of mouse Fstl1 protein in cell lysates and secreted from cardiomyocytes and cardiac fibroblasts. Neonatal rat cardiomyocytes and cardiac fibroblasts were infected with adenovirus encoding mouse Fstl1 (50
MOI ) for 24 h. Culture media was changed fromFBS 10% containedDMEM /F‐12 to 0%FBS forCM and 0.5%FBS for FB. Cells were cultured with or without tunicamycin (1 μg/ml) for 16 h. Conditioned media was concentrated by Amicon Ultra filter 10k device (14,000× g, 10 min). Mouse Fstl1 protein was detected by Western blotting.Molecular size of multiple Fstl1 recombinant proteins was assessed by Western blotting. Detailed information for each recombinant protein is listed in Table EV5. Equal amount of proteins (5 ng/lane) were loaded to 4–12%
TGX gel and transferred toPVDF membrane. Fstl1 proteins were detected using human and mouse Fstl1 polyclonal antibodies (both from R&D Systems).Bioactivity of Fstl1 recombinant proteins from different cell sources was assessed using a cardiac fibroblast migration assay. This scratch assay was performed as described in the main manuscript. Error bars represent mean ±
SEM (n = 10 for each group). Statistical analysis was performed by ordinary one‐wayANOVA and Fisher'sLSD test for post hoc analysis.
References
-
- Becker RC, Gore JM, Lambrew C, Weaver WD, Rubison RM, French WJ, Tiefenbrunn AJ, Bowlby LJ, Rogers WJ (1996) A composite view of cardiac rupture in the United States National Registry of Myocardial Infarction. J Am Coll Cardiol 27: 1321–1326 - PubMed
-
- van den Borne SW, van de Schans VA, Strzelecka AE, Vervoort‐Peters HT, Lijnen PM, Cleutjens JP, Smits JF, Daemen MJ, Janssen BJ, Blankesteijn WM (2009) Mouse strain determines the outcome of wound healing after myocardial infarction. Cardiovasc Res 84: 273–282 - PubMed
-
- Clement DL, Mally S, Stock C, Lethan M, Satir P, Schwab A, Pedersen SF, Christensen ST (2013) PDGFRalpha signaling in the primary cilium regulates NHE1‐dependent fibroblast migration via coordinated differential activity of MEK1/2‐ERK1/2‐p90RSK and AKT signaling pathways. J Cell Sci 126: 953–965 - PMC - PubMed
MeSH terms
Substances
Grants and funding
LinkOut - more resources
Full Text Sources
Other Literature Sources
Medical
Molecular Biology Databases
Research Materials
Miscellaneous
