. 2016 Aug;132(2):289-307.
doi: 10.1007/s00401-016-1583-8. Epub 2016 May 28.

The importance of nerve microenvironment for schwannoma development

Affiliations

The importance of nerve microenvironment for schwannoma development

Alexander Schulz et al. Acta Neuropathol. 2016 Aug.

Abstract

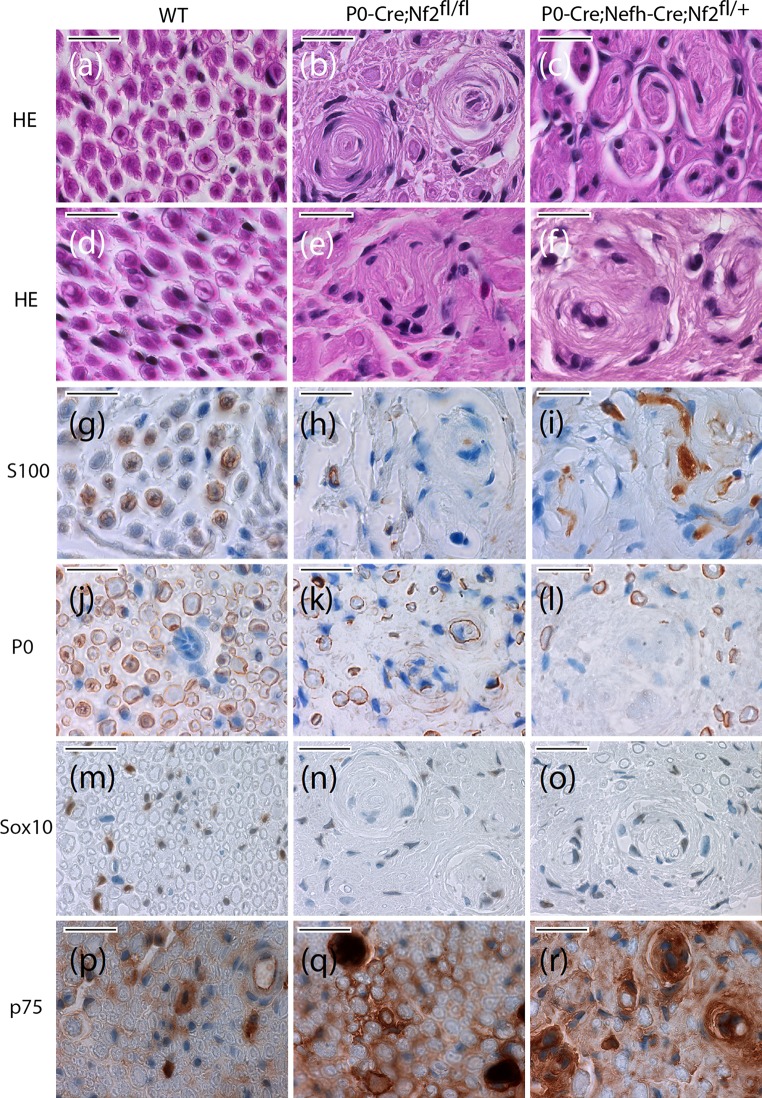
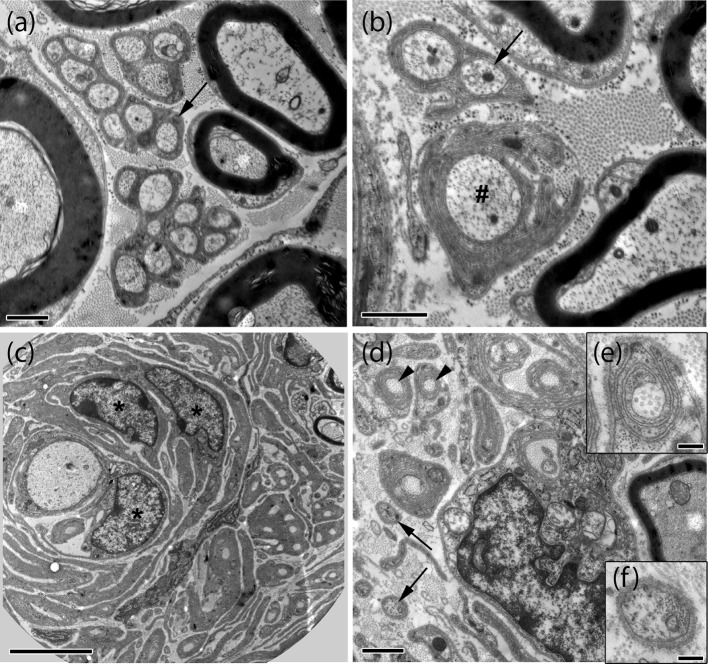
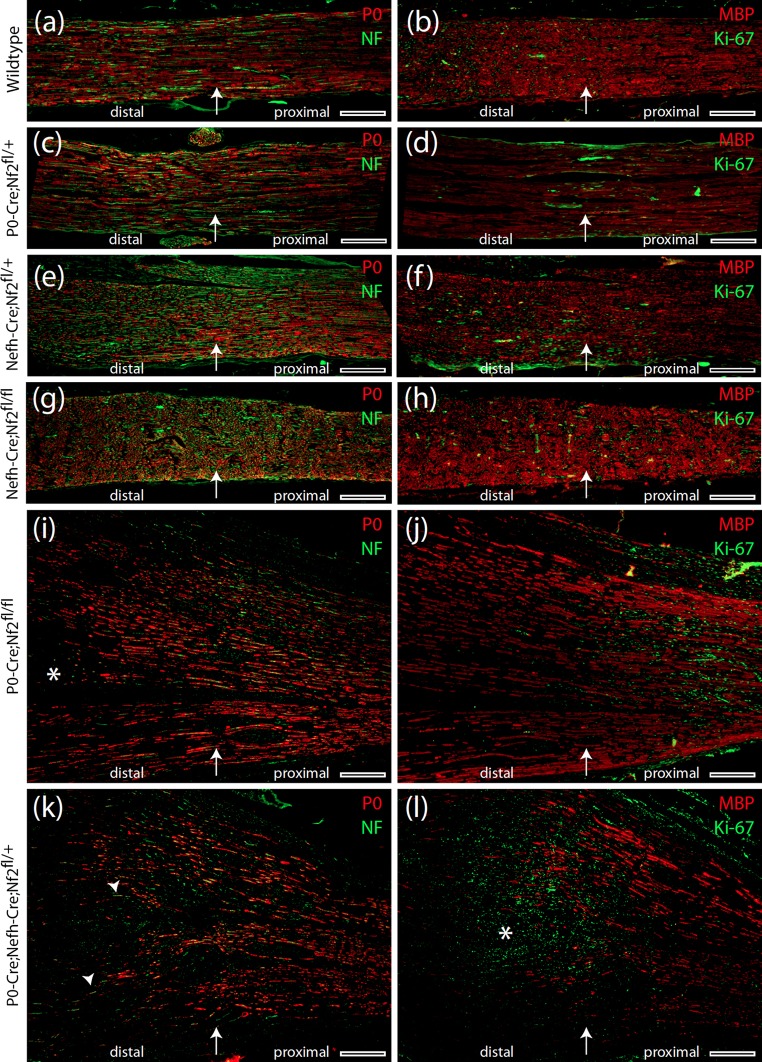
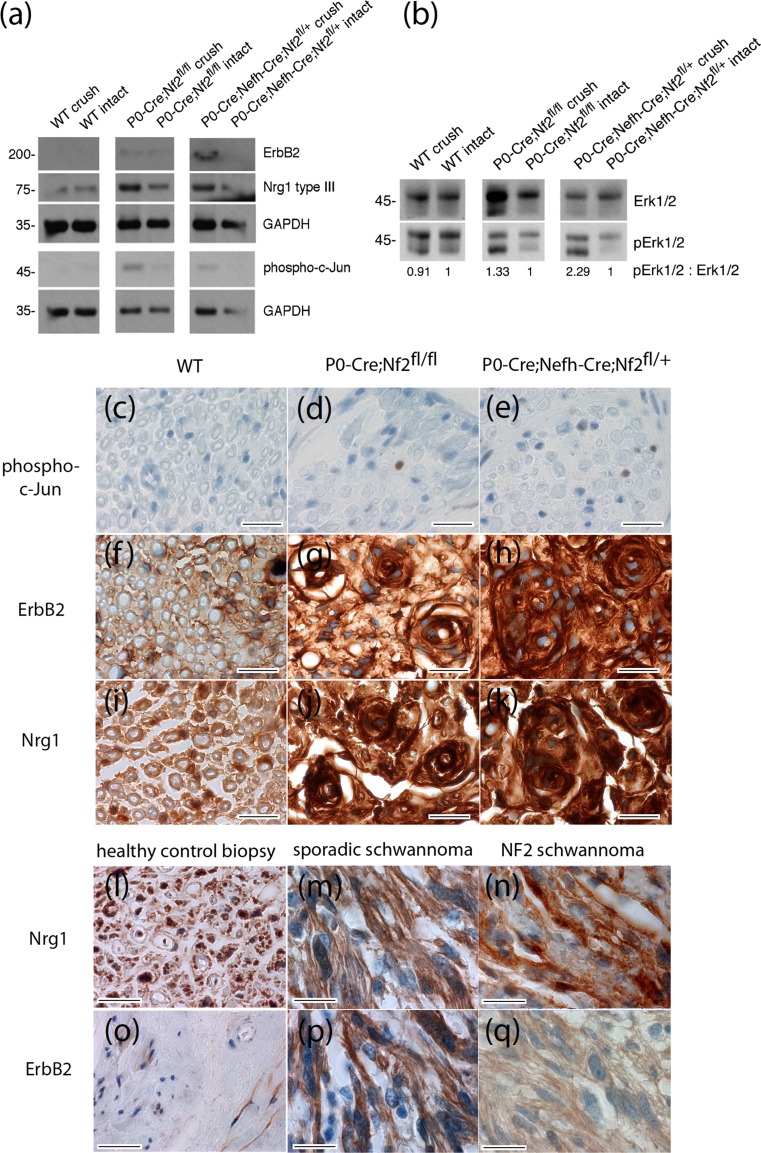
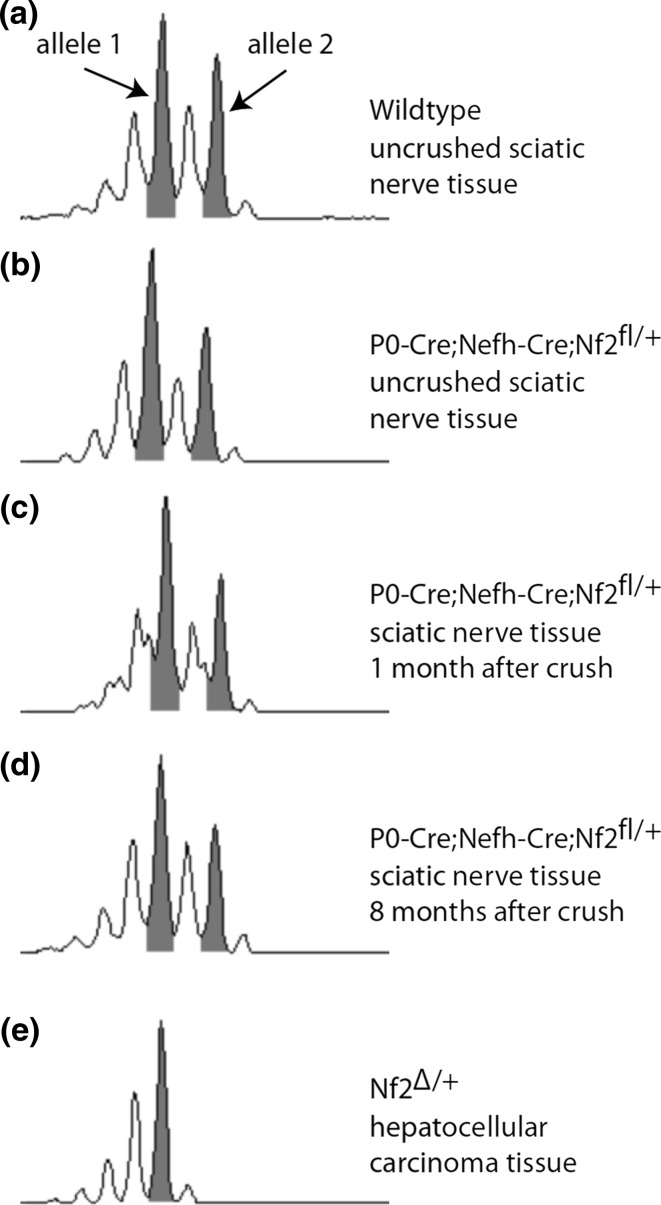
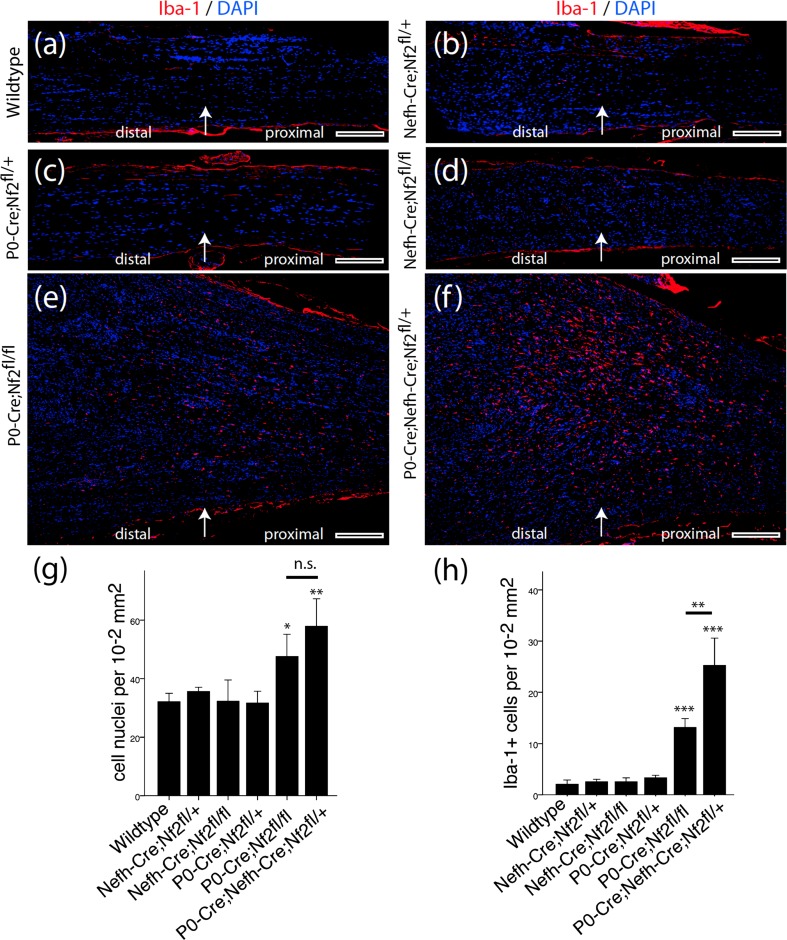
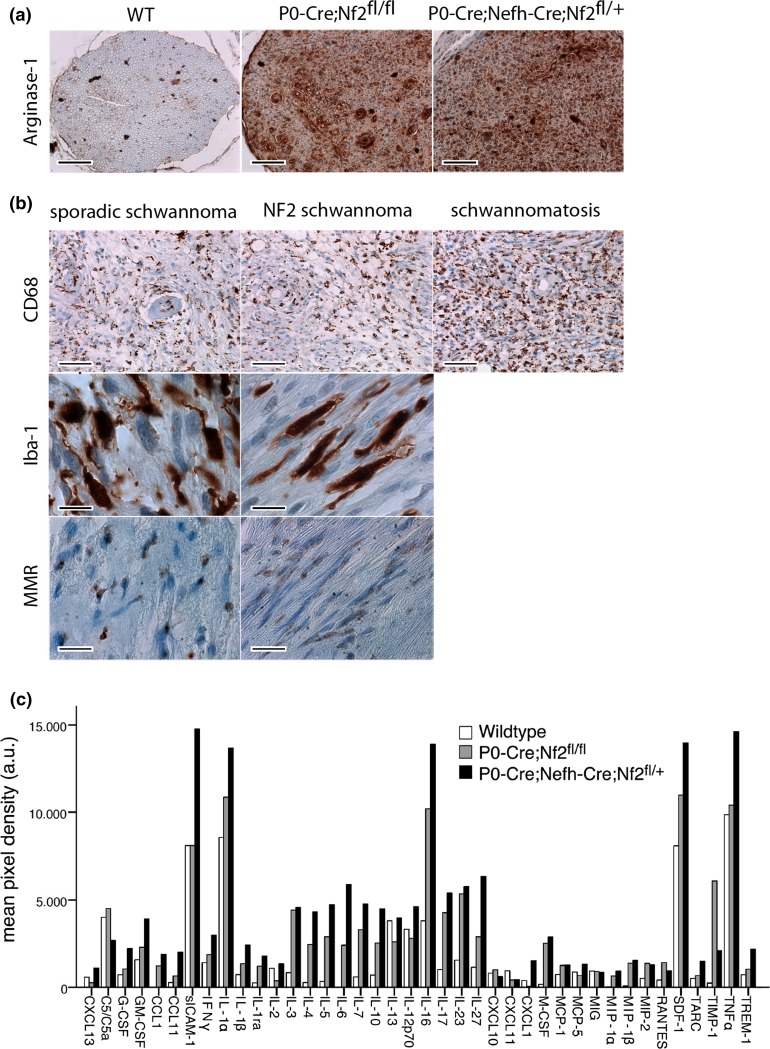
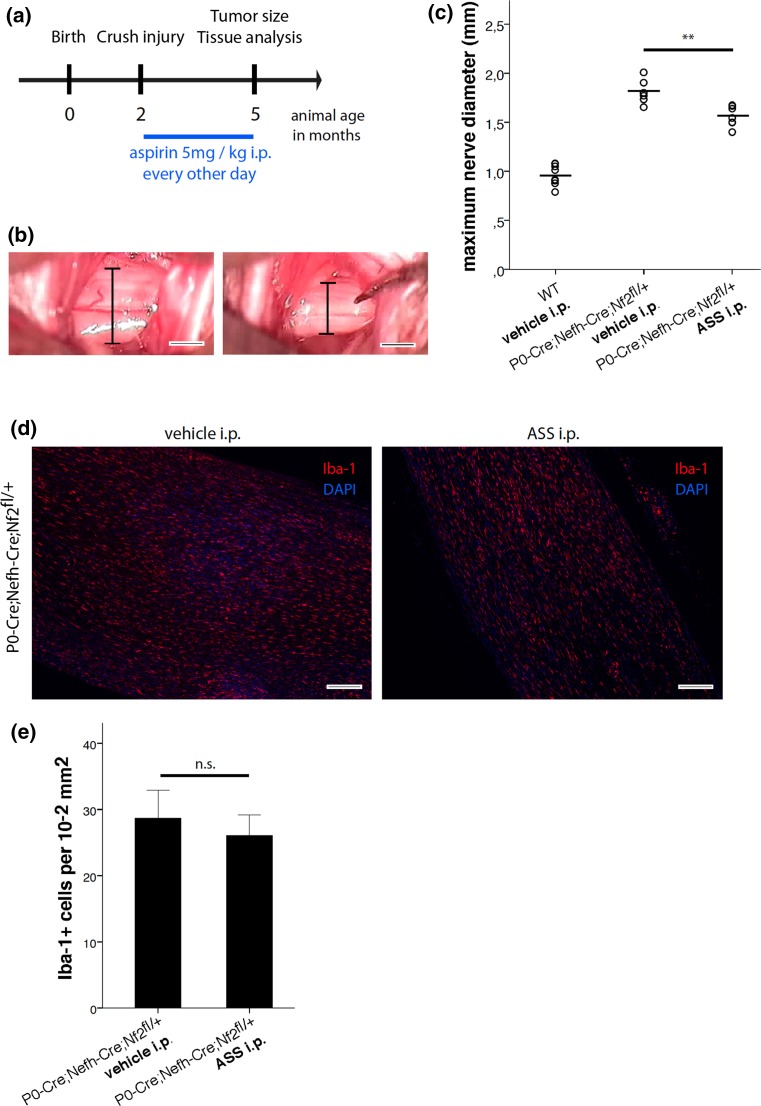
Schwannomas are predominantly benign nerve sheath neoplasms caused by Nf2 gene inactivation. Presently, treatment options are mainly limited to surgical tumor resection due to the lack of effective pharmacological drugs. Although the mechanistic understanding of Nf2 gene function has advanced, it has so far been primarily restricted to Schwann cell-intrinsic events. Extracellular cues determining Schwann cell behavior with regard to schwannoma development remain unknown. Here we show pro-tumourigenic microenvironmental effects on Schwann cells where an altered axonal microenvironment in cooperation with injury signals contribute to a persistent regenerative Schwann cell response promoting schwannoma development. Specifically in genetically engineered mice following crush injuries on sciatic nerves, we found macroscopic nerve swellings in mice with homozygous nf2 gene deletion in Schwann cells and in animals with heterozygous nf2 knockout in both Schwann cells and axons. However, patient-mimicking schwannomas could only be provoked in animals with combined heterozygous nf2 knockout in Schwann cells and axons. We identified a severe re-myelination defect and sustained macrophage presence in the tumor tissue as major abnormalities. Strikingly, treatment of tumor-developing mice after nerve crush injury with medium-dose aspirin significantly decreased schwannoma progression in this disease model. Our results suggest a multifactorial concept for schwannoma formation-emphasizing axonal factors and mechanical nerve irritation as predilection site for schwannoma development. Furthermore, we provide evidence supporting the potential efficacy of anti-inflammatory drugs in the treatment of schwannomas.

Keywords: Crush injury, tissue inflammation; Microenvironment; NF2; Neurofibromatosis type 2; Schwannoma; Sciatic nerve; Tumor induction.


Figures

Fig. 1
Fig. 1
Macroscopic analysis of nerve morphology 8 months after crush injury. a Schematic representation of the study protocol. b, c Representative images of one mouse 8 months after crush injury, indicating a relieving posture of the right hind limb (arrow) bearing the injured sciatic nerve when gently lifted at its tail. df T2-weighted coronal (d) and sagittal (e, f) MR images from a P0-Cre;Nefh-Cre;Nf2fl/+ mouse 7 months after sciatic nerve crush. d Asterisks show the position of the left (uninjured) and right (crushed) sciatic nerve. Arrowhead indicates the spinal cord and hash marks the urine-filled bladder. Arrow in e, f depicts the anatomical course of the sciatic nerve close to the femur. The injured right sciatic nerve shows enlargement compared to the non-injured sciatic nerve on the left side. gl Dissected sciatic nerves from 10-month-old mice of indicated genotypes are shown. Crushed nerves (8 months post-injury) are shown at the top; intact nerves are depicted at the bottom of each representative image. Proximal nerve parts are on the right side of the images; distal parts on the left side. Scale bars represent 3 mm. m Quantification of macroscopic nerve swellings following nerve crush injury. A nerve swelling was counted when the nerve radius was at least doubled
Fig. 2
Fig. 2
Appearance of schwannoma-like structures and tumorlets in nerves from P0-Cre;Nefh-Cre;Nf2fl/+ mice. al Sciatic nerve cross sections of indicated genotypes 8 months after crush injury were either HE stained (af), or immunolabeled (brown color), for Schwann cell markers S100 (gi) and P0 (jl), as well as neural-crest marker Sox10 (mo) and p75 as indicator for immature non-myelinating Schwann cells (pr). Cell nuclei are visualized in blue. Scale bar represents 20 μm
Fig. 3
Fig. 3
Electron microscopy reveals multiple signs of degeneration in crushed and uncrushed nerves of P0-Cre;Nefh-Cre;Nf2fl/+ mice. Representative electron microscopic images of intact (a, b) and crushed (cf) sciatic nerves (8 months post-injury) taken from P0-Cre;Nefh-Cre;Nf2fl/+ mice. While myelinated axons and Remak bundles of various size (arrows in a, b) are frequent in intact nerves, myelinated axons and Remak bundles appear rarely in crushed nerves (c, d). Non-myelinated axons were mostly seen as single axons (arrows in d, f). Signs of degeneration such as collagen pockets (arrowhead in d, e), abnormally thin myelin sheath and layers of Schwann cell processes enwrapping axons (c), bands of Bungner and axons with irregular myelin sheaths (hash in b) were mostly present in crushed, but, to a minor extent, also in intact nerves. In addition, accumulations of Schwann cells could be observed (asterisks in c). Scale bars in a, b, d represent 1 μm. Scale bar in c 5 μm. Scale bars in e, f represent 0.2 μm
Fig. 4
Fig. 4
Severe re-myelination defect in P0-Cre;Nefh-Cre;Nf2fl/+ mice following nerve crush. al Immunohistochemical stainings of longitudinal sciatic nerve sections prepared from indicated genotypes 8 months after crush injury. Immunolabeling of P0, neurofilaments, MBP and Ki-67 indicates Schwann cell differentiation, axonal fibres, myelination and cell proliferation, respectively. Arrow in each image shows the position of the nerve crush. Orientation of nerves is stated as ‘distal’ and ‘proximal’. Asterisk in i emphasizes an area of defective re-myelination. Arrowheads in k indicate axons devoid of any myelin sheath. Asterisk in l marks concentration of Ki-67-positive cells at the edge of intact myelination. Scale bars represent 200 μm
Fig. 5
Fig. 5
Signaling and protein expression changes in sciatic nerve lysates. a, b Immunoblot of sciatic nerve lysates (pooled tissue from at least three different animals per indicated genotype was prepared from crushed and intact sciatic nerves 8 months after crush injury). a Immunoblot for receptor tyrosine kinase ErbB2, Neuregulin 1 type III (Nrg1 type III), phospho-c-Jun and GAPDH as loading control (n = 3). For full-length blot see Supplementary Fig. 9. b Immunoblot for phospho-Erk1/2 (pErk1/2). Total protein amount of Erk1/2 served as loading control. Densitometric quantification of pErk1/2: Erk1/2 ratio was normalized to intact nerve tissue for each genotype (n = 3). The observed increase in total Erk after crush injury in some genotypes (see also Supplementary Fig. 10) remains unexplained but does not effect the ratio between phospho-Erk and overall Erk. For full-length blot see Supplementary Fig. 10. ck Sciatic nerve cross sections of indicated genotypes 8 months after crush injury were immunolabeled (brown color) for phospho-c-Jun, as a marker of cellular de-differentiation (ce), ErbB2 (fh) and Neuregulin 1 (ik). Cell nuclei are visualized in blue. Scale bars represent 20 μm. lq Human tissue sections taken from healthy sural nerve biopsies, as well as sporadic and NF2-associated schwannomas, were immunolabeled (brown color) for Neuregulin 1 (ln) and ErbB2 (oq). Cell nuclei are visualized in blue. Scale bars represent 20 μm
Fig. 6
Fig. 6
LOH of nf2 gene is dispensable for schwannoma formation. ae Microsatellite analysis of genomic DNA using a polymorphic marker in intron 5 of the murine nf2 gene. Pooled DNA from at least three sciatic nerves per indicated genotype was used to detect loss of heterozygosity. Tissue from hepatocellular carcinoma of Nf2Δ/+ mice was used as positive control for LOH. Grey highlighted peaks represent the two gene alleles
Fig. 7
Fig. 7
Sustained inflammatory response after nerve crush in P0-Cre;Nefh-Cre;Nf2fl/+ mice. af Longitudinal sciatic nerve sections were prepared from indicated genotypes 8 months after crush injury and immunohistochemically stained for the macrophage marker Iba-1 (red). DAPI counterstaining indicates cell nuclei (blue). Arrow in each image shows the position of the nerve crush. Orientation of nerves is stated as ‘distal’ and ‘proximal’. Scale bars represent 200 μm. g Quantification of cellular density in nerve tissue 8 months after crush injury, as measured by the number of DAPI-positive cell nuclei per area of tissue (one-way ANOVA analysis: ***P < 0.001; TMCT comparisons are depicted in the graph: *P < 0.05; **P < 0.01; n.s. not significant; n = 3 nerves per genotype; mean ± SD). h Quantification of Iba-1-positive cells in nerve tissue 8 months after crush injury (one-way ANOVA analysis: ***P < 0.001; TMCT comparisons are depicted in the graph: **P < 0.01; ***P < 0.001; n = 3 nerves per genotype; mean ± SD)
Fig. 8
Fig. 8
Appearance of M2-type macrophages in merlin-deficient nerves after crush injury and human schwannoma samples. a Representative images of sciatic nerve cross sections from indicated genotypes. Immunolabeling of Arginase-1 as a marker for M2-type macrophages shows strong expression in P0-Cre;Nf2fl/fl and P0-Cre;Nefh-Cre;Nf2fl/+ mice, in comparison to wild-type (WT) littermates. Scale bars represent 100 μm. b Representative images of human schwannoma samples from a tissue microarray. Immunostainings against macrophage markers CD68 and Iba-1, as well as M2-type macrophage marker MMR/CD206, indicate macrophage occurence in sporadic, NF2-associated and Schwannomatosis-associated schwannomas. Scale bars represent 50 μm (upper panel), 10 μm (middle panel) and 20 μm (lower panel), respectively. c Cytokine levels in pooled lysates of at least four individual sciatic nerves per indicated genotype (n = 2). Densitometric quantification is shown as median value. For full-length blots see Supplementary Fig. 13
Fig. 9
Fig. 9
Systemic aspirin administration decreases schwannoma progression in P0-Cre;Nefh-Cre;Nf2fl/+ mice. a Schematic representation of the aspirin (ASS) treatment protocol. b Representative images showing the method for in situ tumor size quantification. The crushed sciatic nerve was exposed surgically in order to assess the maximum sciatic nerve diameter following as indicator for tumor size. c Quantification of maximum sciatic nerve diameters in wild type (WT) and P0-Cre;Nefh-Cre;Nf2fl/+ mice, 3 months after crush injury. Mice received systemic administration of either medium-dose aspirin (5 mg per kg ASS i.p.) or vehicle (**P < 0.01; n = 7 mice per genotype; mean ± SD). d Longitudinal sciatic nerve sections were prepared from vehicle or aspirin-treated P0-Cre;Nefh-Cre;Nf2fl/+ mice 3 months after crush injury and immunohistochemically stained for the macrophage marker Iba-1 (red). DAPI counterstaining indicates cell nuclei (blue). Scale bars represent 200 μm. e Quantification of Iba-1-positive cells nerve tissue 3 months after crush injury, taken from aspirin and vehicle-treated P0-Cre;Nefh-Cre;Nf2fl/+ mice (n.s. not significant; n = 3 nerves per genotype; mean ± SD)

References

    1. Allavena P, Mantovani A. Immunology in the clinic review series; focus on cancer: tumour-associated macrophages: undisputed stars of the inflammatory tumour microenvironment. Clin Exp Immunol. 2012;167:195–205. doi: 10.1111/j.1365-2249.2011.04515.x. - DOI - PMC - PubMed
    1. Antinheimo J, Sankila R, Carpen O, Pukkala E, Sainio M, Jaaskelainen J. Population-based analysis of sporadic and type 2 neurofibromatosis-associated meningiomas and schwannomas. Neurology. 2000;54:71–76. doi: 10.1212/WNL.54.1.71. - DOI - PubMed
    1. Atit RP, Crowe MJ, Greenhalgh DG, Wenstrup RJ, Ratner N. The Nf1 tumor suppressor regulates mouse skin wound healing, fibroblast proliferation, and collagen deposited by fibroblasts. J Invest Dermatol. 1999;112:835–842. doi: 10.1046/j.1523-1747.1999.00609.x. - DOI - PMC - PubMed
    1. Bauder AR, Ferguson TA. Reproducible mouse sciatic nerve crush and subsequent assessment of regeneration by whole mount muscle analysis. J Vis Exp JoVE. 2012 - PMC - PubMed
    1. Boin A, Couvelard A, Couderc C, Brito I, Filipescu D, Kalamarides M, Bedossa P, De Koning L, Danelsky C, Dubois T, et al. Proteomic screening identifies a YAP-driven signaling network linked to tumor cell proliferation in human schwannomas. Neuro-oncology. 2014;16:1196–1209. doi: 10.1093/neuonc/nou020. - DOI - PMC - PubMed

Publication types

LinkOut - more resources