. 2016 Jun 8;19(6):837-48.
doi: 10.1016/j.chom.2016.05.002. Epub 2016 May 26.

Trypanosoma brucei Parasites Occupy and Functionally Adapt to the Adipose Tissue in Mice

Affiliations

Trypanosoma brucei Parasites Occupy and Functionally Adapt to the Adipose Tissue in Mice

Sandra Trindade et al. Cell Host Microbe. .

Abstract

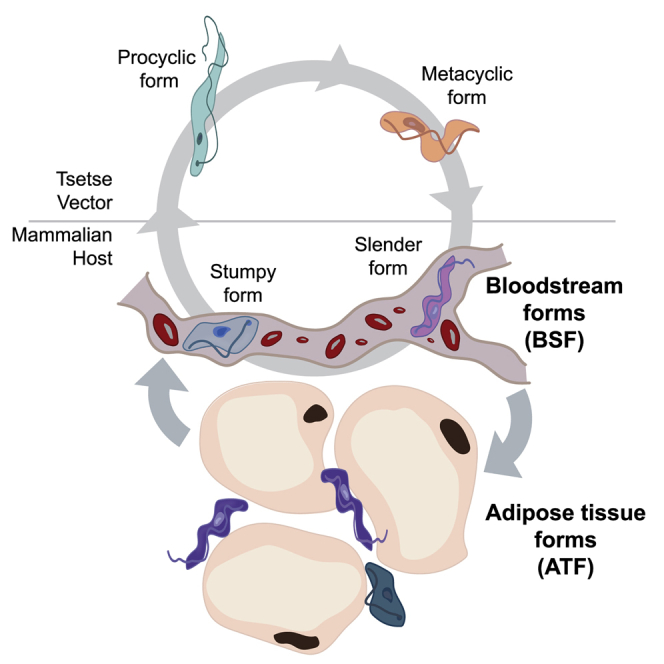
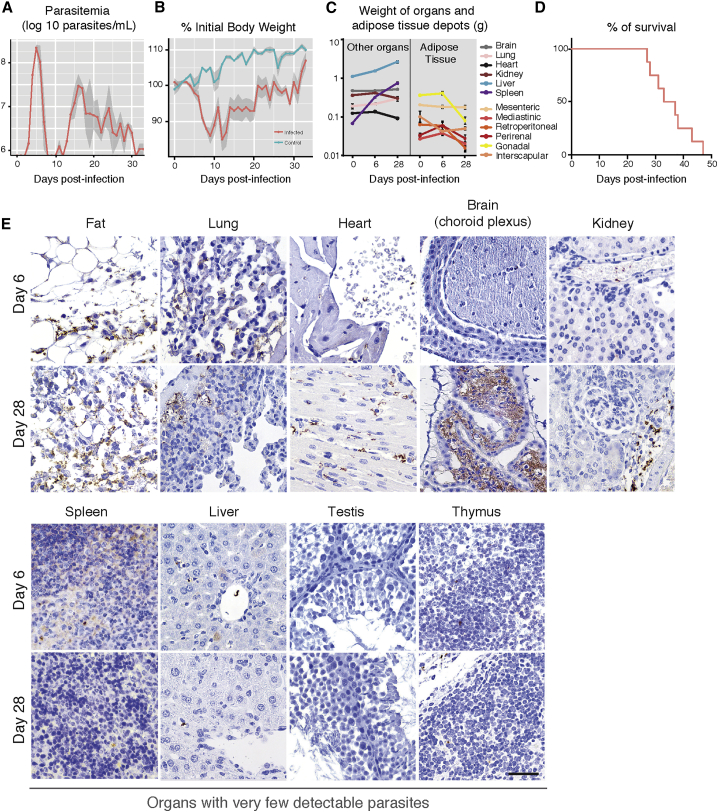
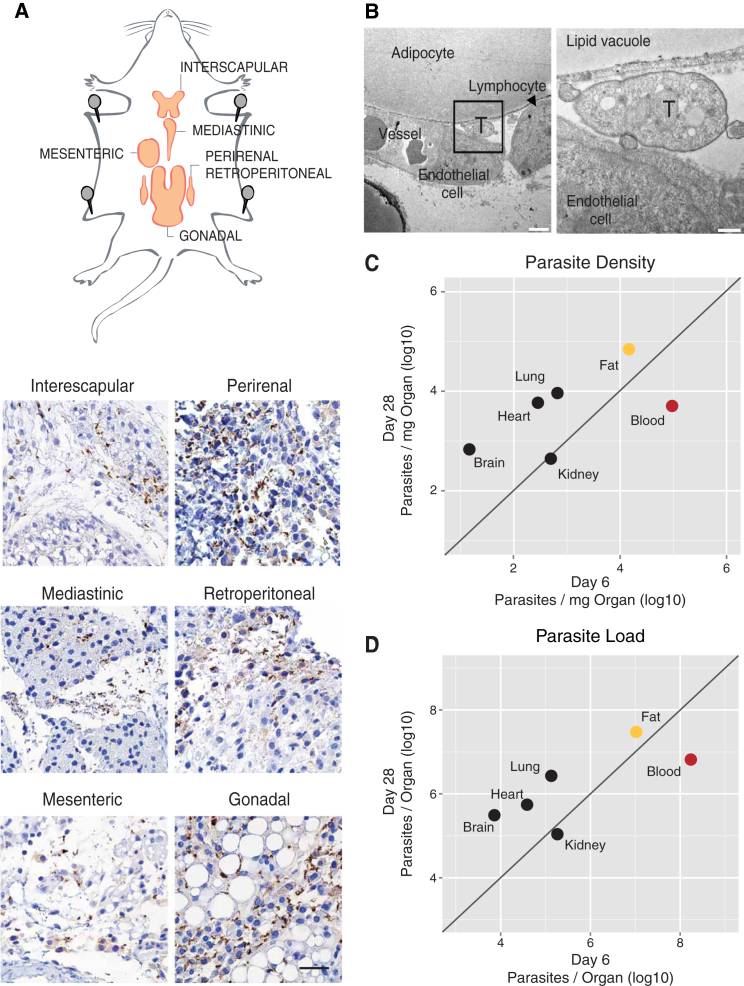
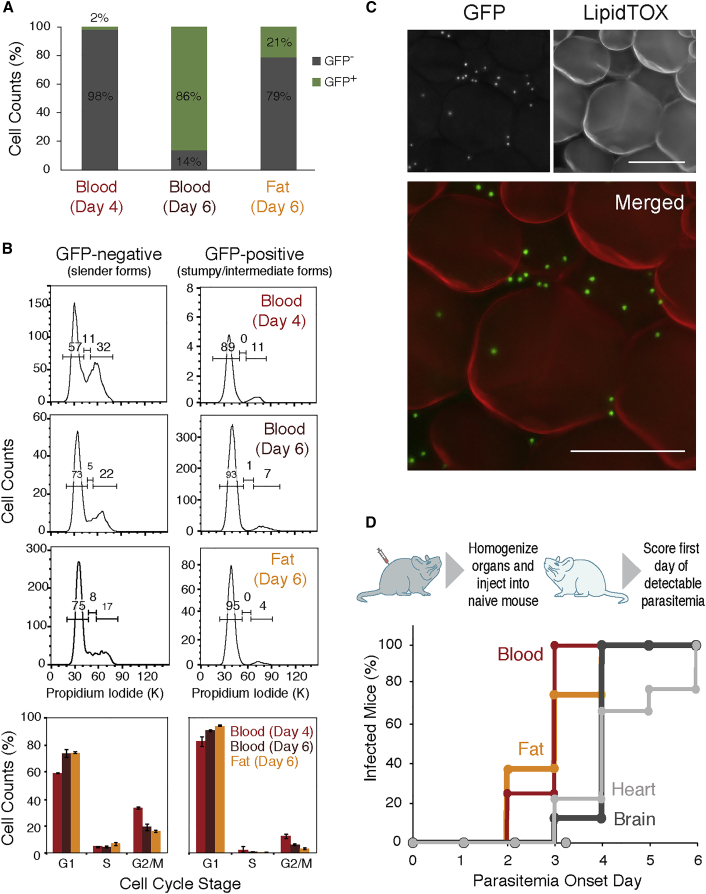
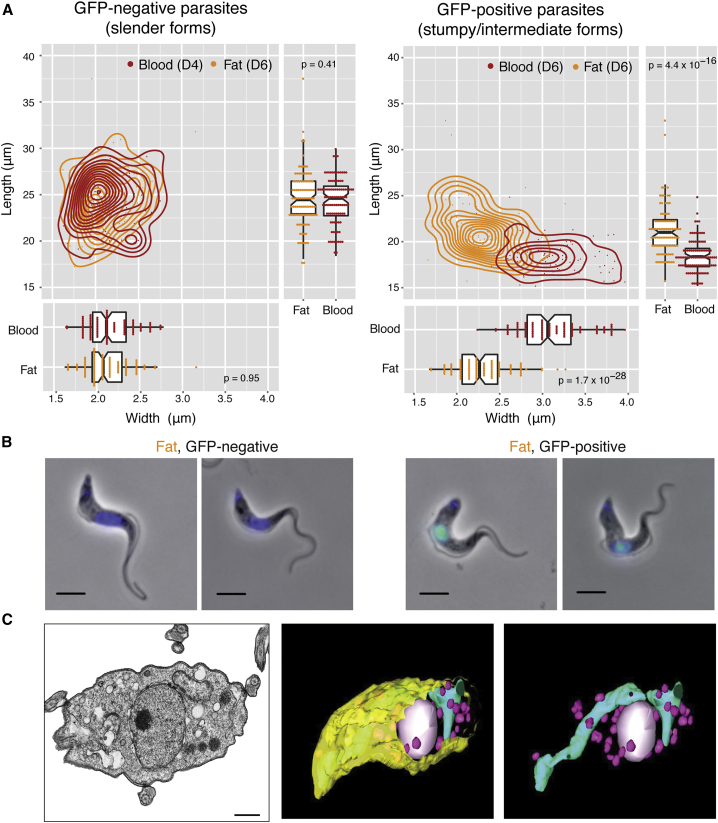
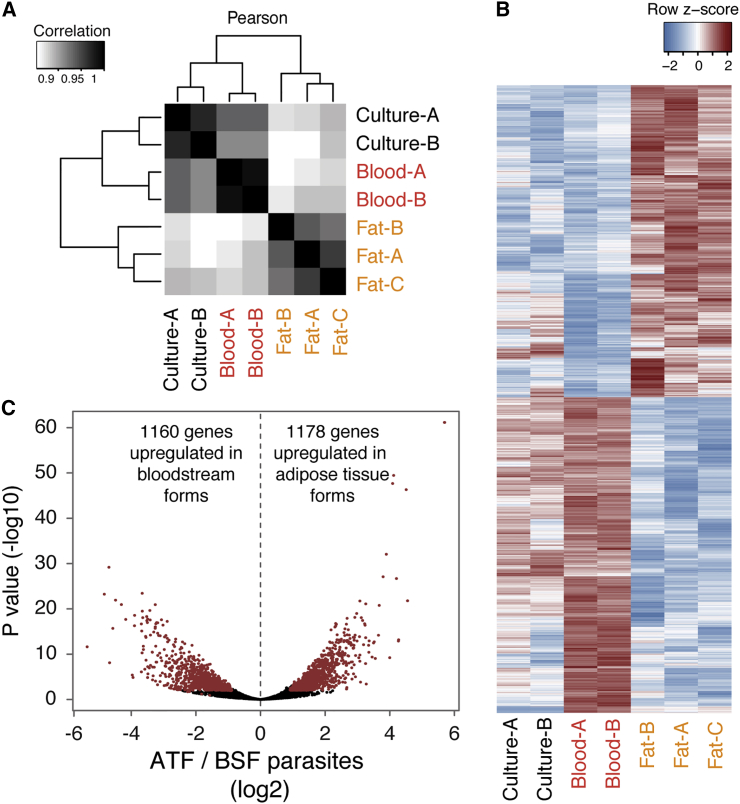
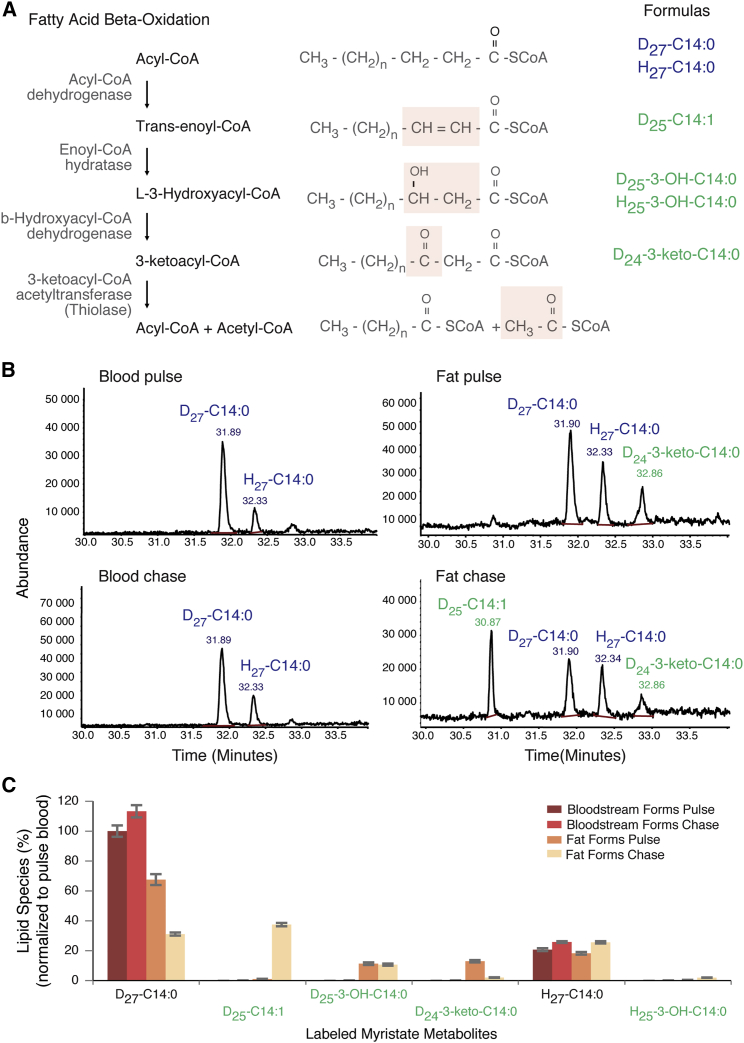
Trypanosoma brucei is an extracellular parasite that causes sleeping sickness. In mammalian hosts, trypanosomes are thought to exist in two major niches: early in infection, they populate the blood; later, they breach the blood-brain barrier. Working with a well-established mouse model, we discovered that adipose tissue constitutes a third major reservoir for T. brucei. Parasites from adipose tissue, here termed adipose tissue forms (ATFs), can replicate and were capable of infecting a naive animal. ATFs were transcriptionally distinct from bloodstream forms, and the genes upregulated included putative fatty acid β-oxidation enzymes. Consistent with this, ATFs were able to utilize exogenous myristate and form β-oxidation intermediates, suggesting that ATF parasites can use fatty acids as an external carbon source. These findings identify the adipose tissue as a niche for T. brucei during its mammalian life cycle and could potentially explain the weight loss associated with sleeping sickness.

Keywords: African trypanosomes; fat; fatty acid β-oxidation; metabolism; mouse infection; transcriptome.


Figures

None
Graphical abstract
Figure 1
Figure 1
Tissue Distribution of T. brucei during a Mouse Infection Is Heterogeneous (A) Mean parasitemia profile of 20 mice infected with T. brucei AnTat1.1E. Parasitemia was assessed from tail blood using a hemocytometer (limit of detection is around 4 × 105 parasites/mL). Light gray shaded area represents SEM. (B) Variation of body weight during infection. Daily body weight measurement of control and infected mice (n = 15 per group). Light gray shaded area represents SEM. (C) Variation of organ weight during infection (n = 4 per group). (D) Survival curve of T. brucei infected mice (n = 8). (E) Representative brightfield micrographs of T. brucei distribution in several organs/tissues at days 6 and 28 post-infection, assessed by immunohistochemistry with a non-purified rabbit anti-VSG antibody (parasites appear in brown). n = 5 per time point. Scale bar, 50 μm. See also Figures S1 and S2.
Figure 2
Figure 2
Fat Depots Are a Major Parasite Reservoir (A) Schematic representation of mice fat depots and anti-VSG immunohistochemistry images of six different fat depots, collected 28 days post-infection. Scale bar, 50 μm. (B) Transmission electron micrograph of a gonadal fat depot 6 days post-infection. Trypanosome (T) and lymphocyte in the interstitial space, adjacent to an adipocyte and next to a small capillary. Scale bars, 2 and 0.5 μm in the left and right panels, respectively. (C) Parasite density in multiple organs/tissues (6 and 28 days post-infection) was measured by qRT-PCR of gDNA (quantification of T. brucei 18s rDNA relative to the tissue/organ weight). Blood density was assumed 1.05 g/mL. Fat value is the average of quantification of the six depots indicated in (A). Each point represents the geometric mean of the parasite density on days 6 (n = 3–9) and 28 post-infection (n = 3–6). (D) Parasite load in multiple organs/tissues estimated by multiplying parasite density with organ weight at the corresponding day of infection. Each point represents the geometric mean of the parasite density on days 6 (n = 3–9) and 28 post-infection (n = 3–6). See also Figures S1–S3.
Figure 3
Figure 3
Fat Harbors Replicative Forms that Can Establish a New Infection (A) Frequency of GFP expression measured by flow cytometry in parasites isolated from blood and fat, 4 and 6 days post-infection with a GFP::PAD1utrT. brucei reporter cell line (n = 2–3). (B) Cell-cycle analysis assayed by flow cytometry of propidium iodide-stained parasites (n = 2–3). The values represented are the means of the percentage of the cell population in each cell-cycle stage and their SEM. (C) Fluorescence microscopy of gonadal adipose tissue from a mouse infected for 6 days with GFP::PAD1utr reporter cell line. Lipid droplets were stained with LipidTOX (red), and nuclei of GFP-expressing parasites (stumpy and/or intermediate forms) are green. Scale bar, 50 μm. (D) Onset of parasitemia curves in mice that were injected intraperitoneally with infected organs/tissues lysates from a donor mouse. Lysates from blood, heart, brain, and gonadal fat depot were prepared from mice sacrificed between 21 and 28 days post-infection to ensure presence of a larger number of parasites (n = 9). See also Figure S4.
Figure 4
Figure 4
Fat Is Populated by Slender, Intermediate, and Stumpy Forms (A) Morphological features (length and width) of fixed parasites isolated from fat and blood of mice infected with GFP::PAD1utr reporter. Fat gonadal tissue was collected on day 6 post-infection. The blood “controls” were obtained as follows: GFP-negative parasites were collected on day 4 post-infection (mostly slender forms), and GFP-positive parasites were collected on day 6 post-infection (mostly stumpy forms). Morphometric measurements were scored from phase contrast microscopy images, analyzed via HTIAoT, and confirmed by manual measurement. GFP negative, slender form; GFP positive, stumpy and intermediate forms. n = 100 per group, from three independent mouse experiments. Statistical significance was assessed using a Wilcoxon rank-sum test. (B) Representative images of parasites isolated from fat. Replicating parasites (such as the second from the left) were excluded from morphometric analysis. DNA was stained with DAPI (blue). GFP protein (green) is localized in the nucleus of intermediate and stumpy forms. Scale bar, 4 μm. (C) Transmission electron micrograph and 3D tomography images of a parasite isolated from gonadal adipose tissue. Mitochondrion is represented in cyan, glycosomes in pink, nucleus in white, and plasma membrane in yellow. Scale bar, 500 nm. See also Figure S5 and Movie S1.
Figure 5
Figure 5
ATF Parasites Are Transcriptionally Different from BSFs (A) Hierarchically clustered heat map of Pearson correlations of transcript levels (log2 transformed RPKM) from independent RNA-seq datasets: Lister427 parasites grown in culture (Pena et al., 2014) (n = 2), parasites isolated from blood of AnTat1.1-infected mice on day 4 post-infection (n = 2), and parasites isolated from gonadal fat on day 6 post-infection (n = 3). (B) Heat map view of relative transcript levels for differentially expressed genes from culture and in vivo in parasites isolated from the two tissues (adjusted p < 0.01 in at least two of three methods). (C) Volcano plot displaying in red the differentially expressed genes represented in (B). Displayed p values and fold changes are from DESeq2. See also Tables S1 and S2.
Figure 6
Figure 6
Fatty Acid β-Oxidation Is Active in ATF Parasites (A) Schematic of fatty acid β-oxidation pathway. Four enzymatic modifications are indicated by shaded box on the fatty acid structures where biotransformation takes place. Formulas in blue and green indicate the myristate and β-oxidation metabolites from the non-labeled and labeled myristate, respectively, identified in this work. (B) Fatty acid methyl ester (FAME) analysis by GC-MS of D27-C14:0-labeled BSF (left) or ATF (right) parasites for 1 hr (upper) and chased for a further 1 hr (lower). GC-MS trace shows 30–34 min (n = 3). (C) Uptake of D27-C14:0 and β-oxidation metabolites after normalization to the added internal standard C17:0. 100% equates to the amount of D27-C14:0 taken up by bloodstream form in the 1 hr labeling (pulse) (n = 3). The values represented are the means and the respective SEM. See also Figures S6 and S7.

Comment in

References

    1. Amole B.O., Wittner M., Hewlett D., Tanowitz H.B. Trypanosoma brucei: infection in murine diabetes. Exp. Parasitol. 1985;60:342–347. - PubMed
    1. Aresta-Branco F., Pimenta S., Figueiredo L.M. A transcription-independent epigenetic mechanism is associated with antigenic switching in Trypanosoma brucei. Nucleic Acids Res. 2016;44:3131–3146. - PMC - PubMed
    1. Bargul J.L., Jung J., McOdimba F.A., Omogo C.O., Adung’a V.O., Krüger T., Masiga D.K., Engstler M. Species-specific adaptations of Trypanosome morphology and motility to the mammalian host. PLoS Pathog. 2016;12:e1005448. - PMC - PubMed
    1. Butter F., Bucerius F., Michel M., Cicova Z., Mann M., Janzen C.J. Comparative proteomics of two life cycle stages of stable isotope-labeled Trypanosoma brucei reveals novel components of the parasite’s host adaptation machinery. Mol. Cell. Proteomics. 2013;12:172–179. - PMC - PubMed
    1. Chun T.W., Moir S., Fauci A.S. HIV reservoirs as obstacles and opportunities for an HIV cure. Nat. Immunol. 2015;16:584–589. - PubMed

MeSH terms