. 2016 Jun 22;2(6):391-401.
doi: 10.1016/j.cels.2016.04.015. Epub 2016 May 26.

Insights into the Mechanisms of Basal Coordination of Transcription Using a Genome-Reduced Bacterium

Affiliations

Insights into the Mechanisms of Basal Coordination of Transcription Using a Genome-Reduced Bacterium

Ivan Junier et al. Cell Syst. .

Erratum in

Abstract

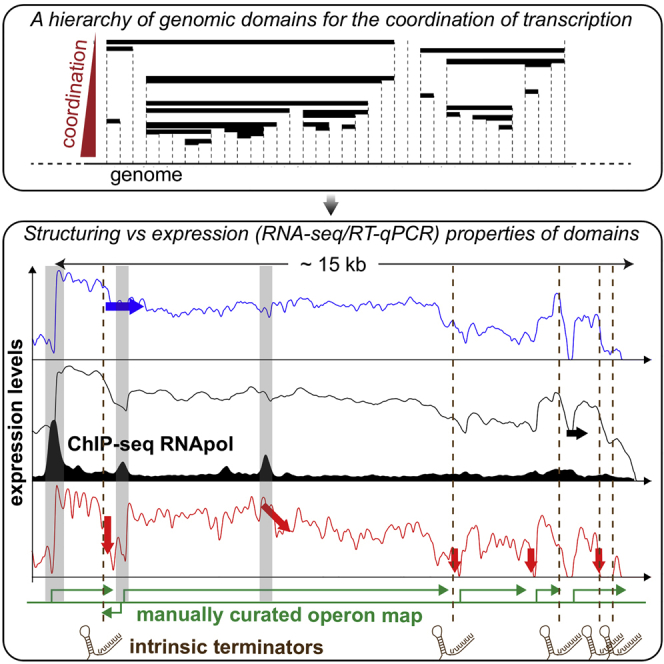
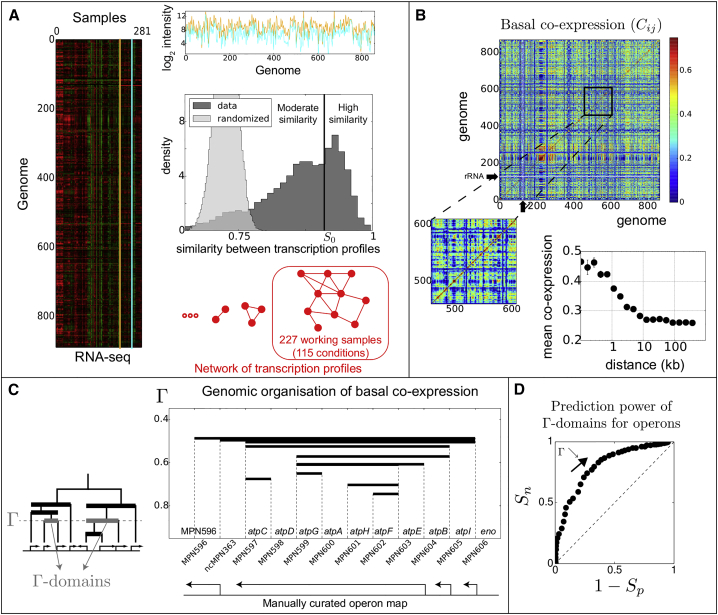
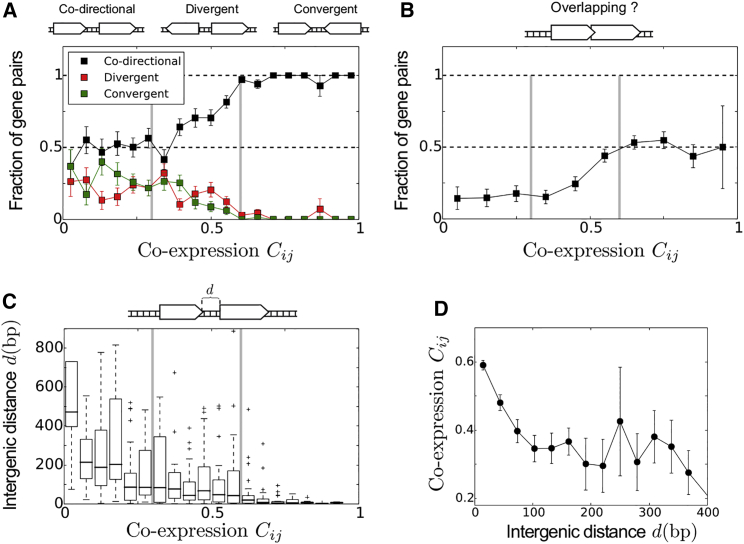
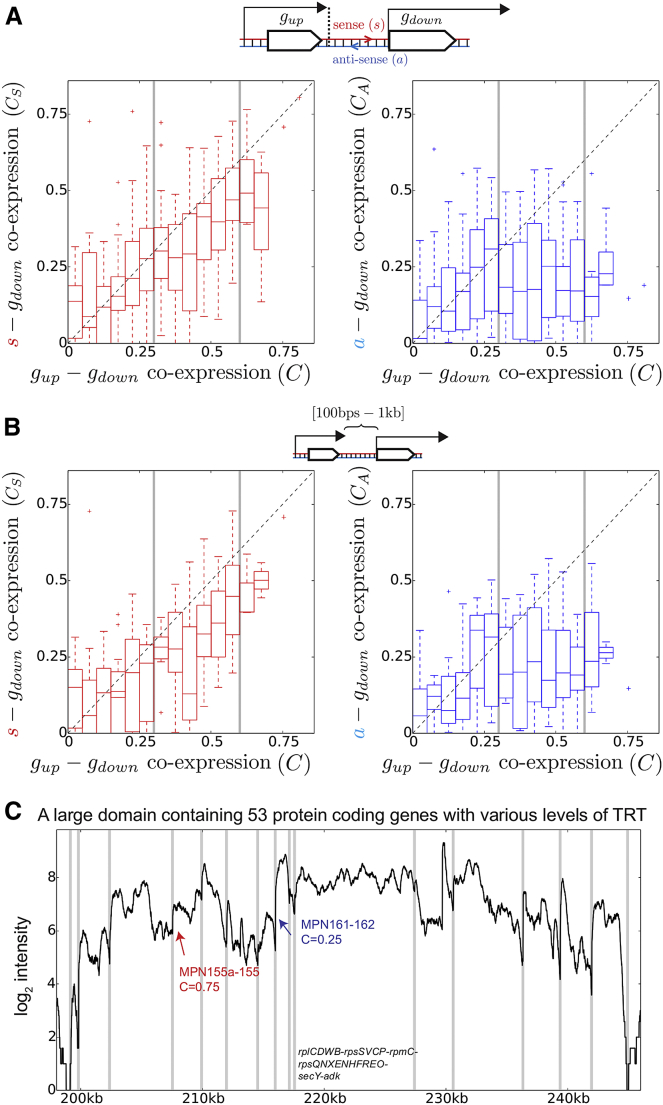
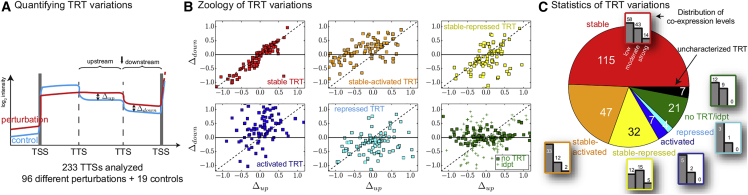
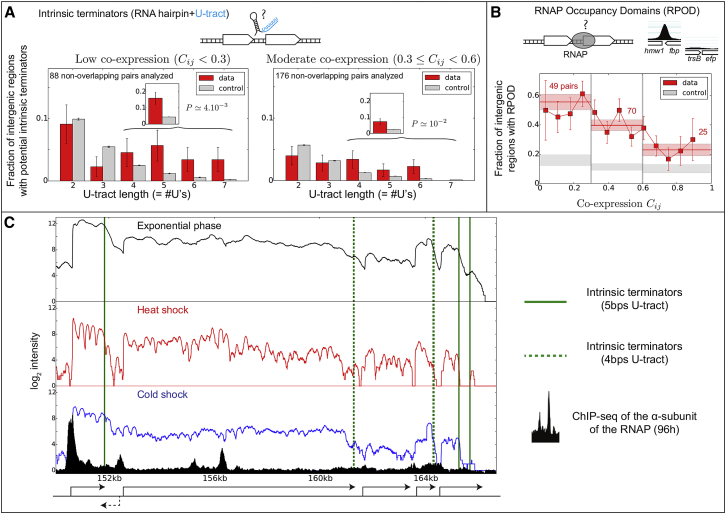
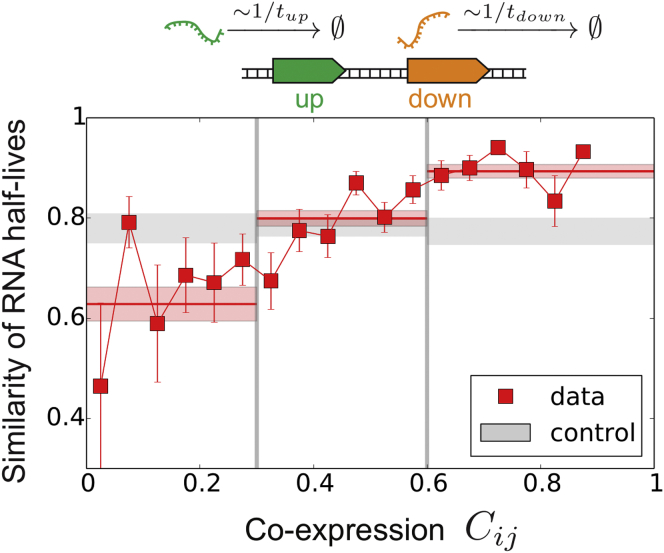
Coordination of transcription in bacteria occurs at supra-operonic scales, but the extent, specificity, and mechanisms of such regulation are poorly understood. Here, we tackle this problem by profiling the transcriptome of the model organism Mycoplasma pneumoniae across 115 growth conditions. We identify three qualitatively different levels of co-expression corresponding to distinct relative orientations and intergenic properties of adjacent genes. We reveal that the degree of co-expression between co-directional adjacent operons, and more generally between genes, is tightly related to their capacity to be transcribed en bloc into the same mRNA. We further show that this genome-wide pervasive transcription of adjacent genes and operons is specifically repressed by DNA regions preferentially bound by RNA polymerases, by intrinsic terminators, and by large intergenic distances. Taken together, our findings suggest that the basal coordination of transcription is mediated by the physical entities and mechanical properties of the transcription process itself, and that operon-like behaviors may strongly vary from condition to condition.


Figures

None
Graphical abstract
Figure 1
Figure 1
A Hierarchical Genomic Analysis of RNA-Seq Data across More Than 100 Conditions (A) Given the initial set of RNA-seq samples (2 of which are shown at the top in cyan and orange), we computed all possible pairwise similarities (Pearson coefficient). These were in general high (dark gray distribution), even after shuffling, for each gene separately, the expression values between the conditions (light gray distribution). Given the bimodal shape of the resulting distribution, we defined a threshold (=0.91, vertical black line) above which profiles with larger similarities were connected to form a network, as schematically represented in red. The largest component of the network contained 227 samples (115 conditions), which we used to compute the basal co-expression. (B) Top: heatmap of the basal co-expression for which the genes are sorted according to their genomic position. The black arrows indicate the position of the rRNAs, which were used to normalize the data and, hence, whose co-expression values were discarded (thin white lines). Bottom left: zoom in. Bottom right: average co-expression level between pairs of genes as a function of their genomic distance. (C) Using a hierarchical clustering constrained to respect the linear organization of the genome, we built a dendrogram (bottom left) by fusing genes on the basis of their co-expression level. Γ -domains are maximal segments of the genome inside which all pairs of adjacent genes have a co-expression larger than Γ (gray thick lines; all thick lines correspond to a specific Γ -domain but for various values of Γ). They thus correspond to the clades of the dendrogram at the level Γ. As shown on the right panel for the F-ATPase genes, although different, Γ -domains share similarities with operons. (D) Receiver-operating characteristic analysis to evaluate the predictive power of Γ -domains for operons (AUC = 0.76). Sn and Sp respectively indicate the sensitivity and specificity of the resulting domains.
Figure 2
Figure 2
Evidence for the Existence of a Three-Level Organization in the Basal Coordination of Transcription (A) The distribution of relative orientations of adjacent genes as a function of their co-expression reveals the existence of three qualitatively different levels of co-expression, with threshold occurring at ∼0.3 and ∼0.6 (vertical gray lines). (B and C) A similar three-level organization can be distinguished both from the fraction of overlapping pairs (B) and from the distribution of the intergenic distances (d) that separate co-directional genes (C). (D) Mean co-expression as a function of the distance separating co-directional adjacent genes, revealing a characteristic length scale of 100 bp below which co-expression is all the higher that the distance is small. Error bars correspond to SEM.
Figure 3
Figure 3
TRT at the Core of the Basal Coordination of Transcription (A) Left: for pairs of co-directional adjacent genes belonging to different operons, we compare the co-expression, CS, between the downstream gene and the sense (5′→ 3′) intergenic region with the co-expression, C, between the two genes. Right: as a control, we consider the anti-sense (3′→ 5′) region (co-expression CA) instead of the sense region. Results show that for C>0.3, CS and C are strongly correlated, while CA and C are not. Correlations for C < 0.3 might be explained by local concentration effects and the presence of pervasive transcription (Wade and Grainger, 2014). (B) Same as in (A) but keeping only pairs of operons that are separated by more than 100 bp; distances are measured from the TTS of the upstream operon to the TSS of the downstream operon. (C) Example of a large domain with a high-level background expression surrounding the ribosomal protein genes and containing 53 genes (15 operons) and for which 46 of the 52 pairs show a significant basal co-expression (> 0.3); for clarity, we indicate the composition of only the largest operon. Although the TSSs of most operons (vertical gray lines) can be distinguished by a steep fold change of the expression, real-time qPCR analysis confirms that TRT occurs between strongly co-expressed operons, as indicated in red for the pair MPN155a-MPN155. In contrast, TRT does not seem to occur at a significant level for low co-expression as in the case indicated in blue (see Figure S3 for details). The RNA-seq profile was obtained at 24 hr (late exponential) of the growth curve.
Figure 4
Figure 4
Quantification of TRT Variations (A) For each pair of adjacent operons, we analyzed at the TTS of the last gene of the upstream operon (black arrow) the behavior of the downstream variation of expression (Δdown) as a function of the upstream variation of expression (Δup); the corresponding regions were defined by the closest TTS or TSS on each side of the TTS of interest. (B) We identified six types of TTS, for which an example of each type is shown in every panel; the 96 color points inside every panel correspond to the resulting behavior of the corresponding TTS for the 96 perturbations. To this end, we used two p values, P1 and P2, respectively associated to the null hypotheses that Δdown and Δup are not linearly correlated and that on average, Δdown is equal to Δup, and considered for significance thresholds a multiple hypothesis correction procedure (Supplemental Experimental Procedures). Stable TRT was then defined by a significant P1 and a non-significant P2, stable-activated (repressed) TRT by significant values of both P1 and P2 with ΔdownΔup(ΔdownΔup), activated (repressed) TRT by a non-significant P1 and a significant P2 with ΔdownΔup(ΔdownΔup), and the set “no TRT or independent TRT” by non-significant values of both P1 and P2. (C) Distribution of the TTS types as identified in (B). Uncharacterized types (in black) correspond to those that did not fit the criteria of the p values. For each type, we show in addition the distribution of basal co-expression (low, moderate, or strong, indicated by the gray bars), revealing that only stable TRTs contribute to strong basal co-expression.
Figure 5
Figure 5
Intergenic Properties of Co-directional Genes Relevant to Delineate Domains of Transcription En Bloc (A) Fraction of intergenic regions containing a potential intrinsic terminator for low co-expression levels (left) and for moderate co-expression levels (right). Potential terminators were defined as RNA hairpins immediately followed by a U tract. Several lengths (NU) of the U tracts were analyzed (x axis of the bar plots). As a null model, we considered intergenic regions that were shifted by various amounts of base pairs (gray bars; Supplemental Experimental Procedures), allowing us to evaluate the statistical significance of the results (error bars indicate SEM). Insets show the results by cumulating the cases in which NU4, revealing an enrichment that is absent with shorter U tracts (NU<4). (B) Fraction of intergenic regions containing a RPOD as a function of the basal coordination of transcription. The red bands indicate the SEM computed over the whole region; the red numbers indicate the number of corresponding pairs among the 386 pairs of non-overlapping genes analyzed. The gray bands indicate the same values but for data for which the positions of the intergenic regions were globally shifted by an arbitrary amount of base pairs. (C) RNA-seq profiles of a large ten-gene (four-operon) domain around the heat shock gene (grpE) showing condition-dependent TRT; one additional gene (dashed arrow) is present on the opposite strand. Bottom, in black: ChIP-seq profile of the α-subunit of the RNAP (data obtained at 96 hr), revealing in particular the presence of a large RPOD at the start of the domain. Vertical green lines, positions of strong intrinsic terminators as identified in (A).
Figure 6
Figure 6
Relative Stability of Transcripts of Adjacent Co-directional Genes The relative stability is defined as 1(|tuptdown|/|tup+tdown|), with tup and tdown the transcript half-lives of the upstream and downstream genes, respectively; this parameter is therefore close to 1 for similar half-lives and close to 0 for very different ones. The red bands indicate the SEM computed over the corresponding region of co-expression. The gray bands indicate the same values but for a random set of pairs of genes.

References

    1. Bae W., Xia B., Inouye M., Severinov K. Escherichia coli CspA-family RNA chaperones are transcription antiterminators. Proc. Natl. Acad. Sci. U S A. 2000;97:7784–7789. - PMC - PubMed
    1. Berthoumieux S., de Jong H., Baptist G., Pinel C., Ranquet C., Ropers D., Geiselmann J. Shared control of gene expression in bacteria by transcription factors and global physiology of the cell. Mol. Syst. Biol. 2013;9:634. - PMC - PubMed
    1. Carpentier A.-S., Torrésani B., Grossmann A., Hénaut A. Decoding the nucleoid organisation of Bacillus subtilis and Escherichia coli through gene expression data. BMC Genomics. 2005;6:84. - PMC - PubMed
    1. Chen H., Shiroguchi K., Ge H., Xie X.S. Genome-wide study of mRNA degradation and transcript elongation in Escherichia coli. Mol. Syst. Biol. 2015;11:781. - PMC - PubMed
    1. Chen Y.-J., Liu P., Nielsen A.A., Brophy J.A., Clancy K., Peterson T., Voigt C.A. Characterization of 582 natural and synthetic terminators and quantification of their design constraints. Nat. Methods. 2013;10:659–664. - PubMed

Publication types

Substances