. 2016 Jun 6;37(5):428-43.
doi: 10.1016/j.devcel.2016.05.003. Epub 2016 May 26.

Transient Fcho1/2⋅Eps15/R⋅AP-2 Nanoclusters Prime the AP-2 Clathrin Adaptor for Cargo Binding

Affiliations

Transient Fcho1/2⋅Eps15/R⋅AP-2 Nanoclusters Prime the AP-2 Clathrin Adaptor for Cargo Binding

Li Ma et al. Dev Cell. .

Abstract

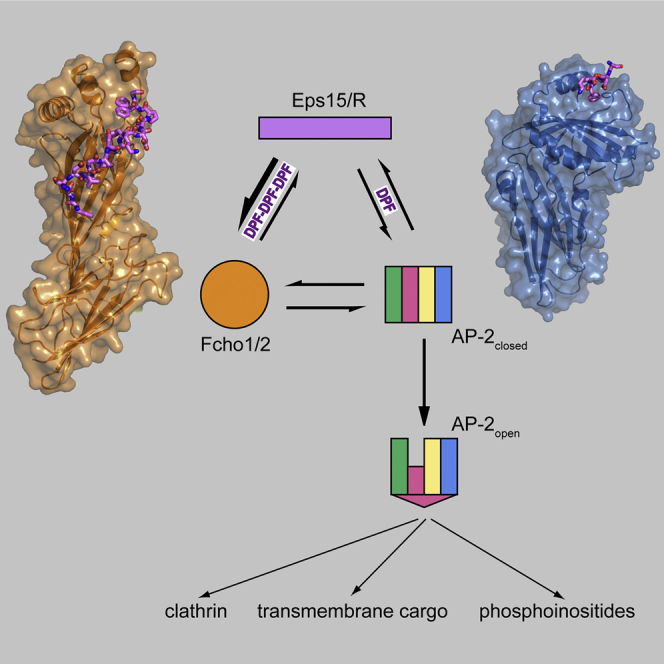
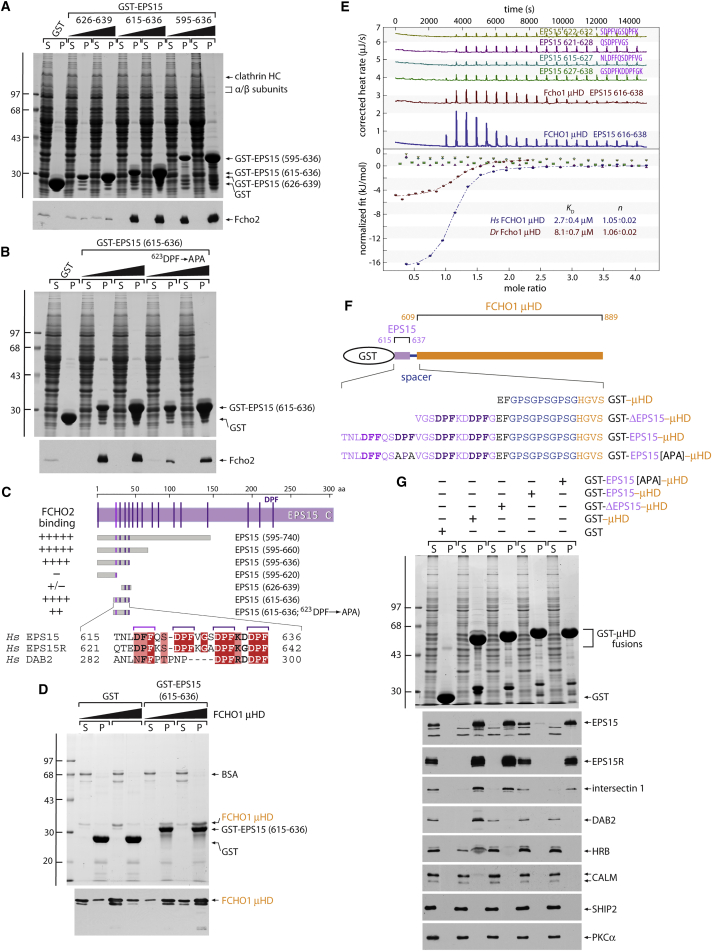
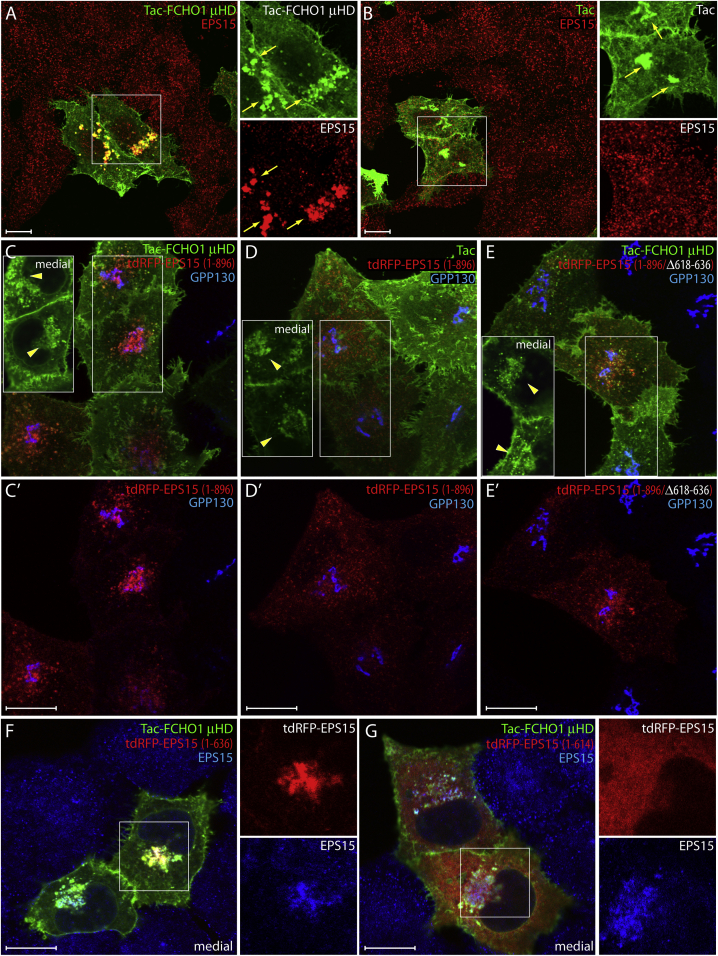
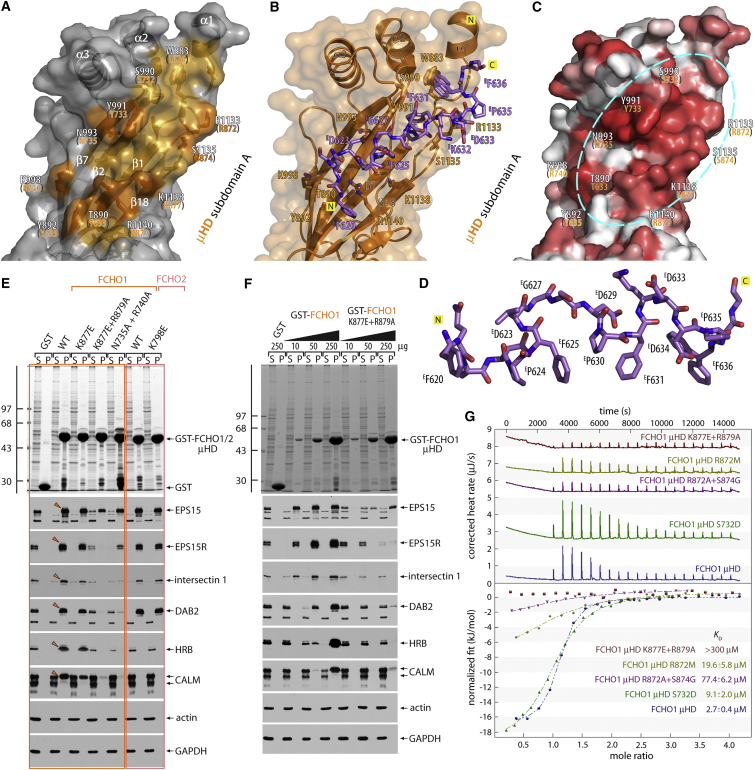
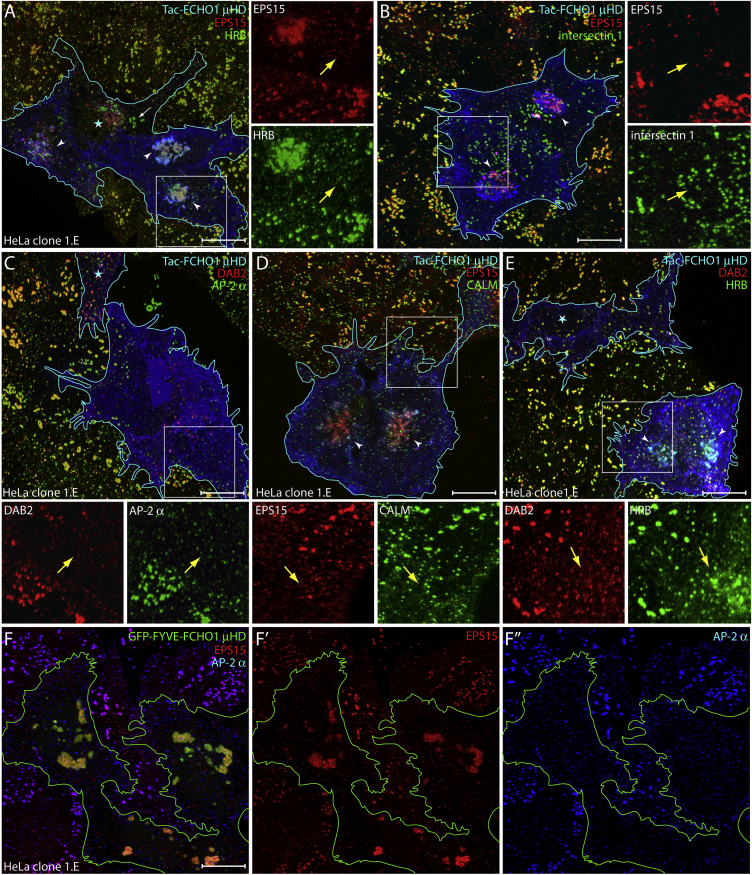
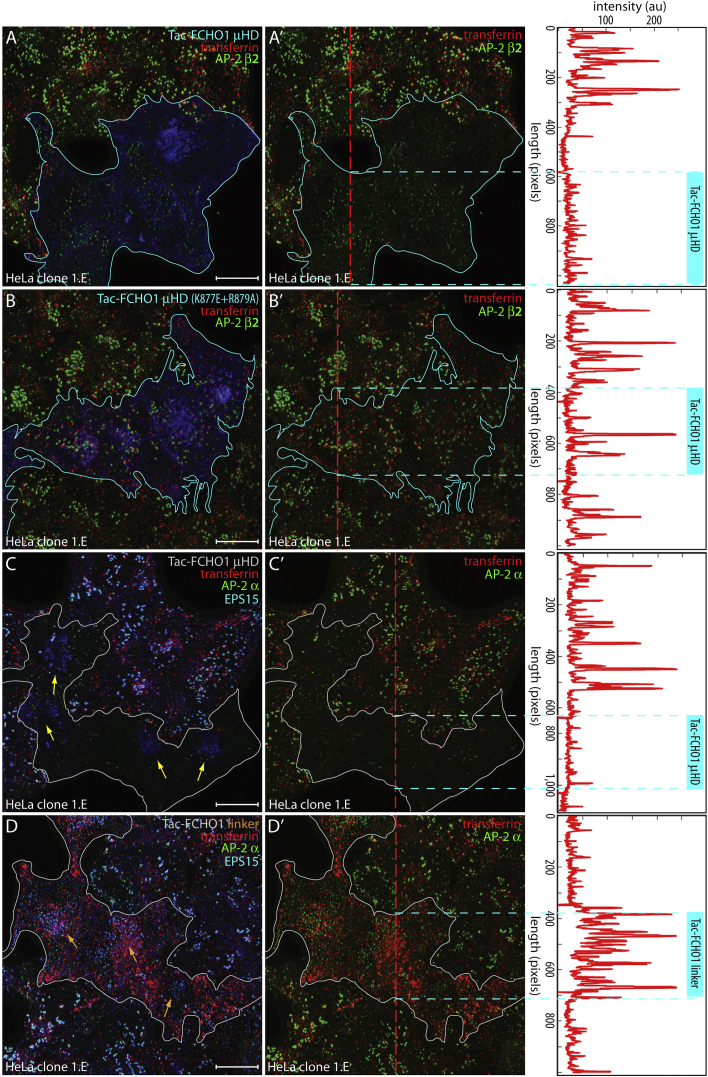
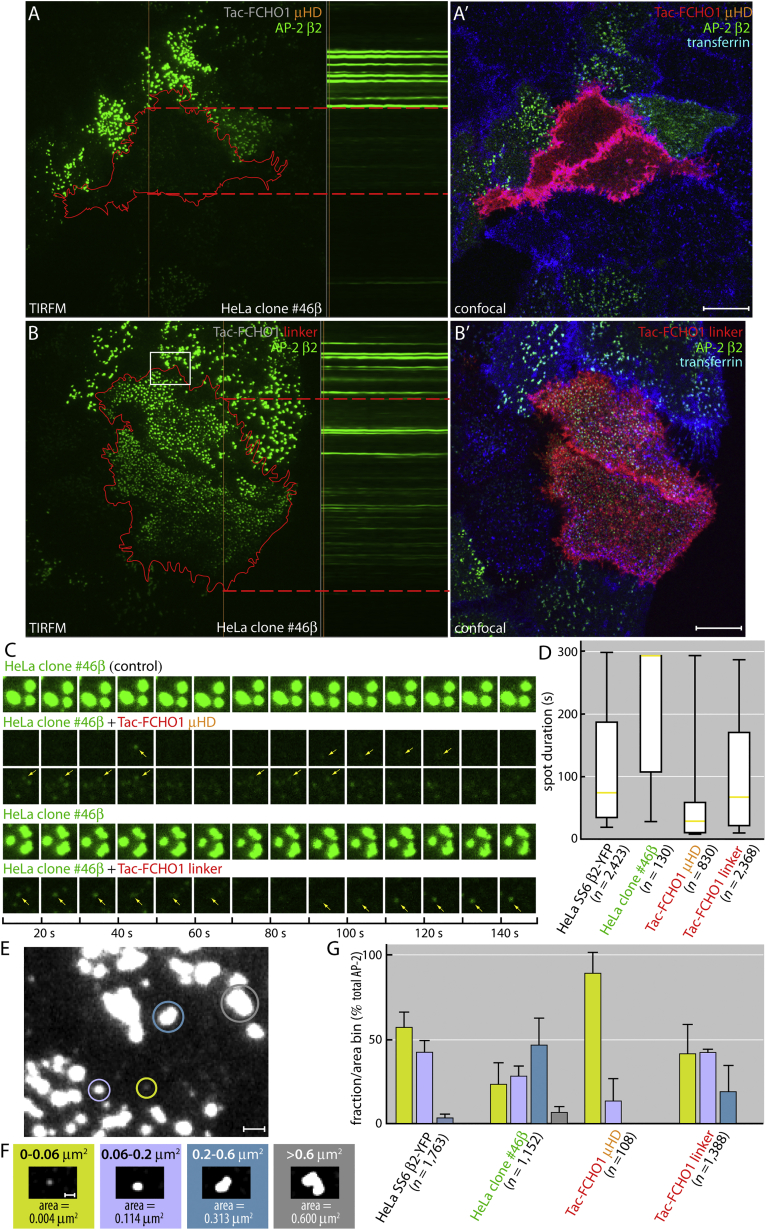
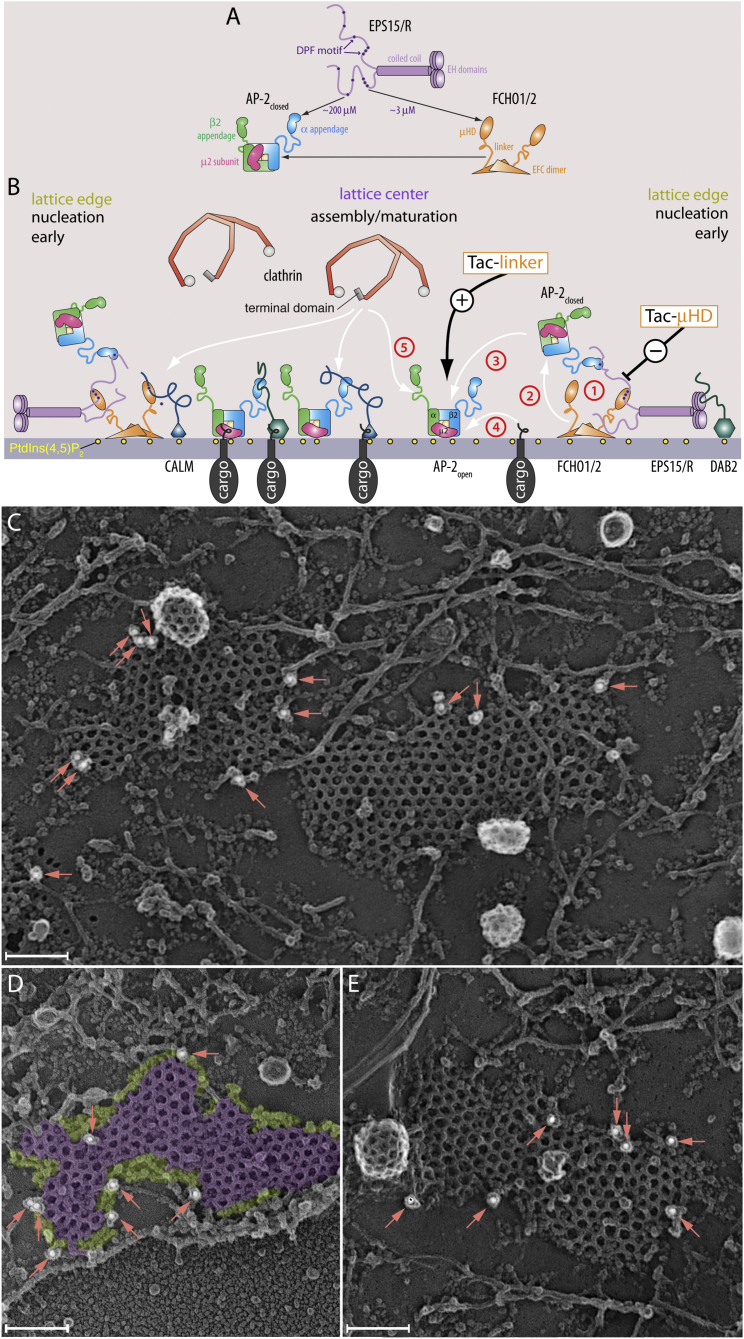
Clathrin-coated vesicles form by rapid assembly of discrete coat constituents into a cargo-sorting lattice. How the sequential phases of coat construction are choreographed is unclear, but transient protein-protein interactions mediated by short interaction motifs are pivotal. We show that arrayed Asp-Pro-Phe (DPF) motifs within the early-arriving endocytic pioneers Eps15/R are differentially decoded by other endocytic pioneers Fcho1/2 and AP-2. The structure of an Eps15/R⋅Fcho1 μ-homology domain complex reveals a spacing-dependent DPF triad, bound in a mechanistically distinct way from the mode of single DPF binding to AP-2. Using cells lacking FCHO1/2 and with Eps15 sequestered from the plasma membrane, we establish that without these two endocytic pioneers, AP-2 assemblies are fleeting and endocytosis stalls. Thus, distinct DPF-based codes within the unstructured Eps15/R C terminus direct the assembly of temporary Fcho1/2⋅Eps15/R⋅AP-2 ternary complexes to facilitate conformational activation of AP-2 by the Fcho1/2 interdomain linker to promote AP-2 cargo engagement.


Figures

None
Graphical abstract
Figure 1
Figure 1
A Minimal EPS15 Interaction Motif (A and B) GST pull-down assays with rat brain cytosol and 250 μg of GST and either 50 or 250 μg of the indicated GST-EPS15 fusion proteins. SDS-PAGE-separated supernatant (S, 2%) and pellet (P, 10%) fractions were stained or immunoblotted with antibodies against Fcho2. (C) Location of DPF triplets in the EPS15 C-terminal domain, with the relative location of the various fragments tested below. Alignment of Homo sapiens (Hs) EPS15, EPS15R, and DAB2 sequences corresponding to the minimal motif, boxed with red for identity and pink for similarity. (D) GST pull-down assay with purified FCHO1 μHD and ∼50 μg of either GST or GST-μHD fusion protein in the presence of carrier BSA. SDS-PAGE-separated supernatant and pellet fractions were stained or immunoblotted with an anti-FCHO1 monoclonal antibody. (E) Representative ITC experiments with the Danio rerio (Dr) Fcho1 μHD and EPS15 616–638 peptide or the Hs FCHO1 μHD titrated with the 616–638 or indicated EPS15 peptides. KD, reaction stoichiometry (n), and errors were calculated from a minimum of four runs. (F) Cartoon representation of GST-EPS15-FCHO1 μHD chimeras, with the specific EPS15 sequence for each variant preceding the GlyProSer spacer shown below. (G) GST pull-down assay using HeLa cell lysate and 250 μg of either GST or GST-μHD fusion proteins as indicated. Separated supernatant and pellet fractions were stained or replicates immunoblotted with the indicated antibodies as in (A).
Figure 2
Figure 2
The EPS15 μHD Interaction Motif In Vivo (A and B) Representative single confocal optical sections of basal surface of HeLa SS6 cells transfected with either Tac-FCHO1 μHD (A) or Tac (B) as indicated. Fixed cells were stained with anti-Tac or anti-EPS15 antibodies. Enlarged color-separated regions corresponding to the boxed areas are shown and Golgi-localized Tac and EPS15 (arrows) are indicated. Scale bar, 10 μm. (C–E′) Typical basal confocal sections of fixed HeLa cells double transfected with the indicated Tac and tdRFP-EPS15 plasmids and stained with antibodies against Tac and GPP130 as indicated (C′–E′). Corresponding medial optical sections of the boxed regions are shown (C–E) indicating the Golgi pool (arrowheads) of Tac protein. Scale bar, 10 μm. (F and G) Representative medial confocal optical sections of HeLa cells transiently transfected with Tac-FCHO1 μHD and either tdRFP-EPS15 (1–636) or (1–614) as indicated after fixation and staining with anti-Tac and anti-Eps15 antibodies. Enlargements of boxes as in (A). Note that the anti-Eps15 is a peptide-specific antibody raised against the extreme C terminus of the protein, which is truncated in the two tagged exogenous proteins. Scale bar, 10 μm.
Figure 3
Figure 3
A Major Interaction Surface on Fcho1 μHD Subdomain A (A–C) Combination ribbon and molecular surface representation of the concave face of zebrafish Fcho1 μHD subdomain A showing the EPS15 binding trough. (A) The β strands involved and projecting μHD contact residues (light orange), determined by the PISA server. Selected side chains mutated are indicated (dark orange) with the corresponding residue number in the FCHO1 μHD indicated in orange type. (B) View of the tandem DFP motifs (stick representation with carbon mauve, nitrogen blue, and oxygen atoms red) bound to the μHD. EF636 is shown in a dual conformation with μHD W833 also in dual conformation to permit flipping of EF636. (C) ENDscript 2 (Robert and Gouet, 2014) computed phylogenetic surface conservation between muniscin μHDs using the TrEMBL (opisthokonta) database for sequence alignments. Conservation graded in shades from invariant (red) to unrelated (white) projected onto the solvent-accessible molecular surface of the Fcho1 μHD. The surface conservation reveals a patch (cyan oval) of invariant and highly conserved residues at the binding site on subdomain A, while there is a rather discombobulated patchwork pattern of conservation over the convex face. (D) The bound DPF tract showing the spatial arrangement of the aromatic Phe and Pro side chains packing into the μHD trough. (E) Pull-down assay utilizing HeLa cell lysate and 250 μg of GST, GST-FCHO1 (orange box), or GST-FCHO2 (pink box) μHD, or the indicated mutant. Stained gel and replicate blots were probed with the indicated antibodies. Position of bound partner protein (arrowheads) is indicated. (F) Pull-down assay with HeLa cell lysate and the indicated amount of GST, GST-FCHO1 μHD, or K877E + R879A mutant immobilized on glutathione-Sepharose. (G) Representative ITC experiments of wild-type FCHO1 or color-coded mutant μHDs binding to an EPS15 616–638 peptide.
Figure 4
Figure 4
Altered CCSs in Tac-μHD-Transfected HeLa 1.E Cells (A–E) Deconvolved maximal projections of HeLa clone 1.E cells transfected with Tac-μHD and stained with the indicated antibody combinations. Transfected cells (blue outline), misrecruited juxtanuclear EPS15 and/or HRB (arrowheads), and altered pioneer/CLASP distributions (yellow arrows) are indicated. Sequestration is dose dependent; residual HRB-positive enlarged CCSs (white arrow) in a low Tac-μHD expresser (asterisk) are indicated in (A). Scale bar, 10 μm. (F–F″) Representative deconvolved maximal projection of GFP-FYVE-μHD transfected (green outline) HeLa 1.E cells stained with the indicated antibodies. Scale bar, 10 μm.
Figure 5
Figure 5
Defective CME in Tac-μHD-Expressing 1.E Cells (A–B′) HeLa clone 1.E cells transfected with either Tac-μHD (A) or the Tac-μHD (K877E + R879A) mutant (B) and pulsed with transferrin (red) for 2 min at 37°C, surface stripped on ice, and rewarmed to 37°C for another 2 min before fixation. Representative deconvolved maximal intensity z projection of permeabilized cells stained with antibodies against Tac and the AP-2 β2 subunit is indicated. Transfected cell groups are outlined, and superimposed transferrin and AP-2 shown in (A′) and (B′). Scale bar, 10 μm. Correlative linescan analysis at indicated locations in A′ and B′ (dashed vertical line) is shown on the right, with relative position of transfected cells indicated with a vertical cyan bar and horizontal broken cyan lines. (C–D′) Deconvolved z stack projections of 1.E cells transfected with either Tac-μHD (C) or Tac-linker (D) and similarly pulsed with transferrin as in (A) and (B). Fixed and permeabilized cells were stained with antibodies against the AP-2 α subunit and EPS15 as indicated. Tac-μHD-dependent intracellular clustering of EPS15 (yellow arrows) and diminished transferrin internalization contrasts the retention of EPS15 in regular AP-2-positive surface puncta (orange arrows) and enhanced endocytosis in presence of the Tac-linker. Scale bar, 10 μm. Correlative linescan analysis at indicated locations in (C′) and (D′) (red dashed line) is shown on the right, with relative position of transfected cells indicated as in (A) and (B).
Figure 6
Figure 6
Uptake Defects in FCHO2 and EPS15 Compromised Cells (A–B′) TIRFM analysis of HeLa clone #46β cells transfected with either Tac-μHD (A) or Tac-linker (B). The initial frame of the kymograph series (left), the kymograph (center), and a final confocal image (A′, B′) of the same area after labeling with anti-Tac and fluorescent transferrin (right) are shown. A single pixel-width vertical line (orange) on the first TIRFM fame (left) indicates the coordinates for the kymograph (center panel), and the relative locations of the transfected cells in the kymographs are marked (dashed horizontal red lines). Scale bar, 10 μm. (C) Time-lapse examples of local β2-YFP puncta selected from the image series in (A) and (B) to detail the major differences between the long-lived large structures in the control clone 1.E cells compared with the transfected cells. Representative individual spot life times (arrows) are indicated. (D) Box-and-whisker (minimum-maximum) plot quantitation of computed spot durations from the kymographs in (A) and (B), and also compared with the parental HeLa SS6 β2-YFP cells. Median is indicated in yellow and the number of fluorescent puncta analyzed/condition is indicated. (E–G) Enlarged gray-scale view (E) of region boxed in (B) illustrating selected examples of the color-coded spot area bins (F) used in quantitation (G). The SD and number of spots analyzed for each condition are indicated. Scale bars, 1 μm (E) and 0.5 μm (F).
Figure 7
Figure 7
Transient Higher-Order Complexes to Load Active AP-2 at Growing Assembly Zones (A and B) Schematic models for edge effects on vectorial CCS initiation. The DPF code (A) will have consequences for the formation and stability of Eps15⋅Fcho1/2, Eps15⋅AP-2, and Eps15⋅Fcho1/2⋅AP-2 nanoclusters. Because of the higher apparent affinity of the Fcho μHD for the DPFs in Eps15/R, formation of Eps15⋅Fcho1/2 will be favored at inchoate sites of CCS assembly. (C–E) Representative deep-etch electron microscopic image views of adherent ventral cell membranes of HeLa SS6 cells immunogold labeled for FCHO2 with 18 nm colloidal gold (arrows). Proteins assembled around the perimeter (chartreuse) of characteristic polyhedrally assembled clathrin lattice (purple) are pseudo-colored (C). Scale bar, 100 nm.

Comment in

References

    1. Aguet F., Antonescu C.N., Mettlen M., Schmid S.L., Danuser G. Advances in analysis of low signal-to-noise images link dynamin and AP2 to the functions of an endocytic checkpoint. Dev. Cell. 2013;26:279–291. - PMC - PubMed
    1. Antonescu C.N., Aguet F., Danuser G., Schmid S.L. Phosphatidylinositol-(4,5)-bisphosphate regulates clathrin-coated pit initiation, stabilization, and size. Mol. Biol. Cell. 2011;22:2588–2600. - PMC - PubMed
    1. Avinoam O., Schorb M., Beese C.J., Briggs J.A., Kaksonen M. Endocytic sites mature by continuous bending and remodeling of the clathrin coat. Science. 2015;348:1369–1372. - PubMed
    1. Benmerah A., Begue B., Dautry-Varsat A., Cerf-Bensussan N. The ear of α-adaptin interacts with the COOH-terminal domain of the eps15 protein. J. Biol. Chem. 1996;271:12111–12116. - PubMed
    1. Benmerah A., Bayrou M., Cerf-Bensussan N., Dautry-Varsat A. Inhibition of clathrin-coated pit assembly by an Eps15 mutant. J. Cell Sci. 1999;112:1303–1311. - PubMed

MeSH terms