. 2016 Jun 16;165(7):1789-1802.
doi: 10.1016/j.cell.2016.05.007. Epub 2016 May 26.

Mapping of Brain Activity by Automated Volume Analysis of Immediate Early Genes

Affiliations

Mapping of Brain Activity by Automated Volume Analysis of Immediate Early Genes

Nicolas Renier et al. Cell. .

Abstract

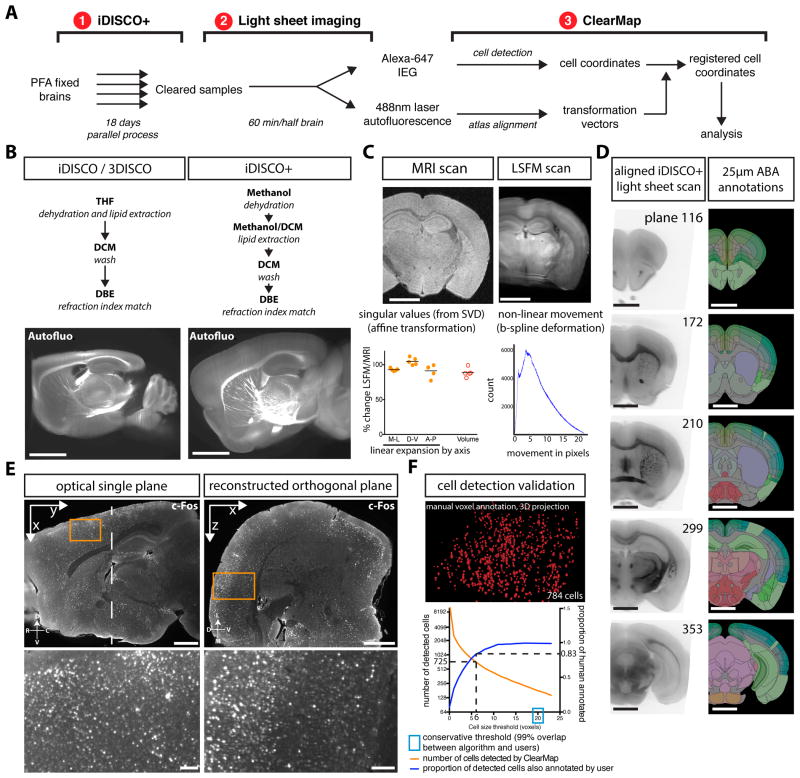
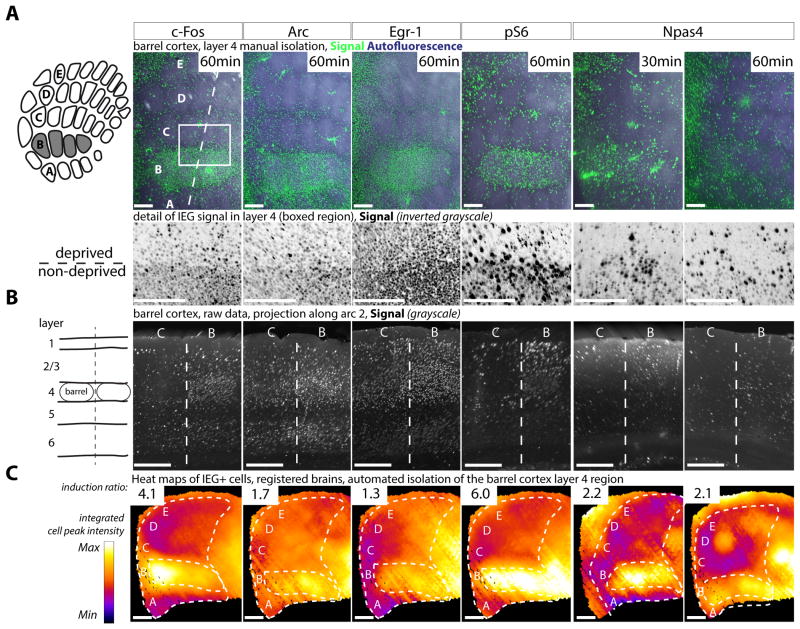
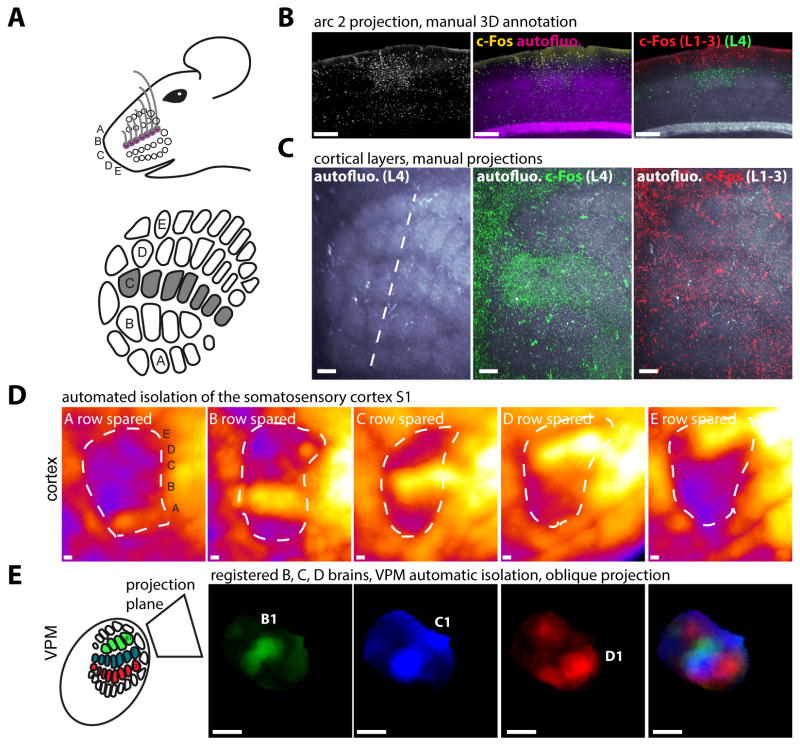
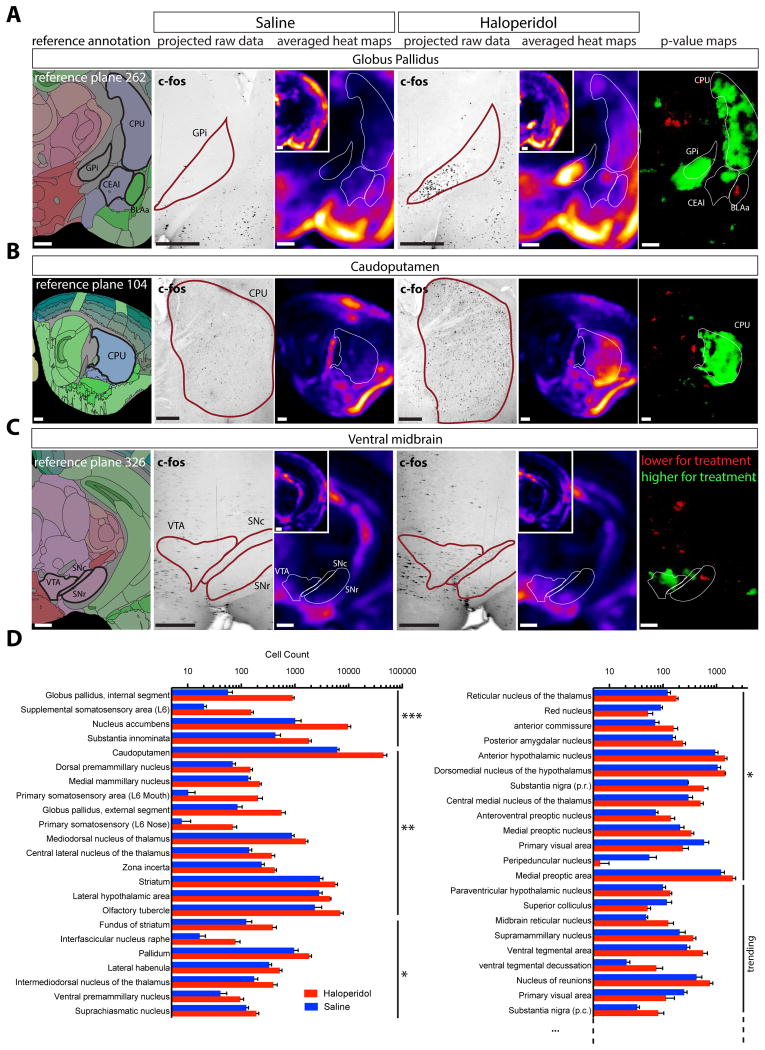
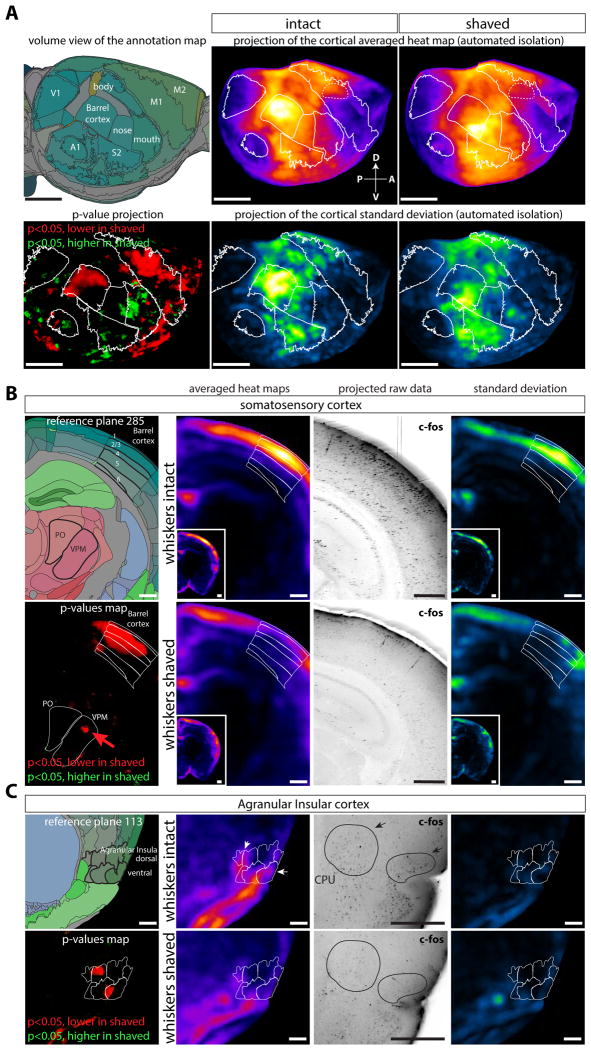
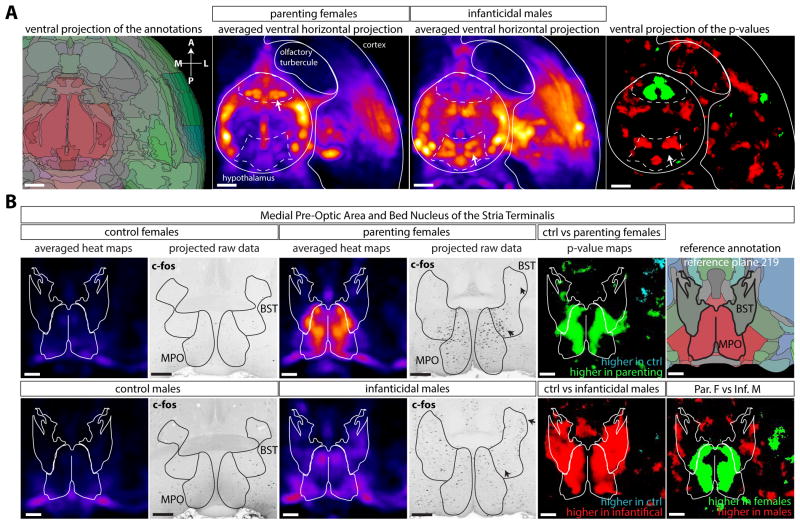
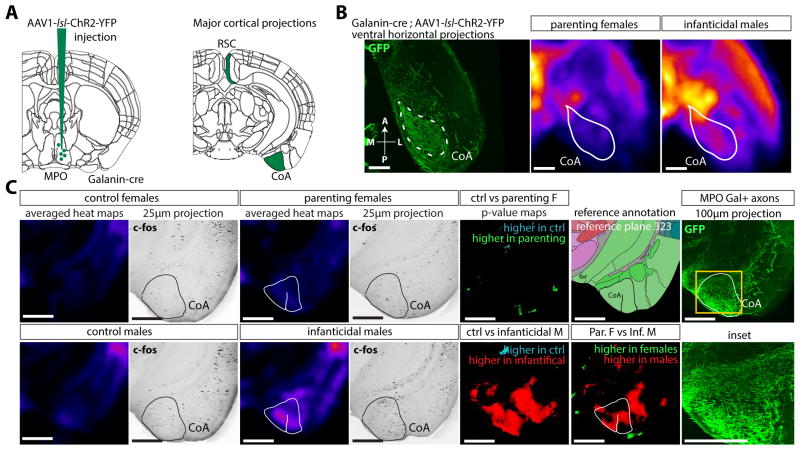
Understanding how neural information is processed in physiological and pathological states would benefit from precise detection, localization, and quantification of the activity of all neurons across the entire brain, which has not, to date, been achieved in the mammalian brain. We introduce a pipeline for high-speed acquisition of brain activity at cellular resolution through profiling immediate early gene expression using immunostaining and light-sheet fluorescence imaging, followed by automated mapping and analysis of activity by an open-source software program we term ClearMap. We validate the pipeline first by analysis of brain regions activated in response to haloperidol. Next, we report new cortical regions downstream of whisker-evoked sensory processing during active exploration. Last, we combine activity mapping with axon tracing to uncover new brain regions differentially activated during parenting behavior. This pipeline is widely applicable to different experimental paradigms, including animal species for which transgenic activity reporters are not readily available.


Figures

Figure 1
Figure 1. iDISCO+ and ClearMap: a pipeline for cell detection, registration and mapping in intact samples using light sheet microscopy
A Presentation of the iDISCO+ and ClearMap pipeline. B New clearing strategy enabling morphology preservation. LSFM scans of the autofluorescence of adult mouse brains. Optical plane through brains cleared with either 3DISCO (after iDISCO whole-mount immunolabeling) or iDISCO+. See also Figure S1+ and S2. C Quantification of the shrinkage and deformations induced by the clearing procedure by registering MRI-scanned brains back onto themselves after clearing (n=5). Left graph: the singular values of the coefficient matrix from the affine transformation show a modest linear change in size along the medio-lateral (M-L), dorso-ventral (D-V) and antero-posterior (A-P) axis. The change in volume is given by the determinant of the matrix. Right graph: histogram of the movements of voxels during the non-linear transformations (representative example from 1 brain). See also Figure S2. D Fully automated registration of the LSFM autofluorescence scan to the Allen Brain Institute 25μm reference annotation. E Single optical plane and reconstructed planes showing the isotropic imaging resolution at the center of the imaging lens with a cellular resolution and large field of view, with a blow up of the boxed cortical region. Right panels: orthogonal cross-section at the level of the dotted line with a blow up of the boxed cortical region, showing the minimal degradation of the resolution in the z direction at the center of the lens. See also Figure S1, S4 and S5. F Manual annotation of cells and comparison with the automated detection. All voxels of each cell were manually painted, and the 3D automated cell detection was run on the same dataset. The proportion of detected cells also manually annotated was determined for each value of the threshold for cell volume (in voxels). See also Figure S3. Scale bars are 2mm.
Figure 2
Figure 2. Compatibility of antibodies to several Immediate Early Genes with whole brain immunolabeling and automated volume analysis
Whole-mount iDISCO+ immunolabeling for c-Fos, Arc, Egr-1, pS6 and Npas4 of adult mouse brains, with B-row whiskers stimulated for 1h prior to euthanasia. See Table S4 for informations about the antibodies. A Manual projection of the cortical layer 4, caudo-medial region of the barrel cortex (staining and autofluorescence). A zoom of the boxed region is shown below, highlighting the difference of positive cell density between the deprived and non deprived barrels. B 25μm projection along the axis of arc 2 showing the cortical layers at the level of barrels B. C Mapping of each IEG scan to the reference atlas, with automated isolation of the cortical layer 4 of the primary somatosensory cortex. The induction ratio (number of cells detected between the center of B2 and C2 barrels) is indicated. The detected cell centers are voxelized onto spheres of 375μm of diameter to generate a density map. Scale bars are 200μm.
Figure 3
Figure 3. Isolation of neuronal activity by fully automated cell detection and sample registration
A Whole-mount iDISCO+ immunolabeling of adult mouse brains for c-Fos, with C-row whiskers stimulated for 1h prior to euthanasia (n=3). B Projection along arc 2 of the unprocessed data, with the autofluorescence (in purple) delimiting the barrels. Manual 3D annotation of the upper cortical layers is shown. C Projections of layers 4 (green) and 1,2,3 (red), showing the increased c-Fos+ cell density in the C-row in all upper layers. D Voxelized density maps of the c-Fos+ cells detected in aligned mouse brains. All whisker rows were trimmed except A, B, C, D or E, which were stimulated for 1hr. E Automated isolation of the VPM region, and projection of the aligned density maps on an oblique plane showing the first barrelloid of the stimulated row (B, C or D) and a composite image of the superimposed brains. Abbreviations: VPM: Ventro-Postero Medial Nucleus of the thalamus. Scale bars are 200μm.
Figure 4
Figure 4. Detection of activity changes in the brain after an acute injection of Haloperidol
Automated analysis of c-Fos+ cell distribution in mouse brains harvested 3hr after exposure to Haloperidol or saline (n=4). Panels show the reference annotation with details from the averaged density maps (4 brains averaged), p-value maps and examples of the raw data (25μm orthogonal projection) for the following regions: A Globus Pallidus, internal segment with the Central amygdala and striatum (coronal projections), B Striatum (sagittal projection) and C Ventral Tegmental Area and Subtantia Nigra. D Automated segmentation of the cell counts by anatomical regions sorted by p-values. Data are represented as mean ± SEM. The top hits are presented here (***: p < 0.001, **: p < 0.01, *: p < 0.05). See also Figure S6. Abbreviations: BLAa: BasoLateral Amygdala, anterior part, CEAl: Central Amygdala, lateral part, CPU: Caudoputamen nucleus, FS: Fondus of the Striatum, GP: Globus Pallidus internal or external segment, MD: thalamic MedioDorsal Nucleus, NAc: Nucleus Accumbens, SN: Substentia Nigra, pars compacta or reticulata, VTA: Ventral Tegmental Area. Scale bars are 500μm.
Figure 5
Figure 5. Brain regions differentially regulated by whiskers during an exploration task
Mice had their whiskers shaved or left intact, and allowed to explore a new cage in the dark for 1hr, then brains where harvested and activity was probed by c-Fos immunolabeling (n=5 (shaved group), n=3 (control group)). A Lateral projections of the reference annotation, averaged density maps, p-value maps and standard deviation maps (automated isolation of the neo-cortex). The caudo-medial part of the barrel shows a decreased activity in the shaved group. B Coronal projection at the level of the barrel cortex and VPM thalamic relay, showing decreased activity in the whisker projection field (arrow in the VPM p-value map). C Decreased activity in the Agranular Insula (anterior part) in the shaved group. Abbreviations: CPU: Caudoputamen nucleus, Po: Posterior nucleus of the Thalamus, VPM: VentroPostero Medial nucleus of the thalamus. Scale bars are 2mm (panel a) and 500μm (panels b and c).
Figure 6
Figure 6. Volume survey of brain activity applied to parental behavior in the mouse
Brains obtained from parenting (nesting) female mice, aggressive infanticidal males or their respective controls (no pups) were whole-mount stained for c-Fos, imaged and subjected to automated analysis. A Detail of a ventral horizontal projection (2mm) of the annotation map, averaged female and males density maps showing the hypothalamus and ventral cortical regions. The c-Fos averaged density maps (n=6 per group, except parenting females n=3) show the increased activity in the rostral part of the hypothalamus in females and in the caudal part of the hypothalamus in the males (arrows). B Coronal projections of the reference annotation map, c-Fos density maps, p-value maps and unprocessed data at the level of the MPO (top panels) or Posterior Hypothalamic nucleus (bottom panels). See also Figure S7. Abbreviations: BST: Bed Nucleus of Stria Terminalis, MPO: Medial Pre-optic nucleus. Scale bars are 500μm.
Figure 7
Figure 7. Correlated tracing of axons from the MPO with activity mapping during parental tasks
A Viral tracing of the Galanin+ projections from the MPO with a AAV1-FLEx-ChR2-eYFP virus injected in the MPO region of Galanin-cre mice, imaged with iDISCO+. B-C Extensive cortical projections are seen in the Retro-Splenial Cortex and Cortical Amygdala. Overlay of the volume tracing data with the averaged activity density maps of the females and males groups in horizontal projections (B) and coronal projections (C). Increased activity in the infanticidal males, significantly higher than in any other group, is seen in the CoA region receiving the bulk of the Galanin+ projections from the hypothalamus. Abbreviations: BST: Bed Nucleus of Stria Terminalis, CoA: Cortical Amygdala, RSC: RetroSplenial Cortex, MPO: Medial Pre-optic nucleus. Scale bars are 500μm.

Comment in

  • Catching the Brain in the Act.
    Hrvatin S, Nagy MA, Greenberg ME. Hrvatin S, et al. Cell. 2016 Jun 16;165(7):1570-1571. doi: 10.1016/j.cell.2016.06.008. Cell. 2016. PMID: 27315474

References

    1. Ahrens MB, Li JM, Orger MB, Robson DN, Schier AF, Engert F, Portugues R. Brain-wide neuronal dynamics during motor adaptation in zebrafish. Nature. 2012;485:471–477. - PMC - PubMed
    1. Barnes SJ, Sammons RP, Jacobsen RI, Mackie J, Keller GB, Keck T. Subnetwork-Specific Homeostatic Plasticity in Mouse Visual Cortex In Vivo. Neuron. 2015;86:1290–1303. - PMC - PubMed
    1. Benjamini Y, Hochberg Y. Controlling the false discovery rate: a practical and powerful approach to multiple testing. Journal of the Royal Statistical Society Series B … 1995
    1. Bepari AK, Sano H, Tamamaki N, Nambu A, Tanaka KF, Takebayashi H. Identification of optogenetically activated striatal medium spiny neurons by Npas4 expression. PLoS ONE. 2012;7:e52783. - PMC - PubMed
    1. Berényi A, Somogyvári Z, Nagy AJ, Roux L, Long JD, Fujisawa S, Stark E, Leonardo A, Harris TD, Buzsáki G. Large-scale, high-density (up to 512 channels) recording of local circuits in behaving animals. Journal of Neurophysiology. 2014;111:1132–1149. - PMC - PubMed

Publication types