An official website of the United States government
The .gov means it’s official.
Federal government websites often end in .gov or .mil. Before
sharing sensitive information, make sure you’re on a federal
government site.
The site is secure.
The https:// ensures that you are connecting to the
official website and that any information you provide is encrypted
and transmitted securely.
1 Department of Bioengineering, Stanford University, Stanford, CA 94305, USA; CNC Program, Stanford University, Stanford, CA 94305, USA; Howard Hughes Medical Institute, Stanford University, Stanford, CA 94305, USA.
2 Department of Bioengineering, Stanford University, Stanford, CA 94305, USA; Neurosciences Program, Stanford University, Stanford, CA 94305, USA; Department of Biology, Stanford University, Stanford, CA 94305, USA.
3 Department of Bioengineering, Stanford University, Stanford, CA 94305, USA.
4 Department of Radiology, Stanford University, Stanford, CA 94305, USA.
5 Department of Bioengineering, Stanford University, Stanford, CA 94305, USA; CNC Program, Stanford University, Stanford, CA 94305, USA; Neurosciences Program, Stanford University, Stanford, CA 94305, USA.
6 Department of Bioengineering, Stanford University, Stanford, CA 94305, USA; CNC Program, Stanford University, Stanford, CA 94305, USA.
7 Department of Neurosurgery, Stanford University, Stanford, CA 94305, USA.
8 Biological Sciences, Carnegie Mellon University, Pittsburgh, PA 15213, USA.
9 Department of Biology, Stanford University, Stanford, CA 94305, USA; Howard Hughes Medical Institute, Stanford University, Stanford, CA 94305, USA.
10 Department of Bioengineering, Stanford University, Stanford, CA 94305, USA; CNC Program, Stanford University, Stanford, CA 94305, USA; Department of Psychiatry, Stanford University, Stanford, CA 94305, USA; Howard Hughes Medical Institute, Stanford University, Stanford, CA 94305, USA. Electronic address: deissero@stanford.edu.
A major challenge in understanding the cellular diversity of the brain has been linking activity during behavior with standard cellular typology. For example, it has not been possible to determine whether principal neurons in prefrontal cortex active during distinct experiences represent separable cell types, and it is not known whether these differentially active cells exert distinct causal influences on behavior. Here, we develop quantitative hydrogel-based technologies to connect activity in cells reporting on behavioral experience with measures for both brain-wide wiring and molecular phenotype. We find that positive and negative-valence experiences in prefrontal cortex are represented by cell populations that differ in their causal impact on behavior, long-range wiring, and gene expression profiles, with the major discriminant being expression of the adaptation-linked gene NPAS4. These findings illuminate cellular logic of prefrontal cortex information processing and natural adaptive behavior and may point the way to cell-type-specific understanding and treatment of disease-associated states.
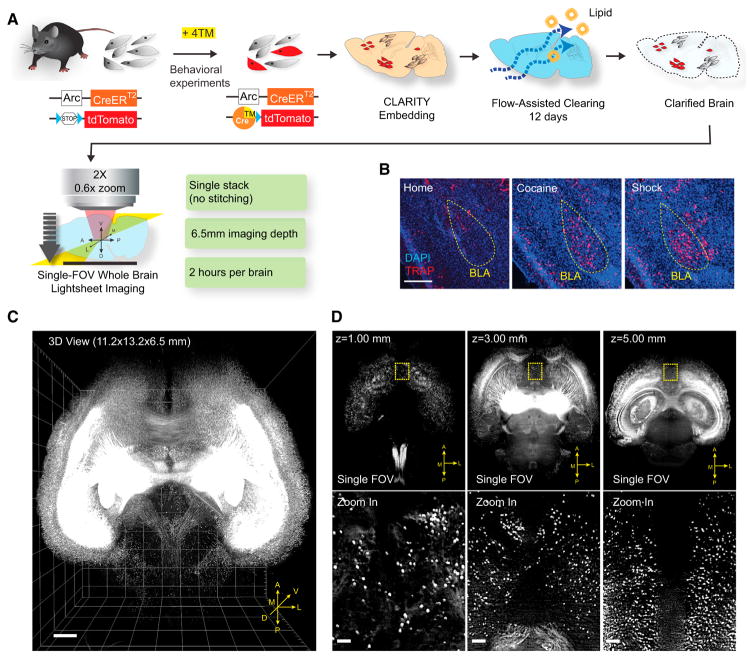
(A) Schematic of ArcTRAP labeling and the enhanced cohort-scale CLARITY pipeline for rapid whole-brain clearing and imaging. CreER expression is driven by the activity-dependent Arc promoter to mediate 4TM-dependent recombination that permanently labels the active neurons with tdTomato. (B) Representative confocal images from 40-μm sections showing TRAP labeling in BLA (yellow circle). Scale bar, 400 μm. (C) 3D rendering of a CLARITY-processed whole-mouse brain (ArcTRAP) imaged by light-sheet microscopy. Scale bar, 500 μm. (D) Top: single field of view (FOV) images at the indicated imaging depths. Bottom: zoomed-in images from the yellow-boxed regions in the top row showing cellular resolution. Scale bar, 100 μm. See also Figure S1.
Figure 2. Cocaine and Shock Recruit Overlapping…
Figure 2. Cocaine and Shock Recruit Overlapping Brain Regions
(A–D) TRAP cells in manually annotated…
Figure 2. Cocaine and Shock Recruit Overlapping Brain Regions
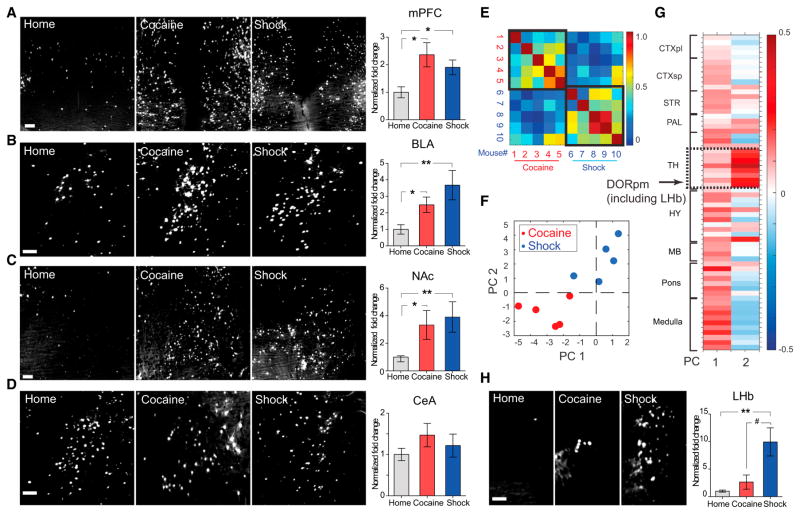
(A–D) TRAP cells in manually annotated regions. Left: representative images taken at the center of the indicated regions (max-projection of 100 μm volume). Scale bars, 100 μm. Right: fold change in TRAP cell numbers (normalized to home cage). (E) Pearson correlation among the ten mice, based on the r-value computed from fold-activation changes relative to home cage across all non-zero-containing brain regions. Note the higher brain-wide correlation values within behavioral groups (black bounding boxes) compared to across-groups. (F) Locations of individual mice projected into the 2D space of the two principal components (PCs) comprising the majority of the variance (in arbitrary PC units), where the position of each mouse corresponds to the extent to which a particular principal component accounts for that mouse’s variance across all brain regions. (G) Principal component coefficients (in arbitrary PC weight units) across brain areas—the contribution of each brain area to each principal component—were summarized as clusters of proximal regions. Note the distinct region-selective contribution to PC 2 (dashed box; detailed in text). CTXpl/sp, cortical plate/subplate; SRT, striatum; PAL, pallidum; TH, thalamus; HY, hypothalamus; MB, midbrain; DORpm, polymodal association cortex-related dorsal thalamus. (H) Representative image and quantification of TRAP cells in LHb. Scale bar, 100 μm. For all panels, n = 5 per group, *p < 0.05, **p < 0.01, unpaired t test comparing behavioral group to home cage; # p < 0.05, unpaired t test comparing cocaine versus shock group. All p values were adjusted for multiple comparisons using the false discovery rate method. Error bars, mean ±SEM. See also Figure S2 and Table S1.
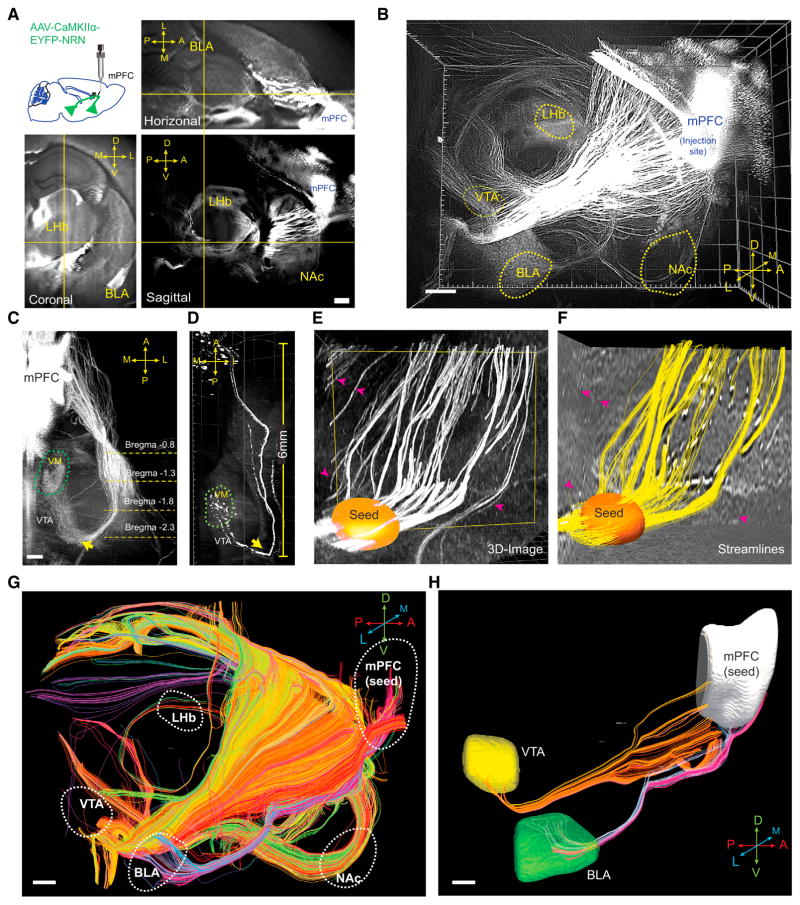
(A) 2D orthogonal views of a mouse brain. Insert shows schematic for location of viral injection. D, dorsal; V, ventral; A, anterior; P, posterior; L, lateral; M, medial. (B) 3D rendering of CLARITY hemisphere, visualizing outgoing mPFC projections (imaged by 2× objective at 0.8× zoom with a single FOV, step size: 4 μm, 1,000 steps). (C) 3D visualization of the axonal bundle projecting from mPFC to VM (ventral medial thalamus), showing tracts turning near the VTA (indicated by arrows). (D) Visualizing the same projection in (C) with sparse labeling by injecting a smaller volume of the same virus (25 nL). (E) Raw image from a CLARITY volume. Orange: user-defined “seed region” so that only the fibers passing this region were tracked. (F) Streamlines reconstructed from (E), using structural tensor-based tractography. Note that fibers in the CLARITY image that did not pass the user-defined seed region were excluded in the reconstruction (indicated by the magenta arrows). (G) Reconstructed brain-wide streamlines from CLARITY image in (B). The streamlines are color-coded for orientation. A–P, red; D–V, green; L–M, blue. (H) Representative computational isolation of mPFC fibers that project to VTA (yellow) or BLA (green). Scale bars, 500 μm. See also Figure S3.
Figure 4. Distinct Projection Targets of Cocaine…
Figure 4. Distinct Projection Targets of Cocaine and Shock-Activated mPFC Populations
(A) Summary of CAPTURE…
Figure 4. Distinct Projection Targets of Cocaine and Shock-Activated mPFC Populations
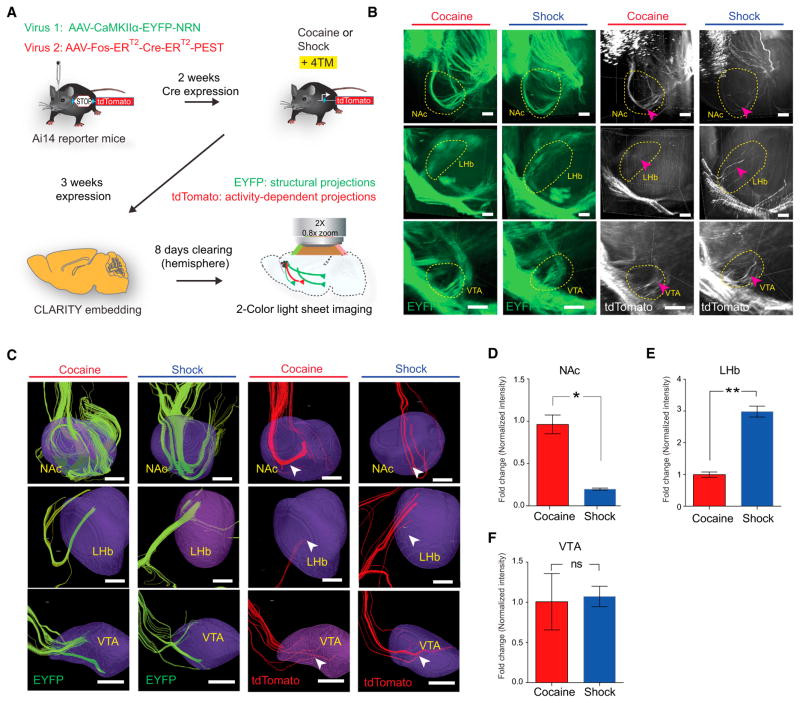
(A) Summary of CAPTURE workflow (described in text). (B) Representative CLARITY images of the structural projections (green, EYFP) and activity-dependent projections (white, tdTomato) from cocaine- and shock-labeled mice in NAc (top), LHb (middle), and VTA (bottom). Arrowheads indicate axon bundles terminating in the circled region. Scale bar, 200 μm. (C) Reconstructed streamlines from(B), showing streamlines terminating in the 3D brain regions (purple). Green streamlines, reconstructed from EYFP fibers; red streamlines, reconstructed from tdTomato fibers. Scale bars, 200 μm. (D–F) Quantification of projection intensity from cocaine- and shock-activated mPFC populations in three regions. Behavior-specific projection intensity was quantified using the ratio between red and green fibers (i.e., the number of red streamlines, divided by the number of green streamlines) terminating in indicated regions and plotted as fold change (relative to the cocaine group, n = 6 per group; ns, p > 0.05, *p < 0.05, **p < 0.01, unpaired t test). Error bars, mean ±SEM. See also Figure S4.
Figure 5. Cocaine Preferentially Activates the NPAS4+…
Figure 5. Cocaine Preferentially Activates the NPAS4+ Population in mPFC
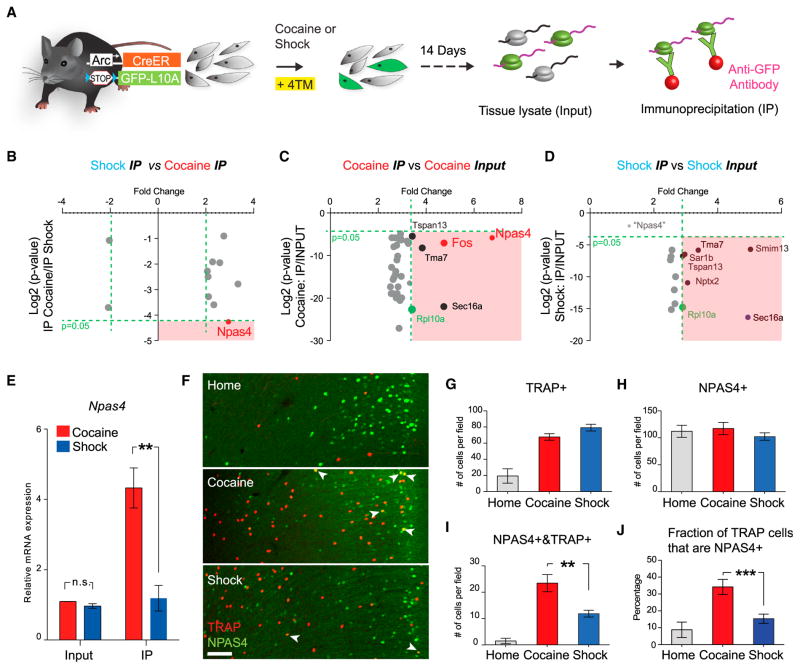
(A) Schematic of activity-dependent ribosome…
Figure 5. Cocaine Preferentially Activates the NPAS4+ Population in mPFC
(A) Schematic of activity-dependent ribosome profiling. Green, activated neurons; gray, non-activated neurons. (B–D) Scatter plot of the most-enriched genes comparing cocaine- versus shock-activated cells (cocaine IP versus shock IP) (B), cocaine IP versus cocaine input (C) and shock IP versus shock input (D). The bottom right quadrant (pink) of each scatter plot denotes genes with p < 0.05 and fold change >2 for the indicated comparisons. As a positive control, the enrichment of RpL10a is highlighted in green. Black dots denote genes that were non-specifically enriched by IP (as shown enrichment in both cocaine and shock IP fraction). In (D), Npas4 (light-gray dot, fold change = 1.35, p value = 0.385) did not approach the statistically significant (pink) quadrant. (E) Quantitative PCR analysis of Npas4 mRNA expression in the input and IP fractions. (F) Representative images showing the overlap between TRAP+ and NPAS4+ cells in the mPFC. Scale bar, 100 μm. Arrowheads indicate double-positive cells. (G–I) Quantification of numbers of TRAP+ (G), NPAS4+ (H), and TRAP+&NPAS4+ (I) cells in the mPFC. (J) Percentage of NPAS4+ cells in TRAP+ cells under three conditions. n = 4 per group, *p < 0.05, **p < 0.01, unpaired t test. Error bars, mean ±SEM. See also Figure S5 and Movie S1.
Figure 6. Use of fosCh for Targeting…
Figure 6. Use of fosCh for Targeting Cocaine- and Shock-Activated mPFC Populations
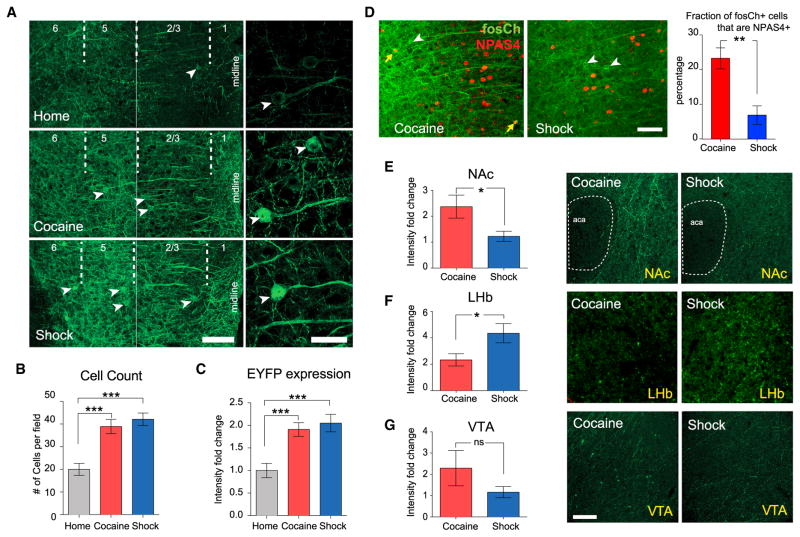
(A) Representative images…
Figure 6. Use of fosCh for Targeting Cocaine- and Shock-Activated mPFC Populations
(A) Representative images showing fosCh expression in mPFC following the indicated behaviors. Left, two 40×images were stitched for visualizing lamina across the cortical depth. Arrowheads indicate fosCh+ neurons. Scale bars, 100 μm. Right, high-magnification images of individual fosCh neurons. Scale bars, 25 μm. (B) Fold change in fosCh cell numbers. (C) Fold change in mean EYFP fluorescence intensity. n = 11–14 per group, ***p < 0.001, unpaired t test. (D) Representative images and quantification of fosCh and NPAS4+ cells. White arrowheads indicate fosCh-positive neurons. Yellow arrows indicate NPAS4/fosCh double-positive cells. n = 5 per group, **p < 0.01, unpaired t test. (E–G) Left: comparing density of fosCh projections for cocaine and shock groups. Right: representative images showing the density of fosCh projections in indicated regions. aca, anterior part of anterior commissure. Scale bars, 100 μm. n = 11–14 per group, *p < 0.05, unpaired t test. Error bars, mean ±SEM. See also Figure S6.
Figure 7. Differential Behavioral Influence of Cocaine-…
Figure 7. Differential Behavioral Influence of Cocaine- and Shock-Activated mPFC Populations
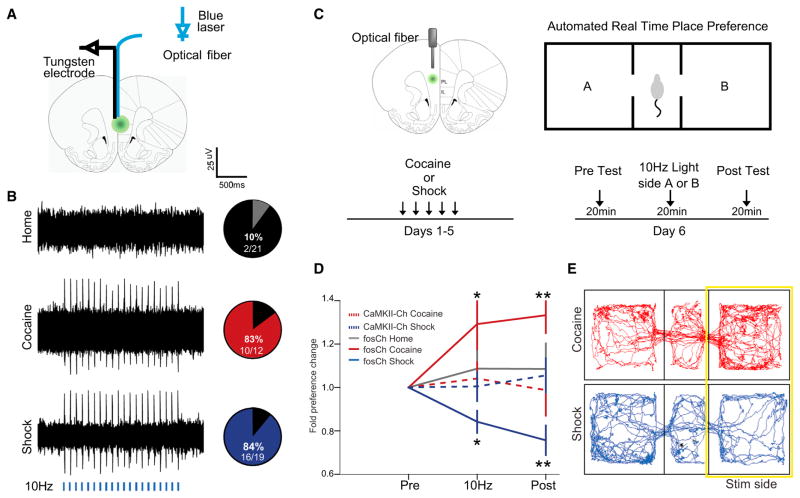
(A) Schematic to illustrate…
Figure 7. Differential Behavioral Influence of Cocaine- and Shock-Activated mPFC Populations
(A) Schematic to illustrate the placement of the recording electrode and optical fiber for in vivo recording. The optrode was lowered in 100 μm steps along the dorsal-ventral axis of mPFC. (B) Left: representative extracellular recordings showing neural response to a 10 Hz light train (5 ms pulses for 2 s, every 5 s, 5 mW 473 nm light, indicated by blue bars). Right: pie charts indicate percentage of recording sites showing light-evoked action potential firing for the home cage (gray), cocaine (red), and shock (blue) groups. (C) Schematic shows the location of the optical fiber positioned above the injection site in green. After 5 days of training, mice were tested by a real time place preference test, which consisted of three consecutive 20-min trials. (D) Behavioral results plotted as fold change in preference for the light stimulated side (normalized by baseline preference) across each of the trials. n = 10–14 per group, *p < 0.05, **p < 0.01, ANOVA, followed by Tukey’s multiple comparison test. Error bars, mean ±SEM. (E) Movement tracking data from representative cocaine- and shock-labeled animals during the light-stimulation trial. See also Figure S7.
Hrvatin S, Nagy MA, Greenberg ME.Hrvatin S, et al.Cell. 2016 Jun 16;165(7):1570-1571. doi: 10.1016/j.cell.2016.06.008.Cell. 2016.PMID: 27315474
References
Akten B, Kye MJ, Hao T, Wertz MH, Singh S, Nie D, Huang J, Merianda TT, Twiss JL, Beattie CE, et al. Interaction of survival of motor neuron (SMN) and HuD proteins with mRNA cpg15 rescues motor neuron axonal deficits. Proc Natl Acad Sci USA. 2011;108:10337–10342.
-
PMC
-
PubMed
Barth AL, Gerkin RC, Dean KL. Alteration of neuronal firing properties after in vivo experience in a FosGFP transgenic mouse. J Neurosci. 2004;24:6466–6475.
-
PMC
-
PubMed
Bloodgood BL, Sharma N, Browne HA, Trepman AZ, Greenberg ME. The activity-dependent transcription factor NPAS4 regulates domain-specific inhibition. Nature. 2013;503:121–125.
-
PMC
-
PubMed
Bouton ME. Context and behavioral processes in extinction. Learn Mem. 2004;11:485–494.
-
PubMed
Burgos-Robles A, Vidal-Gonzalez I, Quirk GJ. Sustained conditioned responses in prelimbic prefrontal neurons are correlated with fear expression and extinction failure. J Neurosci. 2009;29:8474–8482.
-
PMC
-
PubMed